


 Figure 1A: Initialization of the alignment matrix.


« Prev Next »
Since the discovery of the genetic code, biological research has undergone a sea of change in the way it is performed. Until the early twentieth century, biology focused on the processes of living organisms and almost always involved experiments in laboratories and in the field. The growth of molecular biology during the twentieth century moved research into the test tube, where biological systems could be painstakingly dissected and reassembled. Then, beginning in the 1970s, scientists started accumulating DNA and protein sequence data at an exponential rate; in fact, researchers currently have approximately 97 billion bases sequenced and over 93 million records. Amazingly, this sequence data doubles every 18 months!
But how do investigators make sense of this massive amount of data? How can they identify the functions of newly cloned genes? And is it possible to estimate the evolutionary relationships between genes or proteins just by examining their nucleotide or amino acid sequences? To address these important issues, researchers must first tease out the relationships between different species that are descended from a common ancestor. Any sequence similarity can then be used to infer function and evolutionary relationships. In fact, one common method for examining and comparing genes is to search for similarities between newly sequenced DNA and databases of gene sequences that have already been described. By identifying related genes or gene families with known functions, scientists can infer the functions and evolutionary relationships of newly cloned genes or even whole genomes.
As gene and protein sequence databases grew at the end of the twentieth century, scientists turned to computers to help analyze this abundant and ever-growing amount of data. Today, one of the most common tools used to examine DNA and protein sequences is the Basic Local Alignment Search Tool, also known as BLAST (Altschul et al., 1990). BLAST is a computer algorithm that is available for use online at the National Center for Biotechnology Information (NCBI) website, as well as many other sites. BLAST can rapidly align and compare a query DNA sequence with a database of sequences, which makes it a critical tool in ongoing genomic research. In fact, the initial paper describing the program, published in the Journal of Molecular Biology and entitled "Basic Local Alignment Search Tool," was the most highly cited publication of the 1990s (Taubs, 2000). In recent years, the parallel development of large-scale sequencing projects and bioinformatic tools like BLAST has enabled scientists to study the genetic blueprint of life across many species, and it has also helped connect biology and computer science in the maturing field of bioinformatics.
Alignment Theory
Although the computer science principles behind BLAST have been around for some time, prior to BLAST, they had not been applied to biology. Before BLAST, alignment programs used dynamic programming algorithms, such as the Needleman-Wunsch and Smith-Waterman algorithms, that required long processing times and the use of supercomputers or parallel computer processors (Collins & Coulson, 1984; Gotoh & Tagashira, 1986; Smith & Waterman, 1981).
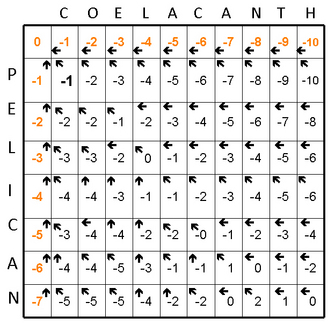
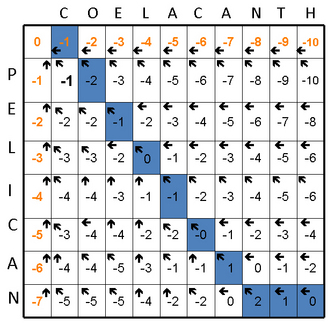
Figure 1 depicts a Needleman-Wunsch alignment of the words "PELICAN" and "COELACANTH." The search space of the alignment is shown using a Cartesian grid and is proportional to the length of the sequences being compared plus one extra row and column (Figure 1A).
Adapted with permission from Korf, I., Yandell, M. & Bedell, J. BLAST O’Reilly Media, Inc. 2003. All rights reserved. 
Next, the alignment matrix is initialized with a zero in the upper left corner. For each letter of the word being aligned, a point is deducted so that each letter has a progressively more negative score. Why does the algorithm subtract a point? In an alignment, the diagonal is read from the upper left to the lower right, and when the analysis moves vertically or horizontally, it indicates a gap in the sequence. Thus, each time the program moves straight up or down, a gap penalty is applied that takes away points from the alignment score. Finally, a little arrow, or pointer, is added to indicate which direction to follow the alignment (Figure 1B). In the third stage, the algorithm starts to actually build and score the alignment in a step called fill, or induction.
In this example, the analysis begins by aligning the C to the P and calculating a score. In Figure 1C, one point is added if two letters match, and one point is subtracted if they do not. This calculation is carried out three times, once for each square to the left (dark blue), above (green), and to the upper left (brown). Using a value from either the upper square or the left square, the final score is -2 (-1 + -1). Using the 0 score in the upper left diagonal square, the final score is -1 (0 + -1). Because -1 is the highest score, this score is jotted down in the alignment matrix, and because the upper left square was the one leading to the best score, an arrow is inserted in the box pointing toward this square (light blue, Figure 1C).
This same process continues, calculating two scores for every square in the matrix (Figures 1D and 1E). At the end, there is a completely scored matrix with a series of arrows used to find the optimal alignment (Figure 1F).
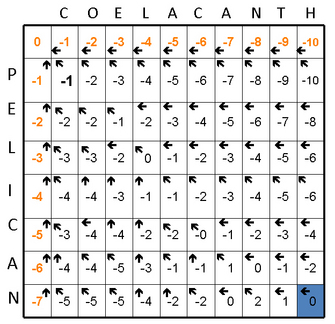
The final steps of generating an alignment are called traceback, and they involve finding the optimal, highest-scoring alignment. The traceback starts in the lower right of the matrix (Figure 1F) and follows the pointers to the adjacent boxes. By definition, this will be the best scoring path through the alignment (Figure 1G).
Adapted with permission from Korf, I., Yandell, M. & Bedell, J. BLAST O’Reilly Media, Inc. 2003. All rights reserved.
Adapted with permission from Korf, I., Yandell, M. & Bedell, J. BLAST O’Reilly Media, Inc. 2003. All rights reserved.
Although this sort of dynamic programming did a complete job of comparing every single residue of one sequence to every single residue of a second sequence and kept track of how well the sequences aligned at every step, these algorithms required a considerable amount of computer memory and processing time. Computing speed was an especially important concern, because these exhaustive programs had to search databases that continued to grow at exponential rates. Moreover, most regions of the search space did not score very well and therefore probably could have been skipped during the calculation process. Finally, these programs required powerful computing hardware that was expensive, rare, and ultimately impractical for most scientists and labs.
Researcher Stephen Altschul and colleagues wanted to bypass these challenges and develop a way for databases to be searched quickly on routinely used computers. In order to increase the speed of alignment, the BLAST algorithm was designed to approximate the results of an alignment algorithm created by Smith and Waterman (1981), but to do so without comparing each residue against every other residue (Altschul et al., 1990). BLAST is therefore heuristic in nature, meaning it has "smart shortcuts" that allow it to run more quickly (Madden, 2005). However, in this trade-off for increased speed, the accuracy of the algorithm is slightly decreased.
The BLAST Heuristic
Adapted with permission from Korf, I., Yandell, M. & Bedell, J. BLAST O’Reilly Media, Inc. 2003. All rights reserved.
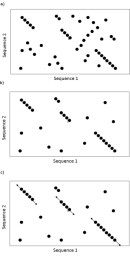
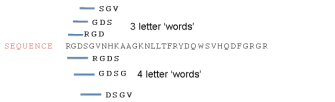
BLAST increases the speed of alignment by decreasing the search space or number of comparisons it makes. Specifically, instead of comparing every residue against each other, BLAST uses short "word" (w) segments to create alignment "seeds." BLAST is designed to create a word list from the query sequence with words of a specific length, as defined by the user (Figure 2). Requiring only three residues to match in order to seed an alignment means that fewer sequence regions need to be compared. Larger word sizes usually mean that there are even fewer regions to evaluate (e.g., Figure 3A compared to Figure 3B). Once an alignment is seeded, BLAST extends the alignment according to a threshold (T) that is set by the user. When performing a BLAST query, the computer extends words with a neighborhood score greater than T (Figure 3C). A cutoff score (S) is used to select alignments over the cutoff, which means the sequences share significant homologies. If a hit is detected, then the algorithm checks whether w is contained within a longer aligned segment pair that has a cutoff score greater than or equal to S (Altschul et al., 1990). When an alignment score starts to decrease past a lower threshold score (X), the alignment is terminated (Figure 3C). These and many other variables can be adjusted to either increase the speed of the algorithm or emphasize its sensitivity.
Testing the BLAST Algorithm
Altschul and colleagues tested the BLAST algorithm on a database of randomly generated sequences, and they examined the output resulting from different w and T parameters. If T is set to be a lower threshold, then the algorithm detects more word pairs and requires a longer processing time (Altschul et al., 1990). Thus, choosing the value for T was a major decision because the researchers wanted to reach a compromise between the algorithm's sensitivity and its processing time (e.g., Figure 3A compared to Figure 3B).
Next, Altschul and colleagues tested BLAST on a database of real sequences, and they found it was successful in quickly identifying alignments with high scores. In searching the globin gene family, for example, they found that BLAST identified 88 of the 89 globin alignments that scored above 80. Other gene families, including the immunoglobulins, protein kinases, and cytochrome c genes, were then examined to measure the number of alignments detected when using different T and S values. BLAST was also able to detect similar regions within pairs of long sequences. These tests therefore showed that BLAST was fast, sensitive, and accurate as a tool for analyzing sequence alignments (Altschul et al., 1990).
Bringing Mathematical Rigor to Alignment
One of the most notable innovations of BLAST is that the program calculates the statistical significance for each sequence alignment result. This is known as the expect value (E-value) or probability value (P-value), and it is calculated for each alignment. The E-value describes how many hits you can expect to see by chance when searching a database of a certain size, whereas the P-value describes the probability that the alignment you are observing is due to chance. In general, the lower the E- or P-value is, the more likely it is that an alignment is significant. Below the common 10-5 score, P and E are roughly equivalent (Madden, 2005).
The addition of statistical rigor to sequence alignment has been controversial. Some researchers rely too much on significance values to include or exclude sequences despite poorly chosen parameters, whereas others over-interpret "insignificant" results because the results "look" right. While all scientific results are subject to interpretation, BLAST scores and statistics bring much-needed objectivity to sequence comparisons, and the debate about them has helped improve methods for determining significance.
The BLAST Family
Since 1990, many variants of BLAST have been developed, each with specialized features. Early on, the original BLAST was split into two adaptations: NCBI BLAST and Washington University BLAST (WU BLAST). Both BLASTs have program variations. For instance, BLASTN can be used to compare a nucleotide sequence with a nucleotide database; BLASTP can be used to compare a protein sequence with a database of protein sequences; and BLASTX can take a nucleotide sequence, translate it, and query it versus a protein database in one step (Gish & States, 1993). TBLASTN compares a protein query sequence to all six possible reading frames of a database and is often used to identify proteins in new, undescribed genomes. Finally, TBLASTX compares all six reading frames of a query sequence to all six reading frames of a database-an intensive algorithmic feat that can bring even modern computers to a grinding halt if not used properly.
In addition, NCBI has some of its own specialized variants of BLAST. For example, MEGABLAST is a program that can rapidly complete searches for sequences with only minor variations and can more efficiently manage queries with longer sequences (Altschul et al., 1994). PSI- and PHI- are other powerful BLAST tools that allow more complex and evolutionary divergent proteins to be aligned (Altschul et al., 1997). These and other programs, as well as genomic BLAST databases, are all available on the NCBI BLAST website. Conclusion
Thus, since its creation, BLAST has become an essential tool for biologists. Its speed and sensitivity allow scientists to compare nucleotide and protein sequences to both single sequences and large databases. Most importantly, BLAST has helped democratize bioinformatics analysis and make it accessible to any researcher over the Internet; indeed, it is rare to read a modern molecular biology paper that does not refer to a BLAST alignment. In short, BLAST and its descendant applications have permitted scientists to predict the functions of genes and proteins in whole genomes, answering questions in silico that could never be answered at a lab bench or in the field.
References and Recommended Reading
Altschul, S. F., et al. Basic Local Alignment Search Tool. Journal of Molecular Biology 215, 403–410 (1990) doi:10.1016/S0022-2836(05)80360-2 (link to article)
Altschul, S. F., et al. Issues in searching molecular sequence databases. Nature Genetics 6, 119–129 (1994) doi:10.1038/ng0294-119 (link to article)
Altschul, S. F., et al. Gapped Blast and PSI-Blast: A new generation of protein database search programs. Nucleic Acids Research 25, 3389–3402 (1997)
Collins, J. F., & Coulson, A. F. Applications of parallel processing algorithms for DNA sequence analysis. Nucleic Acids Research 12, 181–192 (1984)
Gish, W., & States, D. J. Identification of protein coding regions by database similarity search. Nature Genetics 3, 266–272 (1993) doi:10.1038/ng0393-266 (link to article)
Gotoh, O., & Tagashira, Y. Sequence search on a supercomputer. Nucleic Acids Research 14, 57–64 (1986)
Korf, I., Yandell, M., & Bedell, J. BLAST: An Essential Guide to the Basic Local Alignment Search Tool (O'Reilly, Sebastopol, CA, 2003)
Madden, T. The BLAST sequence analysis tool. In NCBI Handbook, ed. J. McEntyre and J. Ostell (National Library of Medicine, Bethesda, MD, 2005)
Smith, T. F., & Waterman, M.S. Identification of common molecular subsequences. Journal of Molecular Biology 147, 195–197 (1981) doi:10.1016/0022-2836(81)90087-5
Taubs, G. Sense from sequences: Stephen F. Altschul on bettering BLAST. Science Watch 11, 3–4 (2000)


