


 Figure 1


« Prev Next »
Consider this: Almost all oysters in the Gulf of Mexico are infected with a flesh-eating bacterium, Vibrio vulnificus (Hlady & Klontz, 1996). The good news? Fewer than 50 cases of V. vulnificus infection are reported in humans each year. The bad news? Half of those patients will die, often within hours of becoming infected.
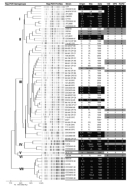
One of the biggest enigmas surrounding this situation is why so few people develop rapid and fulminating infection after ingesting raw oysters or walking barefoot over sharp oyster beds, although numerous other individuals—even some who are immunocompromised—do not (Hlady et al., 1993). In the case of this flesh-eating pathogen, the answer seems to lie in the fact that not all V. vulnificus cells are created equal, at least with regard to virulence. Specifically, some strains are capable of causing debilitating disease, while others aren't quite as life-threatening (Figure 1; Chatzidaki-Livanis et al., 2006).
Keep in mind that all of the isolates in Figure 1 are strains of the same species (i.e., V. vulnificus), and these strains presumably share most, if not all, of the same genes. Yes this analysis suggests a great deal of genetic variation between different strains, which were isolated from different locations. Clearly, then, there's more to virulence than meets the eye! Some of this variation in virulence can be explained by the host; for example, certain people may be predisposed to infection because of their immune status or genetic makeup. But in the case of V. vulnificus, multiple studies have shown that some strains are better than others at causing disease, regardless of the condition of the host.
So, how do scientists tease out the genetic origins of virulence, particularly when an organism does not always cause disease? And how do researchers take into account the genetic variations in a host that play a critical role in disease and infection? In short, they rely on comparative genomics and microarray analysis.
Comparing Strains to Identify Gene-Disease Correlation
One way of comparing two different strains of cells is to look for polymorphisms, or differences, in their genomic sequences. In Figure 1, scientists used rep-PCR (a form of genomic fingerprinting that involves primers specific to naturally occurring repetitive sequences) to look for genetic polymorphisms in the clinical and environmental strains. The results reveal the degree to which each of the isolates is related. Take a look at the similarity scale at the bottom of Figure 1, and note that the clinical isolates (i.e., the bacteria obtained from patients with septicemia or wounds) segregate into genogroups I, IV, and VII. Also note that with a few exceptions, most of the environmental strains (i.e., those obtained from oysters or other nonhuman sources) coincide with genogroups II and III. Thus, the differences between genotypes I and II, for example, may hold important clues about the genetic variations that make the clinical strains more deadly than the strains that were isolated from the environment.
Indeed, after generating these results, the scientists who carried out the study next assessed the genotype profiles of the clinical and environmental strains, focusing on sequences containing previously identified genetic polymorphisms. To do this, they performed PCR analysis using primers capable of differentiating between two genotypes in each of three locations: 16S ribosomal RNA; a virulence-associated locus that had been previously identified by random amplification of polymorphic DNA (RAPD); and the sequence encoding capsular polysaccharide, a protective shell that helps pathogens escape phagocytosis by host immune cells.
Take a look at the right side of Figure 1, which shows the results of this round of PCR analysis. The clinical strains are highlighted in black and gray, while the environmental strains are unshaded. Do you see a pattern in the genetic content of the clinical strains versus that of the environmental strains? You probably noticed that most clinical strains are of the 16S type B, RAPD type C, and CPS type 1 genotype, while most environmental strains are of the 16S type A, RAPD type E, and CPS type 2 genotype. The exceptions - clinical strains with "environmental" genotypes - speak to the role of human variation: Even strains with less virulent genotypes may be able to cause rapid and debilitating disease if they infect an immunocompromised person.
Thus, these findings show that even the tiniest differences in nucleotide sequence may transform a benign oyster-dwelling bacterium into a lethal pathogen. It is important to note that these experiments only identify potential causes of infection (i.e., genetic changes that correlate with the pathogenicity of certain strains), however. Additional experiments are required to definitively show that these specific variations are indeed causal in the disease state.
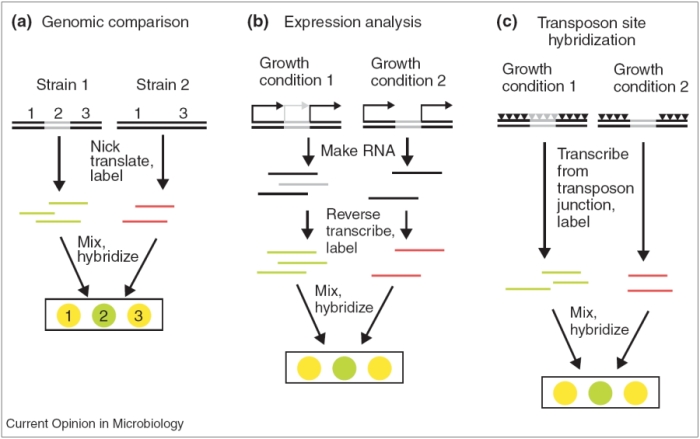
Figure 2: Strategies for identifying virulence genes using microarrays.
Microarray-based methods for the study of pathogenic bacteria. (a) Comparative genomic hybridization compares the chromosomal DNA content of two related strains. Genomic DNA is isolated from two strains and labeled with different fluorophores (red or green). The samples are then mixed and hybridized to a microarray, which generally contains fragments that are complementary to each gene in the genome. Chromosomal regions that differ between the strains are identified by comparing the intensities of the two fluorophores for each locus represented on the microarray. Yellow represents the binding of both red- and green-labeled DNA. (b) Expression analysis measures the relative abundance of RNA transcripts in bacteria subjected to different stimuli. RNA is isolated from two pools of bacteria that were grown under different conditions and the RNA is labeled with different fluorophores. Stimulus-specific gene expression patterns are determined by simultaneous hybridization of the RNA samples to a microarray. (c) Transposon site hybridization identifies conditionally essential genes. Each mutant strain carries a single transposon insertion (triangle). The figure depicts multiple insertions present in a pool of mutants. Two mutant pools are subjected to different growth conditions. Strains harboring insertions in genes that are essential for growth under a particular condition are lost from the pool. Labeled RNA that is complementary to the chromosomal DNA adjacent to each insertion site is generated from each pool. Microarray hybridization detects genes that have been lost from the pool that are essential for growth in the specific condition.
© 2002 Elsevier Sassetti, C. et. al., Genomic analyses of microbial virulence, Current Opinion in Microbiology 5, 27–32 (2002). All rights reserved. 
High-Throughput Approaches to Studying Virulence
While techniques such as rep-PCR and multi-locus PCR analysis are still widely used to study virulence, scientists are increasingly taking advantage of high-throughput techniques, such as microarrays, which allow the examination of entire genomes in a single sitting.
Take a moment to visualize how microarrays work. On the surface of a glass slide, you can barely make out a grid of tiny dots. The dots resemble faint water droplets, but don't be fooled. Each dot typically corresponds to a short oligomer or PCR product from a single gene. Often, most of the genes within the genome are represented on the array. These genes might be spotted multiple times to enhance reproducibility. But not to worry—microarrays come with maps that reveal the exact positions of each gene, which greatly aids in the interpretation of results.
Microarrays allow you to compare two things (Figure 2; Sassetti & Rubin, 2002). For example, when microarrays are used for comparative genomics, scientists might compare chromosomal DNA from two different strains (e.g., clinical and environmental) to see which genes are present in which strain. On the other hand, when microarrays are used for expression analysis, scientists might grow the same organism in two different conditions (e.g., a clinical strain might be grown in either oysters or a cell culture) to assess differences in gene expression that are specific to each environment. Scientists might also compare gene expression in a wild-type strain and a mutant strain after growth in the same conditions (e.g., a clinical strain with a mutation in a suspected virulence gene might be compared with a wild-type clinical strain after both are grown in mouse models).

Figure 3: Example of microarray data.
Microarray analysis can be performed to assess differences in gene expression between two different samples. After isolating nucleic acids from the two samples, one sample is labeled with a dye that fluoresces green, and the other sample is labeled with a dye that fluoresces red. The samples are combined in equal amounts and hybridized to the array. Each spot on a microarray contains a specific gene sequence. When the array is scanned, green or red spots indicate expression of the gene in only one sample, and yellow spots indicate expression of the gene in both samples.
© 1996 Nature Publishing Group DeRisi, J. et al. Use of a cDNA microarray to analyse gene expression patterns in human cancer. Nature Genetics 14, 459 (1996). All rights reserved.
Now that you've seen how an actual microarray appears, take another look at each of the methods shown in Figure 2. Comparative genomic hybridization allows researchers to answer questions such as, "How does the genetic content of two organisms differ?" This approach has become increasingly common in recent years, as the genomic sequences of more and more organisms have become available. It is important to remember that the term "comparative genomics" can refer to any method that compares the genetic makeup of multiple organisms, while the term "comparative genomic hybridization" (CGH) specifically refers to the use of arrays. These experiments involve extracting genomic DNA from two different organisms, labeling one DNA preparation with red dye and the other with green dye, mixing the samples together, and hybridizing the mixture to the array. Spots will turn yellow if both red and green samples bind, indicating that a certain gene is present in both organisms. This type of experiment was performed in Figure 4 to compare the genetic composition of Bacillus anthracis, the bacterium whose toxins elicit inhalational anthrax, to those of less pathogenic Bacillus strains (Read et al., 2003).
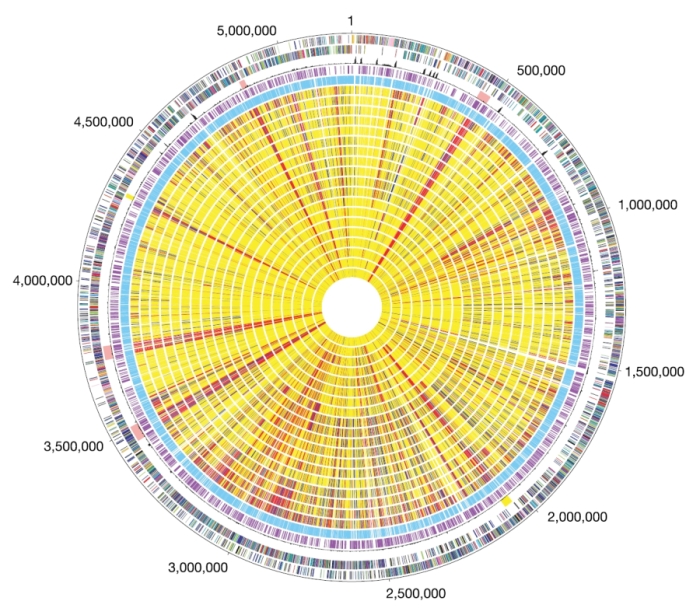
Figure 4: Circular representation of the B. anthracis chromosome and comparative genome hybridizations of B. cereus group strains.
Outer circle, predicted coding regions on the plus strand colour-coded by role categories. Circle 2, predicted coding regions on the minus strand colour-coded by role categories. Circle 3, atypical nucleotide composition curve. Salmon colour, phage regions; yellow, other unique regions located around positions 2.0 and 4.3 Mb. Circle 4, genes not represented on the array. Circle 5, genes present on the array. Genes were classified into three groups: genes present in the query strain (shown yellow), genes absent in the query strain (red), and diverged genes (blue). Missing data are in grey.
© 2003 Nature Publishing Group Read, T. D. et al. The genome sequence of Bacillus anthracis Ames and comparison to closely related bacteria. Nature 423, 83. All rights reserved.
© 2007 American Society for Microbiology Day, W. A. et al. Microarray analysis of transposon insertion mutations in Bacillus anthracis: global identification of genes required for sporulation and germination. Journal of Bacteriology 189, 3296–3301 (2007). All rights reserved.
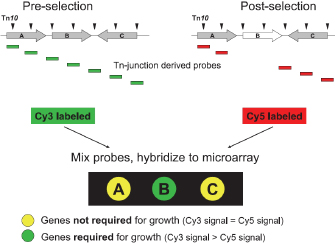
Finally, transposon site hybridization (Figure 2c) was developed to answer questions such as, "What genes are essential for growth in the host?" Scientists can use this technique to study genes that are conditionally essential, which means they are required for growth in a certain environment. Here, scientists first generate transposon libraries using commercial kits that generate hundreds of different mutant strains, each carrying a single transposon. These mutant strains can be combined into two pools. In Figure 5, two such pools are shown, with the triangles corresponding to the various transposons that are present in each pool. During growth, strains that carry mutations in essential genes are lost. The cells are then harvested after growth, and primers specific to the transposon sequences are used to generate RNA that is complementary to the DNA surrounding the mutation. Next, the RNA is reverse-transcribed into cDNA, labeled with either green or red dye, and hybridized to the array. If a particular gene is required for survival in a certain condition (e.g., in human tissue or an animal model), only one dye color will fluoresce. The procedure is shown in Figure 5 (Day et al., 2007).
Discovering the Genetic Origins of Virulence
Using the high-throughput methods described in the previous section, scientists are able to analyze the expression of thousands of genes at once, quickly identifying potential targets for future drug therapies. In the case of V. vulnificus, these techniques can be used by scientists to answer several important questions, such as the following:
- What genes or polymorphisms are present in virulent strains, but not in commensal (i.e., avirulent) strains?
- What genes are highly expressed during infection of the human (or animal) host?
- What genes are required for growth in the host?
The answers to these questions offer important clues regarding the genetic origins of virulence. Indeed, scientists are currently employing these techniques to understand precisely why so few individuals become infected with V. vulnificus even though so many people come into contact with this flesh-eating pathogen.
References and Recommended Reading
Bumann, D., & Valdivia, R. H. Identification of host-induced pathogen genes by differential fluorescence induction reporter systems. Nature Protocols 2, 770–777 (2007) doi:10.1038/nprot.2007.78 (link to article)
Chatzidaki-Livanis, M., et al. Genetic distinctions among clinical and environmental strains of Vibrio vulnificus. Applied and Environmental Microbiology 72, 6136–6141 (2006) doi:10.1128/AEM.00341-06
Day, W. A., et al. Microarray analysis of transposon insertion mutations in Bacillus anthracis: Global identification of genes required for sporulation and germination. Journal of Bacteriology 189, 3296–3301 (2007) doi:10.1128/JB.01860-06
Hlady, W. G., & Klontz, K. C. The epidemiology of Vibrio infections in Florida, 1981-1993. Journal of Infectious Diseases 173, 1176–1183 (1996)
Hlady, W. G., et al. Vibrio vulnificus from raw oysters. Journal of the Florida Medical Association 80, 536–538 (1993)
Lombardo, M. J., et al. An in vivo expression technology screen for Vibrio cholerae genes expressed in human volunteers. Proceedings of the National Academy of Sciences 104, 18229–18234 (2007) doi:10.1073/pnas.0705636104
Read, T. D., et al. The genome sequence of Bacillus anthracis Ames and comparison to closely related bacteria. Nature 423, 81–86 (2003) doi:10.1038/nature01586 (link to article)
Sassetti, C., & Rubin, E. J. Genomic analyses of microbial virulence. Current Opinion in Microbiology 5, 27–32 (2002) doi:10.1016/S1369-5274(02)00281-3


