
Abstract
Red flesh apple (Malus pumila var. medzwetzkyana Dieck), purple leaf plum (Prunus cerasifera Ehrhar f), and purple leaf peach (Prunus persica ‘Atropurpurea’) are significant ornamental plants within the Rosaceae family. The coloration of their fruits and leaves is crucial in their appearance and nutritional quality. However, qualitative and quantitative studies on flavonoids in the succulent fruits and leaves of multicolored Rosaceae plants are lacking. To unveil the diversity and variety-specificity of flavonoids in these three varieties, we conducted a comparative analysis of flavonoid metabolic components using ultra-high-performance liquid phase mass spectrometry (UPLC-MS/MS). The results revealed the detection of 311 metabolites, including 47 flavonoids, 105 flavonols, 16 chalcones, 37 dihydroflavonoids, 8 dihydroflavonols, 30 anthocyanins, 14 flavonoid carbon glycosides, 23 flavanols, 8 isoflavones, 11 tannins, and 12 proanthocyanidins. Notably, although the purple plum and peach leaves exhibited distinct anthocyanin compounds, paeoniflorin and corythrin glycosides were common but displayed varying glycosylation levels. While the green purple leaf peach fruit (PEF) and red flesh apple leaf (AL) possessed the lowest anthocyanin content, they exhibited the highest total flavonoid content. Conversely, the red flesh apple fruit (AF) displayed the highest anthocyanin content and a diverse range of anthocyanin glycosylation modifications, indicating that anthocyanins predominantly influenced the fruit's color. Purple PLF, PLL, and PEL showcased varying concentrations of anthocyanins, suggesting that their colors result from the co-color interaction between specific types of anthocyanins and secondary metabolites, such as flavonols, flavonoids, and dihydroflavonoids. This study provides novel insights into the variations in tissue metabolites among Rosaceae plants with distinct fruit and leaf colors.
Introduction
Rosaceae plants, like peaches, apples, and plums, are economically important fruits consumed worldwide1. Apart from their aesthetic appeal, they serve as vital sources of nutrition for humans and have been extensively studied for their nutritional and functional value2. Anthocyanin, a health-promoting pigment, imparts a dark color to Rosaceae fruits and leaves3. Anthocyanins find applications in food coloring, as well as in dyes, medicine, cosmetics, etc.4. Additionally, the diverse range of Rosaceae fruit types offers an excellent opportunity to study color formation and fruit breeding5.
Flavonoids, essential secondary metabolites, play a significant role in protecting plants against various stresses6. Flavonoids encompass yellow pigments derived from flavonoids, including chalcone, dihydroflavonoids, Flavones, and anthocyanins7. In plants, flavonoids primarily exist as glycosides bound to sugars or in free form8.
Flavonoids are important polyphenols synthesized in plants and are bioactive secondary metabolites, mainly include flavonoids, flavanones, isoflavones, flavonols, flavanones, anthocyanins, which are abundant in plants9. Flavonoids are widely distributed in plants, such as fruits, vegetables, tea and so on. According to its chemical structure, oxidation degree and unsaturation of connecting chain, it can be divided into flavones, flavanones, isoflavones, flavonols and anthocyanins10. Usually, different kinds of plants contain different types of dominant flavonoids. For example, flavones, such as luteolin and apigenin, are enriched in sweet pepper and celery respectively11,12; flavanones are mainly found in citrus fruits, including hesperidin and naringin13; isoflavones are mainly found in soybeans and legumes14; flavonols, including quercetin and rutin, are widely found in vegetables and fruits, with the highest content of red onion15; flavanols are mainly catechins, of which green tea is the most abundant16; anthocyanins determine the color of plants and are usually found in large quantities in colored stems, leaves, flowers and fruits17.
The high flavonoid content in Rosaceae fleshy fruits, especially as a natural source of anthocyanins18, contributes to their popularity. Recent studies have extensively investigated anthocyanins due to their potential health benefits, including antioxidant, anti-aging, anti-carcinogenic properties, and other biological activities19. Oxidative stress (OS) is considered an important factor causing aging and disease20. Anthocyanins belong to bioflavonoids, whose main physiological functions are free radical scavenging and antioxidant capacity. Studies have shown anthocyanins to be the most effective antioxidants and powerful free radical scavengers, as evident from their antioxidant activity being 50 and 20 times higher than Vitamin E (VE) and Vitamin C (VC), respectively21. Additionally, anthocyanin extracts at certain concentrations have demonstrated effective carcinogenesis prevention activity at varying stages22. In food applications, anthocyanins serve as nutritional fortifiers and natural, safe, and healthy preservatives23.While red flesh apple, purple leaf plum, and purple leaf peach, as ancient Rosaceae varieties, exhibit higher anthocyanin contents in fruits and leaves compared to common apples24, peaches25, and plums26, there is limited comparative research on flavonoids and antioxidant activity between succulent fruits and leaves among different Rosaceae plants. Flavonoid metabonomics is a valuable method for evaluating the comprehensive expression profile of flavonoids and studying subtle changes in hundreds of low-concentration metabolites.
This study utilized the succulent fruits and leaves of Rosaceae's red-fleshed apples, purple-leaf plums, and purple-leaf peaches as experimental materials to investigate the metabolic differences that may contribute to the distinct coloration of succulent fruits and leaves in the Rosaceae family. Ultra-high performance liquid chromatography–mass spectrometry (UPLC-MS) was used to detect flavonoid accumulation in these tissues. The findings of this study offer essential theoretical support for evaluating the content and mechanisms underlying the color formation of major flavonoid metabolites in Rosaceae plants, thereby guiding future breeding strategies.
Materials and methods
Sampling of plant materials and preparation of extracts
The fruit (AF) and leaf (AL) of the red flesh apple (Malus pumila var. medzwetzkyana Dieck), the fruit (PLF) and leaf (PLL) of the purple leaf plum (Prunus cerasifera Ehrhar f), and the fruit (PEF) and leaf (PEL) of the purple leaf peach (Prunus persica ‘Atropurpurea’) were collected from the Horticultural Experimental Station of Shandong Agricultural University. After collection, the tissue samples were rinsed with tap water and then sterilized water. Subsequently, they were frozen in liquid nitrogen and stored at – 80 °C in a refrigerator until further analysis. Each treatment comprised three biological repeats, with each repeat comprising five separate plant samples. No approvals were required for the study, which complied with all relevant regulations.
The preparation of the extract refers to the method described by Medda27 and is slightly improved. Fruits (pericarp and 1 mm pulp) and leaves are ground with liquid nitrogen. After grinding the plant tissue in an ice bath, the plant tissue was transferred to a 15 mL calibration test tube, and 0.1% HCl-ethanol solution was used to rinse the mortar and fix the volume. Ultrasonic extraction for 2 h, then 8000g room temperature centrifugation 10 min, the supernatant was taken to be determined. Each sample was extracted three times. The dry matter of 1 g fresh sample was determined after drying at 65 °C for 24 h.
Determination of total flavonoids and anthocyanins
The contents of total flavonoids in fruits and leaves were determined by aluminum nitrate colorimetry and modified according to yang's method28. The content of total flavonoids was determined at 510 nm, and the content of flavonoids in the sample was determined with rutin (mg RE/g DW) as the control substance. The standard curve was established as follows: y = 5.02x + 0.0007, R2 = 0.9996. The results were expressed by the number of milligrams of rutin equivalent (rutin equivalent, RE) per gram of sample dry weight (dry weight, DW) (mg RE g−1DW).
The content of total anthocyanins was determined according to the method described by Lee29. The supernatant was mixed with pH 1 potassium chloride solution (0.025 M), and pH 4.5 sodium acetate solution (0.4 M) was added to the same supernatant to prepare blank. After incubation at room temperature for 30 min, the absorbance values at 520 and 700 nm were measured. The content was calculated by Lee's equation29. The results were expressed as anthocyanin 3-glucoside equivalent (C3G)/g DW mg.
Sample preparation and extraction
The biological samples were prepared according to the method described by Chen et al.30. Freeze drying was carried out using a Scientz-100F vacuum freeze dryer, and then crushed at a speed of 30 Hz in a Retsch MM 400 mixer mill with zirconia beads.
According to the method of Yu et al.31. 100 mg freeze-dried powder was dissolved in 1.2 mL 70% methanol solution. The mixture was swirled for 30 s every 30 min and repeated for 6 times. The sample is then placed in a refrigerator at 4 °C overnight. After centrifugation at 12,000 rpm for 10 min, a SCAA-104 filter with an aperture of 0.22 μm (ANPEL, Shanghai, China) was used for filtration, and then UPLC-MS/MS analysis was carried out.
UPLC conditions
The extract of the sample was analyzed by UPLC-ESI–MS/MS system of UPLC Nexera X2 (https://www.shimadzu.com.cn/) and the MS (Applied Biosystems 4500 Q TRAP, https://www.thermofisher.cn/cn/zh/home/brands/applied-biosystems.html). According to the He's method32. In the UPLC analysis, Agilent SB-C18 column (1.8 μm, 2.1 mm*100 mm) was used as the stationary phase, and the mobile phase included pure water containing 0.1% formic acid (solvent A) and acetonitrile containing 0.1% formic acid (solvent B). The sample was measured using a gradient program, use the gradient program to measure the sample, and the program is set up according to the description of Zhang et al.33, starting with a ratio of 95% A to 5% B. Within 9 min, adjust the scale to 5% An and 95% B through a linear gradient, and maintain the ratio for 1 min. Then, adjust the scale back to 95% An and 5% B within 1.1 min and maintain the ratio for 2.9 min. The flow rate is set to 0.35 mL/min, the temperature of the column oven is 40 °C, and the injection volume is 4 μL. The effluent is ionized and detected by connecting to an ESI-QTRAP-MS.
ESI-Q TRAP-MS/MS
LIT and triple quadrupole (QQQ) scans were performed on the AB4500Q TRAP UPLC/MS/MS system. The system is equipped with ESI Turbo ion spray interface, which can work in positive and negative ion mode and is controlled by Analyst 1.6.3 software (AB Sciex). The operation parameters of the ESI source are described by Chong et al.34. In QQQ and LIT modes, we used 10 and 100 Mol/L polypropylene glycol aqueous solution for instrument tuning and mass calibration, respectively, We monitored a specific set of MRM transitions based on the metabolites eluted during each period35.
Data processing and analysis
In this study, we used the metabolite database MWDB for qualitative determination of the substances in this study, and quantitatively analyzed the metabolites through the second-order spectral information and the MRM mode of triple quadrupole mass spectrometry.
PCA (principal component analysis) and HCA (hierarchical cluster analysis)
Use the statistical function prcomp in R (www.r-project.org) to carry out unsupervised PCA (principal component analysis). Before the unsupervised PCA, the data were measured by unit variance. The HCA (hierarchical cluster analysis) results of samples and metabolites are represented by the heat map of the tree map, while the Pearson correlation coefficient (PCC) between samples is represented by the cor function in R and presented in the form of heat map, R-packet premap was used in both HCA and PCC analysis34. For HCA, the normalized signal strength (unit variance scale) of metabolites is visualized as a chromatogram.
Differential metabolites selected
Analyze the metabolic group data according to the OPLS-DA model, draw the score chart of each group, further show the differences between each group, and analyze the metabolic group data according to the OPLS-DA model, draw the score chart of each group, and further show the difference between each group31. The screening of significantly regulated metabolites between groups was determined according to VIP ≥ 1 and absolute log2FC (folding change) ≥ 1. VIP values were extracted from OPLS-DA result, which also contain score plots and permutation plots, was generated using R package MetaboAnalystR. The data was log-transform (log2) and mean centering before OPLS-DA. In order to avoid overfitting, a permutation test (200 permutations) was performed36.
KEGG annotation and enrichment analysis
The identified metabolites were annotated by KEGG compound database (http://www.kegg.jp/kegg/compound/). The metabolites of these annotations are then mapped to the KEGG Path database (http://www.kegg.jp/kegg/pathway.html), Then, the pathway of significant up-regulation or down-regulation of metabolites was fed into the metabolite concentration analysis (MSEA), and its significance was determined by the p value of the hypergeometric test37.
Plant guide statement
Our experimental and field studies on plants (whether cultivated or wild), including the collection of plant materials, comply with the International Union for Conservation of Nature Policy statement on Endangered species Research and the Convention on Trade in Endangered species of Wild Fauna and Flora.
Results and analysis
Phenotypic observation of fruits and leaves of three Rosaceae plants
By examining mature fruits and complete leaves of red flesh apple, purple leaf plum, and purple leaf peach, it was observed that the fruit of red flesh apple and purple leaf plum had a purplish-red color, while the fruit of purple leaf peach was green. Interestingly, the leaves displayed different colors compared to the fruit. Specifically, the leaves of red flesh apple, purple leaf plum, and purple leaf peach were green, purple, and purple, respectively (Fig. 1A).

Content of flavonoids and anthocyanins and Phenotype in three Rosaceae plant materials. (A) Phenotype of AF, PEF, PLF in fruits and AL, PEL, PLL in leaves of three Rosaceae plants; (B) flavonoid contents; (C) anthocyanin contents; (D) tissue extract.
To further investigate this phenomenon, we determined the flavonoid and anthocyanin contents in six groups of plant materials. The results revealed that the flavonoid content in the fruit of purple leaf plum was significantly lower than those of the other five materials, whereas the fruit of purple leaf peach exhibited the highest flavonoid content. The flavonoid contents in the remaining four groups showed no significant differences (Fig. 1B).
Regarding anthocyanin content, red flesh apple fruit demonstrated significantly higher levels than the other groups. Following this, purple leaf plum leaf and purple leaf peach leaf displayed relatively high anthocyanin content, while the anthocyanin content in purple leaf peach fruit was the lowest (Fig. 1C).
Considering the phenotypic observations, a clear correlation emerged: the darker the plant material, the higher the anthocyanin content. Additionally, the light-colored fruits and leaves exhibited remarkably high flavonoid content, suggesting the possibility of metabolic differences between them (Fig. 1D).
Metabolic analysis of fruits and leaves of three Rosaceae species
The qualitative and quantitative analysis of metabolites and differential abundance metabolites (DAMs). components in six sample groups was performed using the widely targeted metabolic group of UPLC-MS/MS-based mass spectrometry. After quality evaluation, a total of 311 metabolites were detected, including 47 flavonoids, 105 flavonols, 16 chalcones, 37 dihydroflavonols, 8 dihydroflavonols, 30 anthocyanins, 14 flavonoid carbon glycosides, 23 flavanols, 8 isoflavones, 11 tannins, and 12 proanthocyanidins (Fig. 2A). HCA evaluation revealed differences in flavonoid metabolism among the six sample groups (Fig. 2B). Leaves exhibited higher enrichment levels (Species and relative content) of flavonoids than fruits, and the samples could be classified into six clusters based on the varying isoflavone enrichment levels. Cluster 1 showed the highest level of purple PEL, while cluster 2 had higher purple PLL accumulation. Cluster 3 showed the highest expression in purple PLF, followed by cluster 2. Cluster 4 had a significant accumulation of red AF, followed by cluster 6. Cluster 5 exhibited a notable accumulation of green PEF. Cluster 6 showed evident enrichment of green AL. This indicates different flavonoid accumulation patterns between the fruits and leaves of the three Rosaceae plants, with partial overlap of flavonoid metabolites within the same variety of plants.

Metabolites analysis of fruits and leaves of three species of Rosaceae. (A) Classification pie chart of flavonoids; (B) differential metabolites clustering heat map. Horizontal for the sample name, vertical for the metabolite information, Group for the grouping, Class for the substance classification, different colors for the relative content standardized values (red for high content, green for low content), the clustering line on the left side of the figure is the metabolite clustering line, and the clustering line at the top of the figure is the sample clustering line; (C) principal component analysis (PCA); (D) correlation analysis diagram of differential metabolites. longitudinally and diagonally represent the sample names of different samples, different colors represent different Pearson correlation coefficients, the redder the color is, the stronger the positive correlation is, the whiter the color is, the worse the correlation is. The bluer the color is, the stronger the negative correlation is, and the size of the circle is proportional to the degree of correlation. At the same time, the correlation coefficient between the two samples is marked in the box.
PCA analysis (Fig. 2C) revealed distinct separation among the six sample groups, with closely gathered repeated samples. Three different regions could be distinguished, indicating variations in flavonoid metabolites in each region. The first group comprised purple PEL, green PEF, red PLF, and red AF, indicating similar flavonoid characteristics. The second group included purple PLL, and the third group included green AL. Therefore, although the results showed that the flavonoids in the fruits of the three Rosaceae plants were similar, they greatly differed in the leaves. The correlation heat map (Fig. 2D) also demonstrated good biological repetition among the six sample groups.
To further explore these differences, a preliminary analysis of the metabolites was conducted. The results showed modifications of quercetin, cypermethrin, kaempferol, luteolin, taraxanthin, hesperidin, apigenin, Tamariaxanthin, hesperidin, halcyrhamneol, and isorhamnetin through various glycosidic bonds in fruits and leaves of different colors. Glycosylation occurred at positions 8, 6, 3, 5, and 7, including neo-hesperidin, glucoside, isorhamnose, galactose, rutin, and glucuronide glycosylation. Eight flavonoids, namely Delphinidin-3-O-(6″-O-p-coumaroyl) glucoside, Peonidin-3-O-glucoside, Catechin, Naringenin-7-O-glucoside (prunin), Epicatechin, Quercetin-3-O-galactoside (Hyperin), Quercetin-3-O-rutinoside (Rutin) and Quercetin-7-O-Rutinoside, were co-enriched and exhibited high relative abundance in the six sample groups (Fig. 3A–H).
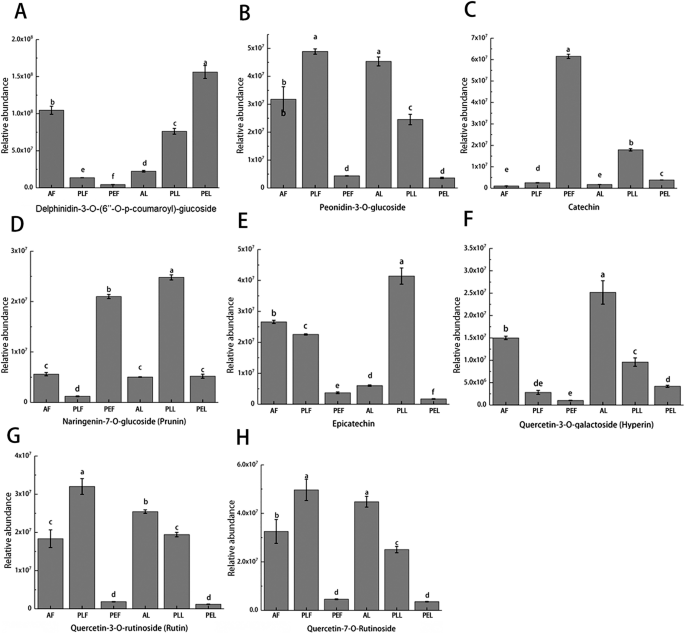
Relative abundance of anthocyanins and other flavonoids in the six groups of samples (A–H).
Screening of DAMs in the fruits and leaves of three Rosaceae species
DAMs were screened using the criteria of VIP ≥ 1 and log2FC (folding change) ≥ 1. A total of 183 DAMs (71 accumulated and 112 reduced) were identified between red AF and green PEF (Fig. 4A). Among them, 15 flavonoids and 15 dihydroflavonoids were accumulated, while 51 flavonols showed significant down-regulation. Between red AF and red PLF (Fig. 4B), there were 197 DAMs (91 accumulated and 106 reduced), with 29 flavonols accumulated and 38 reduced. To comparw green PEF and red PLF, 189 DAMs (107 accumulated and 82 reduced) were found (Fig. 4C). Among them, 43 flavonols were significantly accumulated, while 21 dihydroflavonols and 18 flavonols were significantly reduced. Additionally, between green AL and purple PEL (Fig. 4D), 227 DAMs (77 accumulated and 150 reduced) were identified. Among them, 20 dihydroflavonoids and 16 flavonols were significantly accumulated, while 67 flavonols showed significant down-regulation. Between green AL and purple PLL, there were 255 significantly accumulated and reduced DAMs (Fig. 4E). Specifically, 41 flavonols, 23 flavonoids, and 19 anthocyanins were significantly accumulated, while 45 flavonols were significantly reduced. To compare purple PEL and purple PLL (Fig. 4F), 236 DAMs (182 accumulated and 54 reduced) were observed. Among them, 75 flavonols and 19 anthocyanins were significantly accumulated, while 19 dihydroflavonoids showed significant down-regulation. In general, most differential metabolites in the six sample groups were flavonols, flavonoids, dihydroflavonoids, and anthocyanins. These compounds displayed a certain complementary trend within each sample. Compared to green PEF and AL, dark fruits and leaves exhibited lower levels of most flavonoids (flavonols, flavonoids, and dihydroflavonoids), while the contents of certain anthocyanins were higher.

Volcanic diagram of DAMs in fruits and leaves of three Rosaceae plants (A–F). Each point in the volcanic map represents a metabolite, in which the green dot represents the down-regulated differential metabolite, the red dot represents the up-regulated differential metabolite, and the gray represents the metabolite detected but not significantly different; the Abscissa represents the logarithm of the multiple of the relative content difference between the two groups of samples (log2FC), the ordinate represents the VIP value, and the screening criterion is VIP ≥ 1 and absolute log2FC (fold change) ≥ 1.
Changes of relative anthocyanin abundance in fruits and leaves of three different Rosaceae plants
The formation of plant color is influenced by the content and type of anthocyanins. To deepen our understanding, We made an in-depth analysis of the anthocyanin compounds with significant changes in six groups of samples (Table 1). A comparison between red AF and green PEF revealed that the fold change (FC) of 5 different anthocyanins ranged from − 22.57 to 20.97 (3 accumulated and 2 reduced). The three most accumulated anthocyanins were Cyanidin-3-O-Rutinoside (Keracyanin) (20.97-fold), Cyanidin-3-O-(2″-O-glucosyl) glucoside (14.64-fold), and Peonidin-3-O-(6″-O-p-coumaroyl) glucoside (14.56-fold), The most reduced anthocyanin was Peonidin-3-O-arabinoside (− 22.57-fold). Between red AF and purple PLF, 4 different anthocyanins were identified. The three most accumulated glucosides had fold changes of 24.48, 18.01, and 16.10, respectively. The most significant downregulation was observed in Cyanidin-3,5-O-diglucoside (Cyanin) (17.77-fold). Three different anthocyanins were detected between purple PLF and green PEF. Among the top 10 accumulated DAMs, two anthocyanins, Cyanidin-3-O-(2″-O-xylosyl) rutinoside (18.01-fold) and Delphinidin-3-O-(2‴-O-p-coumaroyl) rutinoside (16.04-fold), showed high enrichment. Petunidin-3-O-arabinoside (16.73-fold) was significantly reduced.
Between green AL and purple PEL, the top three accumulated anthocyanins were Peonidin-3-O-(6″-O-p-coumaroyl) glucoside (22.77-fold), Cyanidin-3-O-Rutinoside (Keracyanin) (22.75-fold), and Cyanidin-3-O-(6″-O-caffeoyl) glucoside (21.64-fold), while no significantly reduced anthocyanins were found.
For green AL and purple PLL, the two most accumulated anthocyanins were Cyanidin-3-O-Rutinoside (Keracyanin) (23.8-fold) and Cyanidin-3-O-(2″-O-xylosyl) rutinoside (19.63-fold). Between purple PEL and purple PLL, 3 differential anthocyanins were detected. The two most enriched anthocyanins were Cyanidin-3,5-O-diglucoside (Cyanin) (20.60-fold) and Cyanidin-3-O-(2″-O-xylosyl) rutinoside (19.63-fold), while “Cyanidin-3-O-(6″-O-feruloyl) sophoroside-5-O-Glucoside” was significantly decreased (− 15.93-fold). Among the three comparative combinations, AFvs.AL, PLFvs.PLL, and PEFvs.PEL only the PLFvs.PLL, and PEFvs.PEL comparison showed significant upregulation in three anthocyanins, namely Cyanidin-3,5-O-diglucoside (Cyanin) (20.6-fold), Cyanidin-3-O-(6″-O-feruloyl) sophoroside-5-O-Glucoside (15.93-fold) and Peonidin-3-O-arabinoside (15.08-fold). Morning Petunidin-3-O-arabinoside (− 16.73-fold) was significantly reduced. These results demonstrate significant differences in anthocyanin content between fruits and leaves of different Rosaceae varieties. Moreover, even slight variations in anthocyanins within the same variety can result in noticeable differences in color.
Figure 5 illustrates the relative content of representative anthocyanins in each sample. The main representative anthocyanins include Cyanidin-3,5-O-diglucoside (Cyanin), Cyanidin-3-O-(2″-O-glucosyl) glucoside, Cyanidin-3-O-(2″-O-xylosyl) rutinoside, Cyanidin-3-O-(6″-O-caffeoyl) glucoside, Cyanidin-3-O-Rutinoside (Keracyanin), Delphinidin-3-O-(2‴-O-p-coumaroyl) rutinoside, Peonidin-3-O-(6″-O-p-coumaroyl) glucoside, Peonidin-3-O-arabinoside and Petunidin-3-O-arabinoside. These anthocyanins exhibit varying levels in the six groups of samples. The compound “Cyanidin-3-O-(6″-O-feruloyl) sophoroside-5-O-Glucoside”showed significant enrichment only in PEL, and the highest abundance of Peonidin-3-O-arabinoside, Petunidin-3-O-arabinoside, Cyanidin-3-O-(6″-O-caffeoyl) glucoside, and Cyanidin-3,5-O-diglucoside (Cyanin) was also observed in PEL.

Relative abundance of ten anthocyanins detected in all samples.
Furthermore, Delphinidin-3-O-(2‴-O-p-coumaroyl) rutinoside exhibited significant enrichment in AL. PLL had the highest contents of Peonidin-3-O-(6″-O-p-coumaroyl) glucoside, Peonidin-3-O-arabinoside, Cyanidin-3-O-(2″-O-xylosyl) rutinoside, Cyanidin-3-O-(2″-O-glucosyl) glucoside and Cyanidin-3-O-Rutinoside (Keracyanin). Peonidin-3-O-arabinoside and Cyanidin-3,5-O-diglucoside (Cyanin) had higher levels in AF and PLF, respectively. PLL, PEL, and AF exhibited the highest abundance of Peonidin-3-O-arabinoside.
Key differential metabolites in leaves and fruits of different colors
In order to determine the relationship between different metabolites and six groups of plant materials, we conducted the k-means analysis and found that they can be divided into 10 clusters (Fig. 6A). Cluster 1 contained 92 metabolites, cluster 2 had 10 metabolites, cluster 3 had 18 metabolites, cluster 4 had 43 metabolites, cluster 5 had 13 metabolites, cluster 6 had 19 metabolites, cluster 7 had 11 metabolites, cluster 8 had 21 metabolites, cluster 9 had 60 metabolites, and cluster 10 had 22 metabolites The metabolites in PLL had the highest peak in clusters 1, 2, 6, 7, and 8, while PEL had a higher representation in clusters 2 and 4. AF had the highest representation in clusters 5, 6, and 7, and AL was highly enriched in clusters 3, 7, 8, and 9.

k-means analysis (A), Venn diagram (B,C) and KEGG analysis (D) of DAMs in six groups of samples. (A) Abscissa represents the name of the sample, ordinate represents the standardized relative content of metabolites, Sub Class represents the class number of metabolites with the same trend, and total represents the number of metabolites in this category. (B) In the figure, each circle represents a comparison group, the number of circle and circle overlap represents the number of differential metabolites shared between the comparison groups, and the number without overlap represents the number of unique differential metabolites of the comparison group. (D) Abscissa represents the corresponding Rich Factor of each path, ordinate is the name of the path, and the color of the point reflects the size of p value, and the redder it is, the more significant the enrichment. The size of the point represents the number of differential metabolites enriched.
A total of 245 differential substances were found in the three comparison groups of AFvs.PEF, AFvs.PLF, and PEFvs.PLF, with 91 overlapping substances (Fig. 6B). These differential substances consisted mainly of 81 flavonols, 32 flavonoids, 30 dihydroflavonoids, and 23 anthocyanins. In the comparison groups of AL vs PEL, AL vs PLL, and PEL vs PLL (Fig. 6C), there were 134 differentials. A total of 221 substances were identified. Among these, 105 were flavonols, 45 were flavonoids, 36 were dihydroflavonoids, and 29 were anthocyanins.
Analysis of the KEGG pathway annotation and enrichment revealed that the differential metabolites were involved in various pathways, including flavonoid biosynthesis, metabolic pathway, secondary metabolite biosynthesis, isoflavone biosynthesis, flavonoid and flavonol biosynthesis, and anthocyanin biosynthesis pathway (Fig. 6D).
Discussion
Red-flesh apples, purple leaf plums, and purple leaf peaches are three types of ornamental fruit trees widely utilized in various green spaces due to their vibrant fruit and leaf colors38. Additionally, their roots and leaves possess medicinal properties with specific pharmacological activities. Combining both ornamental and medicinal value into one gives these trees broad application potential39,40. Colored plant tissues are rich in flavonoids and anthocyanins, which offer various physiological benefits to plants41. Studies have shown that flavonoids can enhance antioxidant capabilities and free radical scavenging in animals, thereby playing a crucial role in improving human health42,43.
Flavonoids are a kind of natural compounds which exist widely in plants and have a variety of biological activities and pharmacological effects44,45. A large number of studies have confirmed the importance of flavonoids in plants. For example, flavonoids can help plants resist adverse environmental conditions. Some studies have shown that flavonoids can enhance the antioxidant capacity of plants and reduce the damage caused by harmful substances such as ultraviolet rays and free radicals46. In addition, it has been reported that flavonoids can also improve the disease resistance of plants47. Other studies have shown that flavonoids have significant effects on plant growth and development, and can promote plant growth and development of plants, especially in the development of underground organs48. And because some flavonoids have a variety of biological activities, such as antioxidant, anti-inflammatory and cholesterol-lowering effects49,50, it has also been widely reported that they are suitable for use as natural medicines or health products.
Anthocyanin is a water-soluble natural pigment and a subtype of bioflavonoids that determines the color of most flowers, fruits, and seeds51,52,53. Different combinations of flavonoids not only generate distinct colors but also produce varying levels of antioxidant capacity54,55. Hence, determining flavonoid metabolic groups is essential for accurately understanding the content and types of flavonoids in each fruit and leaf. Flavonoid metabonomics studies demonstrated that the primary metabolites in all samples were flavonols, flavonoids, dihydrochalcone, and anthocyanins, with each group of samples emphasizing different flavonoid expressions and accumulation patterns. The fact that flavonols are highly concentrated in all samples confirms their shared chromogenic effect with anthocyanins.
Prior studies have indicated that the color change from purple to blue is related to the co-pigment system formed by anthocyanins and other flavonoids56,57. The color of anthocyanins in red plant tissues is primarily influenced by the degree of molecular modification, including glycosylation, methylation, and acylation58,59, which aligns with our findings. Moreover, the type and quantity of anthocyanins often vary across different colors and plant tissues. For instance, delphinidin (Dp) and anthocyanins (Cy) determine the blue and red colors of senecio cruentus, while pink flowers contain derivatives of anthocyanins (Cy) and geranitin (Pg). Purple flowers contain derivatives of Delphinidin and Cyanidin60. Additionally, pelargonin glycoside serves as the primary pigment source in strawberries61, and the synthesis and accumulation of piperidin and its derivatives play a pivotal role in the blue-purple pigmentation of most petals. By comparing the differential metabolites in fruits and leaves, it was observed that dark fruits and leaves exhibited higher levels of anthocyanins, while light-colored fruits and leaves contained higher levels of total flavonoids.
The abundance of Peonidin-3-O-glucoside was highest in all plant samples, with significant differences among groups. This suggests that Peonidin-3-O-glucoside may be a key factor influencing the color variation among the six groups of samples. Cyanidin-3-O-(6″-O-feruloyl)sophoroside-5-O-Glucoside, Petunidin-3-O-arabinoside, Cyanidin-3,5-O-diglucoside (Cyanin), and Cyanidin-3-O-(6″-O-caffeoyl)glucoside were significantly enriched only in PEL but were very low in PEF. Therefore, these substances are the primary reasons for the purple color of PEL. Surprisingly, AF exhibited a high concentration of anthocyanins, suggesting that the high glycosylation level of anthocyanins primarily influenced the color of red meat apples. Green coloration is associated with high flavonoid and low anthocyanin contents, as evident from the total flavonoids and anthocyanin levels in AL and PEF. Additionally, dark plant tissues are influenced not only by molecular modifications of anthocyanins but also by co-pigmentation. The composition and content of upstream flavonoid metabolites, such as catechins, kaempferol, quercetin, naringin, and isorhamnetin and their glycosides, are also related to color formation in dark tissues62,63. We found that purple PLF, PLL and PEL have higher levels of anthocyanins and more abundant anthocyanin glycosylated derivatives, and these three plants also show high levels of flavonoids, indicating that purple is mainly formed by the interaction of different types of anthocyanins with other secondary metabolites.
Conclusion
The metabolites involved in fruit and leaf color variation are associated with various metabolic pathways, including tricarboxylic acid cycle intermediates. Anthocyanins undergo various glycosylation modifications mediated by flavonoid glycosyltransferases. This study revealed distinct color mechanisms between succulent fruits and leaves of three Rosaceae plants. Specifically, red plant tissues are primarily influenced by high levels of molecular modifications in anthocyanins, while purple plant tissues are mainly influenced by the hyperchromic effect of a few anthocyanins and various secondary metabolites.
Data availability
The original contributions presented in the study are publicly available.
References
Li, M. Z., Xiao, Y. W., Mount, S. & Liu, Z. C. An Atlas of genomic resources for studying Rosaceae fruits and ornamentals. Front. Plant Sci. 12, 25 (2021).
D’Agostino, M. F., Sicari, V., Giuffrè, A. M. & Soria, A. C. Blackberries (Rubus ulmifolius Schott) from Calabria (Italy): A comprehensive characterisation. Eur. Food Res. Technol. 248, 905–916 (2022).
Telichowska, A. et al. Polyphenol content and antioxidant activities of Prunus padus L. and Prunus serotina L. leaves: Electrochemical and spectrophotometric approach and their antimicrobial properties. Open Chem. 18(1), 1125–1135 (2020).
Ebada, D. et al. Characterization of Delonix regia flowers’ pigment and polysaccharides: Evaluating their antibacterial, anticancer, and antioxidant activities and their application as a natural colorant and sweetener in beverages. Molecules. 28, 3243 (2023).
Liu, Z. C., Ma, H., Jung, S., Main, D. & Guo, L. Developmental mechanisms of fleshy fruit diversity in Rosaceae. Annu. Rev. Plant Biol. 71, 547–573 (2020).
Metsämuuronen, S. & Sirén, H. Bioactive phenolic compounds, metabolism and properties: A review on valuable chemical compounds in Scots pine and Norway spruce. Phytochem. Rev. 18, 623–664 (2019).
Jiang, H., Jiang, X. M. & Qin, Y. Comparison of metabolome and transcriptome of flavonoid biosynthesis in two colors of Coreopsis tinctoria nutt. Front. Plant Sci. 13, 810422 (2022).
Li, P., Zhang, F. J. & Hou, B. K. The Arabidopsis UDP-glycosyltransferases UGT79B2 and UGT79B3, contribute to cold, salt and drought stress tolerance via modulating anthocyanin accumulation. Plant J. Cell Mol. Biol. 89(1), 85–103 (2017).
Xu, W. et al. Transparent testa 16 and 15 act through different mechanisms to control proanthocyanidin accumulation in Arabidopsis testa. J. Exp. Bot. 11, 2859–2870 (2017).
Durazzo, A. et al. Polyphenols: A concise overview on the chemistry, occurrence, and human health. Phytother. Res. 33, 2221–2243 (2019).
Jang, Y. K., Jung, E., Lee, H. A., Choi, D. & Lee, C. H. Metabolomic characterization of hot pepper (Capsicum annuum ’cm334’) during fruit development. J. Agric. Food Chem. 20, 151014095006000 (2015).
Yang, Y. et al. Phenolic composition and antioxidant activities of 11 celery cultivars. J. Food Sci. 75(1), C9-13 (2010).
Franch, C. P. & Belles, V. V. Citrus as functional foods. Curr. Top. Nutrac. Res. 8(4), 173–184 (2010).
Zaheer, K. & Akhtar, M. H. An updated review of dietary isoflavones: Nutrition, processing, bioavailability and impacts on human health. Crit. Rev. Food Sci. Nutr. 57(6), 00–00 (2015).
Skrovankova, S., Sochor, J. & Mlcek, J. Quercetin and its anti-allergic immune response. Molecules. 21(5), 21050623 (2016).
Yu, X. et al. Metabolite Signatures of Diverse Camellia sinensis Tea Populations (Springer, 2020).
Yan, H. L. et al. MYB-mediated regulation of anthocyanin biosynthesis. Int. J. Mol. Sci. 6, 3103–3103 (2021).
Brozdowski, J. et al. Composition of phenolic compounds, cyanogenic glycosides, organic acids and sugars in fruits of black cherry (Prunus serotina Ehrh). Forests 12, 762 (2021).
Hegde, A. S., Gupta, S., Sharma, S., Srivatsan, V. & Kumari, P. Edible rose flowers: A doorway to gastronomic and nutraceutical research. Food Res. Int. 162, 111977 (2022).
Sun, L. et al. Trehalose targets nrf2 signal to alleviate d-galactose induced aging and improve behavioral ability. Biochem. Biophys. Res. Commun. 521(1), 113–119 (2020).
Pang, Q. L. & Lai, Z. H. Development prospect and high-yield cultivation techniques of purple potato. Shaanxi Agric. Sci. 56(1), 275–276 (2010).
Lansky, E. P. & Newman, R. A. Punica granatum (pomegranate) and its potential for prevention and treatment of inflammation and cancer. J. Ethnopharmacol. 109(2), 177–206 (2007).
Pehlivan, F. E. Antioxidant and phenolic profile of mahaleb plant as a functional food. Agric. Sci. Technol. B 11(1), 6 (2021).
Chao, G. et al. Constitutive activation of an anthocyanin regulatory gene pcmyb10.6 is related to red coloration in purple-foliage plum. PLoS One. 10(8), 0135159 (2015).
Zhang, X., Xu, J. & Xu, Z. Analysis of antioxidant activity and flavonoids metabolites in peel and flesh of red-fleshed apple varieties. Molecules. 25(8), 1968 (2020).
Wang, Q. J., Li, X. L., Wang, L., Chen, X. S. & Shen, X. Leaf photosynthetic characteristics of red-leaf tree species of peach and plum. Forest. Sci. 43(6), 6 (2007).
Medda, S., Fadda, A., Dessena, L. & Mulas, M. Quantification of total phenols, tannins, anthocyanins content in Myrtus communis L. and antioxidant ActiviPEL evaluation in function of plant development stages and altitude of origin site. Agronomy. 11, 1059. https://doi.org/10.3390/agronomy11061059 (2021).
Yang, L. et al. Foliar spray with rutin improves cadmium remediation efficiency excellently by enhancing antioxidation and paltochelatin detoxification of Amaranthus alpochondriacus. Int. J. Paltoremed. 10, 11–11 (2021).
Lee, J., Durst, R. W. & Wrolstad, R. E. Determination of total monomeric anthocyanin pigment content of fruit juices, beverages, natural colorants, and wines by the pH differential method: Collaborative study. J. AOAC Int. 88, 1269–1278 (2005).
Chen, C., Xia, X. & Wang, D. Identification of nutritional components in unripe and ripe Docynia delavayi (Franch) Schneid fruit by widely targeted metabolomics. PeerJ. 10, e14441. https://doi.org/10.7717/peerj.14441 (2022).
Yu, H. et al. Widely targeted metabolomics profiling reveals the effect of powdery mildew on wine grape varieties with different levels of tolerance to the disease. Foods. 11, 2461. https://doi.org/10.3390/foods11162461 (2022).
He, W. et al. Rice FERONIA-LIKE RECEPTOR 3 and 14 affect grain quality by regulating redox homeostasis during endosperm development. J. Exp. Bot. 74(10), 3003–3018. https://doi.org/10.1093/jxb/erad077 (2023).
Zhang, C. et al. Analysis of the flavonoidome reveals the different health-promoting flavonoid characteristics in fruit. Antioxidants. 12, 1665. https://doi.org/10.3390/antiox12091665 (2023).
Li, H. et al. Comparative metabolomics study of Tartary (Fagopyrum tataricum (L) Gaertn) and common (Fagopyrum esculentum Moench) buckwheat seeds. Food Chem. 371, 131125 (2022).
Dalia, M. K., Valdas, J. & Arunas, S. J. B. Flavonoids as anticancer agents. Nutrient. 12(2), 457–457 (2020).
Chong, J. & Xia, J. Metabo-Analyst R: An R package for flexible and reproducible analysis of metabolomics data. Bioinformatics 34, 4313–4314 (2018).
Zhao, Y. et al. Metabolite analysis in Nymphaea ‘Blue Bird’ petals reveal the roles of flavonoids in color formation, stress amelioration, and bee orientation. Plant Sci. 312, 111025–111025 (2021).
Xu, X. Analysis of plant landscape configuration and species collocation in ecological garden. Mol. Plant Breed. 21(12), 4170–4176 (2023).
Yushan, R. E., Liu, L. C. & Li, W. S. Classification, biological characteristics and application value of red flesh apple, an ancient cultivated fruit tree in Xinjiang. Pract. Technol. Forest. 6, 63–64 (2011).
Zhang, Y. G., Zhang, W., Du, M. E. & Zhang, L. Y. Application and development prospect of ornamental fruit trees in northern gardens. Chin. Fruit Trees 11, 106–108 (2022).
Chen, X., Xie, J., Yue, Q. Z., Yang, X. L. & Wang, L. G. Research progress on molecular mechanism of leaf coloration in colored-leaf plants. Acta Bot. Sin. 40(02), 358–364 (2020).
Maleki, S. J., Crespo, J. F. & Cabanillas, B. Anti-inflammatory effects of flavonoids. Food Chem. 299, 125124 (2019).
Chen, L., Cao, H., Huang, Q., Xiao, J. B. & Teng, H. Absorption, metabolism and bioavailability of flavonoids: A review. Crit. Rev. Food Sci. Nutr. 62(28), 11–13 (2021).
Batra, P. & Sharma, A. K. Anti-cancer potential of flavonoids: Recent trends and future perspectives. 3 Biotech. 3(6), 439–459 (2013).
Ullah, A. et al. flavonoids and their role as a therapeutic agent. Molecules. 25(22), 5243 (2020).
Bai, Y. et al. Flavonoids metabolism and physiological response to ultraviolet treatments in Tetrastigma hemsleyanum Diels et Gilg#13. Front. Plant Sci. 20, 13926197–14926197 (2022).
Upinder, S. et al. Metabolic flux towards the (iso)flavonoid pathway in lignin modified alfalfa lines induces resistance against Fusarium oxysporum f. sp. medicaginis. Plant Cell Environ. https://doi.org/10.1111/pce.13093 (2017).
Xu, Y. et al. Rna-seq transcriptome analysis of rice primary roots reveals the role of flavonoids in regulating the rice primary root growth. Genes. 10, 3 (2019).
Suleria, H. A. R., Barrow, C. J. & Dunshea, F. R. Screening and characterization of phenolic compounds and their antioxidant capacity in different fruit peels. Foods. 9, 1206 (2020).
George, V. C., Dellaire, G. & Rupasinghe, H. P. V. Plant flavonoids in cancer chemoprevention: Role in genome stability. J. Nutr. Biochem. 45, 1–14 (2017).
Niu, S. S. et al. Coordinated regulation of anthocyanin biosynthesis in Chinese bayberry (Myrica rubra) fruit by a R2R3 MYB transcription factor. Planta. 231, 887–899 (2010).
Fang, J. Bioavailability of anthocyanins. Drug Metab. Rev. 46(4), 508–520 (2014).
Khoo, H. E., Azlan, A., Tang, S. T. & Lim, S. M. Anthocyanidins and anthocyanins: Colored pigments as food, pharmaceutical ingredients, and the potential health benefits. Food Nutr. Res. 61, 1–21 (2017).
Ohno, S. et al. Petal color is associated with leaf flavonoid accumulation in a Labile bicolor flowering dahlia (Dahlia variabilis) “Yuino”. Hortic. J. 85(2), 177–186 (2016).
Zou, J. J., Zeng, X. L. & Chen, H. G. Analysis of flower color components of different sweet-scented osmanthus varieties during flowering and senescence. J. Southern Agric. 48(9), 1683–1690 (2017).
Nobuhiro, S. & Toru, N. Achievements and perspectives in biochemistry concerning anthocyanin modification for blue flower coloration. Plant Cell Physiol. 56(1), 28–40 (2015).
Shi, J. et al. Insight into the pigmented anthocyanins and the major potential co-pigmented flavonoids in purple-coloured leaf teas. Food Chem. 3, 63 (2021).
Xu, Z. S., Yang, Q. Q., Feng, K. & Xiong, A. S. Changing carrot color: Insertions in dcmyb7 alter the regulation of anthocyanin biosynthesis and modification 1. Plant Physiol. 181, 195–207 (2019).
Cheng, J. et al. Unraveling the mechanism underlying the glycosylation and methylation of anthocyanins in peach. Plant Physiol. 166(2), 1044–1058 (2014).
Wei, S., Chong-Hui, L. I., Liang-Sheng, W., Si-Lan, D. & Yan-Jun, A. X. Anthocuanins present in flowers of senecio cruentus with different colors. Acta Hortic. Sin. 36(12), 1775–1782 (2009).
da Silva, F. L., Escribano, B. M. T., Perez, A. J. J., Rivas, G. J. C. & Santos, B. C. Anthocyanin pigments in strawberry. LWT Food Sci. Technol. 40(2), 374–382 (2007).
Gong, Z. X. et al. Molecular biological mechanism of exogenous aluminum sulfate regulating the composition and content of anthocyanin in Baxian. J. Plant Nutr. Fertil. 23(3), 821–826 (2017).
Mizuno, T., Sugahara, K., Tsutsumi, C., Iino, M. & Iwashina, T. Identification of anthocyanin and other flavonoids from the green–blue petals of puya alpestris (bromeliaceae) and a clarification of their coloration mechanism. Phytochemistry. 181, 112581 (2021).
Funding
This research was funded by a project supported by National Natural Science Foundation of China, Grant number 32072520; the Fruit innovation team project of Shandong Province (CN), Grant number SDAIT-06-07; and the Natural Science Foundation of Shandong Province (CN), Grant number ZR2020MC132.
Author information
Authors and Affiliations
Contributions
C.Y., Y.F.M., and X.S. planned and designed the research. Y. F.M., N.S., X.Q., Y.B.L., M.Y.S., and Y.W.Z., performed the experiments, conducted fieldwork, and analyzed data. C.Y., Y.L.H., X.S.C., Z.Q.M., Y.F.M., and X.S. wrote the manuscript. All the authors read and approved the final manuscript.
Corresponding authors
Ethics declarations
Competing interests
The authors declare no competing interests.
Additional information
Publisher's note
Springer Nature remains neutral with regard to jurisdictional claims in published maps and institutional affiliations.
Supplementary Information
Rights and permissions
Open Access This article is licensed under a Creative Commons Attribution 4.0 International License, which permits use, sharing, adaptation, distribution and reproduction in any medium or format, as long as you give appropriate credit to the original author(s) and the source, provide a link to the Creative Commons licence, and indicate if changes were made. The images or other third party material in this article are included in the article's Creative Commons licence, unless indicated otherwise in a credit line to the material. If material is not included in the article's Creative Commons licence and your intended use is not permitted by statutory regulation or exceeds the permitted use, you will need to obtain permission directly from the copyright holder. To view a copy of this licence, visit http://creativecommons.org/licenses/by/4.0/.
About this article

Cite this article
Yang, C., Sun, N., Qin, X. et al. Analysis of flavonoid metabolism of compounds in succulent fruits and leaves of three different colors of Rosaceae. Sci Rep 14, 4933 (2024). https://doi.org/10.1038/s41598-024-55541-4
Received:
Accepted:
Published:
DOI: https://doi.org/10.1038/s41598-024-55541-4
Keywords
Comments
By submitting a comment you agree to abide by our Terms and Community Guidelines. If you find something abusive or that does not comply with our terms or guidelines please flag it as inappropriate.
