Profile
The positions in the table below reflect the BGI's position overall, domestically, within their sector, and in various subject areas based on their Share. Each position links to the corresponding table where BGI is listed.
Position by research output Share
Position by research output Share in subject areas
Research
Overall research output
| Count | Share | |
|---|---|---|
| Overall | 64 | 12.76 |
Overall Count and Share for 'BGI' based on the 12-month time frame mentioned above.
Research outputs by subject area
Note: Articles may be assigned to more than one subject area. Hover over the donut graph to view the Share for each subject.
Share output for the past 5 years
Compare with other institutions
Nature Strategy Reports
Identify research insights to guide research strategy and grow your impact with our Nature Strategy reports.
-
Actionable insights into research performance.
-
Detailed analysis of strengths and weaknesses.
-
Covers all major disciplines and regions of the world.
Nature Navigator
Data-driven insights for informed research strategy decisions with AI summarisation technology.
-
Track trends, summarise articles effortlessly.
-
Spark serendipitous discoveries.
-
Uncover collaboration opportunities.
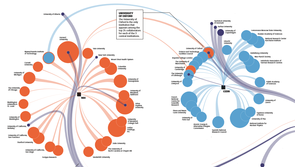
Collaboration
International vs domestic collaboration by Share
| Type | Percentage |
|---|---|
| International (215 institutions) | 28.8% |
| Domestic (178 institutions) | 71.2% |
Note: Hover over the graph to view the percentage of collaboration.
Top 5 domestic collaborators with BGI by Share
Collaborating institutions
Share
Top 5 international collaborators with BGI by Share
Collaborating institutions
Share
Latest supplement

Relationships
Affiliated joint institutions and consortia
- Beijing Protein Innovation (BPI)
- CUHK-BGI Innovation Institute of Trans-Omics
- Drosophila 12 Genomes Consortium
- Genome of the Netherlands Consortium (GoNL)
- HKU-BGI Bioinformatics Algorithms and Core Technology Research Laboratory
- ICGC Prostate Cancer Project: Adenocarcinoma
- Innovation Center for Cardiovascular Disorders
- International HapMap Project
- JFL-BGI STOmics Center
- James D. Watson Institute of Genome Sciences (WIGS)
- Northeast Forestry University-BGI Life Science Joint Research Center
- Sino-Danish Breast Cancer Research Centre
- South Asian Type 2 Diabetes (SAT2D) Consortium
- The Potato Genome Sequencing Consortium (PGSC)
- UCAS-BGI Education Center