
Abstract
Integration renewable energy sources into current power generation systems necessitates accurate forecasting to optimize and preserve supply–demand restrictions in the electrical grids. Due to the highly random nature of environmental conditions, accurate prediction of PV power has limitations, particularly on long and short periods. Thus, this research provides a new hybrid model for forecasting short PV power based on the fusing of multi-frequency information of different decomposition techniques that will allow a forecaster to provide reliable forecasts. We evaluate and provide insights into the performance of five multi-scale decomposition algorithms combined with a deep convolution neural network (CNN). Additionally, we compare the suggested combination approach's performance to that of existing forecast models. An exhaustive assessment is carried out using three grid-connected PV power plants in Algeria with a total installed capacity of 73.1 MW. The developed fusing strategy displayed an outstanding forecasting performance. The comparative analysis of the proposed combination method with the stand-alone forecast model and other hybridization techniques proves its superiority in terms of forecasting precision, with an RMSE varying in the range of [0.454–1.54] for the three studied PV stations.
Introduction
Solar photovoltaic (PV) energy has recently emerged as a viable alternative to conventional forms of electrical power production, such as fossil fuels1 power production. There has been a significant increase in the amount of PV capacity that has been installed throughout the world because solar energy is clean, economical, renewable, and beneficial to the environment. Therefore, photovoltaic (PV) systems provide an efficient alternative to supply distant locations by power, pumping water, and according to grid-connected PV plants, reducing electricity expenses.
PV power production is very sensitive to variations in solar irradiation as well as other factors of the local environment, in contrast to the traditional sources, where electrical power production can be simply managed. As a result, the integration of PV electricity into the electrical grid is a major challenge. Renewable power producers, like other energy producers, should respect the expected electrical power for the market session2. Precise PV power assessment is vital for (1) integrating PV power into the grid, (2) selling PV power in the electricity markets, and (3) planning PV plant maintenance.
The most current research on PV power forecasting includes a large number of different forecasting approaches, the choice of which is dependent on the adopted time horizon of the forecast, the utilized inputs, and the forecasting strategy that is chosen. The PV power forecasting techniques may be classified into3: (1) physical methods, relying on satellite/sky imagery or numerical weather prediction (NWP) that need post-processing to transform their output to PV power, and (2) data-driven approaches that relate the output of the PV plant to external factors4. In the first category, the modeling process necessitates the collection of a substantial amount of data and the execution of several complicated analyses to estimate the parameters of the physical model, which restricts its applicability to the real world. On the other hand, data-driven approaches are extensively utilized in PV generation forecasts due to the fast growth of data mining, machine learning, and deep learning methods in recent years.
In a mathematical sense, the data-driven forecasting category may be classified into three sub-class: linear, non-linear, and hybrid models. The linear models are the simplest kind of these classes, and the most well-known linear forecasting models include the auto-regression (AR), auto-regressive integrated moving average (ARIMA)5, and auto-regressive moving average extrapolation (ARMAX)6. For one-step forecasting tasks, previous research has revealed that linear forecasting models may usually provide reliable outcomes. Despite this, it is apparent that the PV generation series is not linear. Thus, the majority of academics are concentrating their efforts on the creation of non-linear forecasting models such as artificial neural networks (ANN). Artificial Neural Networks (ANNs) have been shown in prior studies to be an effective tool for accurate predicting. It has been shown that employing ANNs to simulate linear trends may provide mixed results and it is not advised to use ANNs naively in any form of data7. Extreme learning machines, fuzzy systems, k-nearest neighbor, support vector machines, and their hybridization have dominated current PV forecasting literature. The behavior of a single model does not result in a more precise forecast of the amount of power produced by PV in a variety of scenarios. One possible explanation for this issue is that the stand-alone approach has certain shortcomings. In such situations, the ideal solution is a hybrid model, which combines two or more methodologies. These sorts of the model have been utilized for numerous forecasting applications to reach improved accuracy. One of the key goals of these models is to study the various combinations of different topologies in enhancing prediction accuracy. By using the advantages of each topology separately, hybrid models may boost forecasting performance. Solving the PV power forecasting issue using hybrid models has shown excellent performance compared with stand-alone models. Hybrid methods for time series forecasting have recently developed as a dynamic and active research area8 using different techniques such as metaheuristic algorithms9, sparse representation theory10,11,12 and decomposition ensemble learning approaches13. A review of various forecasting techniques for solar irradiation and PV power is provided in13,14. A trending technique in the field of PV and other short-term forecasting domains is the use of deep learning techniques. Deep learning techniques are a complex and advanced type of machine learning approach. It can derive deep information from the PV power time series and produce high predictive results than other conventional models15.
Lulu Wen et al.16 developed a DL technique for solar power forecasting on an hourly scale. The forecasting outcomes prove that the DL model provides high precision than MLP and SVM models. A combined variational autoencoder VAE with a deep LSTM model provides low forecasting error (RMSE = 5.471) for short-term forecasting of PV power on different PV systems compared with different machine learning techniques17. The LSTM neural network model was proposed in18, for daily forecasting PV power. The outcomes of the developed model exhibit high forecasting performance compared to MLP, LR, and persistence methods. The proposed model present also 42.9% RMSE skill compared to the benchmarking models for 1-year testing data. Narvaez et al.19 used deep learning techniques for daily and weekly scale forecasting of PV power. The obtained results showed that the DL model performed 38% better than the traditional forecasting method. The integration of the CNN model with LSTM20 shows excellent forecasting accuracy compared to other methods for the hourly scale of PV power forecasting. The developed mechanism has yielded the lowest forecasting error in terms of MAE, MAPE, RMSE, 0.0506,13.42, and, and 0.0987, respectively.
Zhen et al. proposed a new combination methodology based on the BI-LSTM model with a genetic algorithm (GA) to improve PV power forecasting21. Abdel-Basset et al.22, introduce a new learning model PV-Net for short-term forecasting of PV power by reconfiguring the gates of the GRU model utilizing convolution layers. The achieved results show that the proposed PV-Net can extract hidden features from historical PV data and provide high forecasting accuracy. Wang et al.23 propose the use of the new deep learning model generative adversarial model networks (GANs) for weather classification employing Wasserstein GAN with gradient penalty and deep CNN-model. Research findings demonstrate the proposed WGANGP offers enhanced precision compared to reference models. Bendaoud et al.24 developed a conditional generative adversarial model network (CGAN) for short-term PV power forecasting using exogenous data. Huang et al.25, proposed a new combined model for hourly PV power forecasting. In their work, they developed a new time series conditional generative adversarial model TSF-CGAN, the proposed model is built by CNN and the Bi-LSTM model. The proposed combination methodology proves its performance against stand-alone models such as SVM, LSTM, RNN, and MLP models. Recent research has shown that the decomposition-learning strategy enhances the forecasting performance of stand-alone models significantly, and several time–frequency methodologies have been introduced for non-stationary signals analysis.
Wavelet Transform (WT)26, Empirical Mode Decomposition (EMD)27, Ensemble Empirical Mode Decomposition (EEMD)28, Multivariate Empirical Mode Decomposition (MEMD)29, Ensemble Empirical Mode Decomposition (EEMD)30, a modified variant of the conventional EMD (CEEMDAN)31,32 and Iterative Filtering decomposition method (IF)2. In this paper, five different decomposition learning approaches were independently investigated before being combined for short-term PV power forecasting, using one dimensional CNN model as an essence regressor owing to its capacity to extract more relevant features from the supplied input data.
The remaining parts of the work are structured as described below. In the second section, a detailed literary analysis of the different decomposition ensemble learning algorithms for PV power forecasting is presented. "Contributions of the paper" section presents the paper's contribution. Case studies, data collection, are presented in "Material and monitoring" section. The fundamental structure of the proposed model is presented in "Methodology" section. "Performance metrics" and "Results and discussion" sections discuss the model assessment and the key findings of this study, respectively.
Literature review
Scientists have conducted various research on sun radiation evaluation so far, with interesting results. In this section, hybrid decomposition approaches are classified according to the used decomposition method:
Empirical mode decomposition
Shang and Wei33 proposed a multi-stage PV power forecasting model in four regions in USE. They proposed an enhanced version of empirical model decomposition EEMD combined with the SVM regression model for 15-min and daily solar radiation forecasting. Maximize Relevancy Minimize Global Redundancy MRMGR feature selection technique is employed to reduce the huge numbers of decomposed components of endogenous and exogenous in different sites (400–600 feature vectors), after selecting the best candidate feature sets the improved SVM model is coupled with PSO technique for hyper-parameters tuning. The provided results show high forecasting accuracy compared with benchmarking models (MLP, RBF, ANFIS, NNPSO, -MLP, WT-RBF, WT-ANFIS, and WT-PSO).
Eseye et al.,34 suggested the use of wavelet transform coupled with POS and SVM models for multi-hour PV power forecasting using previous PV power with SCADA records and physical data. Behera et al.35, suggested a new hybrid model for short-term PV power forecasting. The developed model consists of three main steps: firstly, the historical PV power is split into a multi-frequency band using the EMD algorithm. The decomposed component derived from EMD is then fed into the ELM model to generate the specified PV power. The sine cosine algorithm (SCA) is utilized for ELM hyperparameter tuning. The proposed EMD-SCA-ELM method is compared to its counterparts models, SCA-ELM, EMD-ELM, and stand-alone ELM model. The comparison in term of statistical metrics shows that the suggested appraoch provides better performance for multistep forecasting.
Wang et al.36, proposed the use of ICEEMDAN decomposition techniques with a modified version of particular swarm optimization (MPSO) for hyper-parameter selection of the SVM model. The suggested strategy is more suitable for other common approaches for PV power forecasting.
Wang et al.37, proposed the combination of the variable-weight combination model with ensemble empirical mode decomposition (EEMD) for PV power forecasting. Firstly, EEMD is employed for decomposing PV power data into different sets of frequency ranges. The decomposed components are classified into three main categories, high-frequency, and intermediate-frequency. These three categories are separately forecasted using a parameters-weight integration model and summed to get the actual PV signal. Experimental results show that an individual forecast strategy provides better precision than a direct forecasting method.
Zhou et al.38, proposed a new integrated model for PV power forecasting, the developed model was validated on three different databases in Safi-Morocco. The combined model consists of using the CEEMDAN algorithm, multi-objective chameleon swarm algorithm (MOcsa), and four ML and DL models. The CEEMDAN is utilized for PV power decomposition, and the MOcsa strategy is employed for determining the weight coefficient of the used subsystems (Enn, LStm, Cnn, and BiLStm). The proposed forecasting strategy is validated on three data sets with different panel technology (May 25 to July 15, 2018, 5 min time scale) including one polycrystalline (p-Si), one amorphous (a-Si) technique, and eight monocrystalline (m-Si), and proves its prediction performance against different deep learning and machine learning technique in terms of mean relative error (MRE), mean absolute error (MAE), and Symmetric mean absolute percentage error (SMAPE).
Lin et al.39 developed a new cascade decomposition using EEMD and VMD algorithms, in which EEMD is used firstly to decompose the given time series into a set of intrinsic mode functions, then VMD is employed to split the first component IMF1 from the EEMD method to obtain more stable components. All the obtained IMFs components are then fed into the BILSTM model for PV power forecasting. The developed approach proves its performance compared to other forecasting models (EEMD-BILSTM, EEMD-LSTM, ANN, LSTM, VMD-GRU, EEMD-ANN, and BILSTM) models.
Niu et al.40, proposed multi-stages for short PV power forecasting. In the first stage, the random forest algorithm RF is used to rank the most important exogenous input and then remove the irrelevant data, then the selected factors are moved as weighted values to the improved grey (IGIVA) to select days with identical weather patterns. Time series PV power is decomposed using complementary ensemble empirical mode decomposition (CEEMD). In the modeling stage, the backpropagation neural network (BPNN) is used to forecast the desired output. The proposed RF-CEEMD-DIFPSO-BPNN model shows its forecasting performance and its stability under different weather conditions compared to other studied models.
Zhang et al.41, proposed a new integrated model for PV power forecasting which include time series decomposition using improved empirical mode decomposition (IEMD), feature selection strategy using Maximize Relevancy-Minimize Global Redundancy, then PSO–SVM as a forecasting model in which PSO algorithm serves for hyper-parameters selection.
Wavelet decomposition
Random Vector Functional Link (RVFL)—Seasonal Autoregressive Integrated Moving Average (SARIMA)—model combined with Maximum Overlap DWT was proposed in42, for three steps-ahead PV power forecasting in IIT Gandhinagar, India. In their work, the DWT was used to split the PV data into 5 sub-series for each decomposed component both forecasting models were applied, then a convex combination was utilized for the final forecast. The combination of these two models with DWT delivers excellent precision compared to the single models, and the combination of DWT-REVL, DWT-SARIMA.
De Giorgi et al.43 proposed the use of wavelet transform WT with least square support vector machine LS-SVM for hourly PV power forecasting 24 h ahead in Italy. In their work, they conducted many experiments and observed that the pairing of LS-SVM and ANN with WT delivers high performance, and for long time horizons WT-LS-SVM reaches the highest performance.
Wan et al.44 proposed the use of wavelet transform WT coupled with a deep CNN model to build a WT-DCNN forecasting model for hourly PV power in Belgium. In their work, WT is used to split the PV data into a set of different frequency ranges. The framework consists of a 1D-to a-to-2D-Image layer, convolution layer, pooling layer, 2D-to a 1D-layer, and finally logistic regression layer for each decomposition. Then a wavelet reconstruction phase is employed for the final forecast of the PV power signal. The achieved results show that the hybridization strategy performs better than the stand-alone (SVM and MLP) model and the hybrid WT-SVM in terms of forecasting criteria for all forecasting horizons in the two studied regions.
Chen et al.45, proposed a new fusing strategy for PV power forecasting using endogenous data on an hourly scale. In their work, the DWT algorithm was employed with an adaptive neuro-fuzzy inference system (ANFIS). The decomposed PV power signal is fed into the ANFIS model for outputting short-term PV power; different functions of wavelet mother were used (Haar, Daubechies, Coiflets, and Symlets). The achieved results demonstrate that the developed combination delivers high performance. Furthermore, they found that coif2-ANFIS and sym4-ANFIS offer low forecasting errors compared to all studied models.
Zhang et al.46 utilized a hybrid deep learning model coupled with WD and Artificial neural networks (ANN) to improve solar power plant output forecasts. They used WD as the network's transfer function and treats the model-weight, scaling-factor, and translation-factor as genetic individuals. The network's parameters are then obtained through independent optimization using a genetic algorithm and imported into the network. The authors found that the GA-WNN network performance outperforms conventional ANN models.
A hybrid deep LSTM network integrating wavelet packet decomposition (WPD) is proposed by Pengtao et al.47. Authors have utilized hybrid deep learning for 1-h-ahead PV power forecasting. The WPD algorithm is used to subdivide the initial PV power series. Four LSTM networks model are created for these sub-series. The performance of the WPD–LSTM method was demonstrated with a case study using data collected from an actual PV system in DKASC, Alice Springs, Australia. compared to individual LSTM, RNN, GRU, and MLP models, the WPD–LSTM model performs better in terms of predicting stability and accuracy.
Variational mode decomposition
Zang et al.48, developed a new hybridization method based on variational mode decomposition (VMD) integrated with the DCNN model for PV power forecasting on a daily and hourly scale. Each component of the VMD technique, which originated from PV power, is transformed into a 2D image for further training in parallel channels of the DCNN model. The proposed forecasting methodology 2D-VMD-DCC proves its ability in forecasting PV power with high precision compared to SVM, GPR, MLP, VMD-SVM, SMD-GPR, and 1D-VMD-CNN. Netsanet et al.49 proposed a multi-stage forecasting model for daily PV power forecasting in China. The proposed methodology involves five main stages, firstly the time series of PV power is decomposed through the VMD algorithm into different components, then mutual information MI is employed to select the most pertinent input data. In the forecasting steps, the ANN model is employed with the ant colony optimization (ACO) technique for hyper-parameters tuning to output the desired PV power, another ANN model is utilized as a cascade forecasting using the previously estimated PV power as input for the final forecast. The forecasting ability of the proposed VMD-ACO-ANN was compared to the single ANN model and the combined ANN with the genetic algorithm GA-ANN model. The forecasting performance of the proposed technique in terms of statistical metrics outperforms the benchmarking models.
Wu et al.50, proposed a new hybridization methodology for very short-term PV power forecasting in Australia. In the first stage, the VMD technique is used to decompose the PV signal into different frequency bands, then the fast correlation-based filter (FCBF) algorithm is employed to select relevant input features, then a BILSTM model is used as the essence regressor. The proposed VMD-FCBF-BILSTM model proves its forecasting ability against conventional models.
A new decomposition-combined model is proposed by Xie et al.51, the proposed combination method is based on the use of the VMD algorithm to decompose the PV power data into different frequency components, then Deep Belief Network DBN model is used to forecast the high-frequency components and Autoregressive model is used to forecast low-frequency components. The achieved results prove that the developed technique gives excellent performance compared to the basic models.
Korkmaz et al.52, proposed a new forecasting model SolarNet for short PV power forecasting in Australia Solar Centre. The proposed SolarNet is dependent on the use of the VMD decomposition algorithm and CNN model. The input data are; solar radiation, active power data, temperature, and humidity. The proposed CNN model consists of two structures, max-pooling, and pooling blocks to boost the forecasting effectiveness. The achieved results show that the proposed model outperforms other deep learning techniques for 1-h ahead forecasting.
Zhang et al.53 developed an integrated model for PV power assessment through the hybridization of the VMD algorithm, CNN, and BiGRU. The VMD algorithm decomposed the PV power series into several sub-modes. An input feature matrix is built using the antecedent values and various environmental parameters. The CNN technique is then used to model the fundamental input–output relation between the feature matrix and the target value. Next, the BiGRU network is used to forecast the next PV power. Combining the forecasting values of the sub-modes yields the exact forecasted PV power result. The results showed that the VMD-CNN-BiGRU model outperformed the EEMD-CNN-BiGRU model.
Korkmaz et al.54 proposed the use of SolarNet which is a one-dimension convolutional neural network model for short-term PV output power forecasting over various weather conditions. The experiments are carried out as a case study utilizing a 23.40 kW PV dataset from the Desert of Australia. The measured meteorological data are used as input parameters to the SolarNet model. To create deep input feature maps, the power data is split into sub-components using the VMD approach, followed by a data preparation and reconstruction procedure. The achieved results show that the VMD-CNN forecasting technique delivers excellent performance.
Contributions of the paper
Based on the analysis of relevant literature, we may infer that decomposition ensemble-learning techniques for PV power forecasting provide promising outcomes for further research. Firstly, the majority of developed models employ only one decomposition technique as a pre-processing step in the forecasting process of PV power. Secondly, instead of utilizing the decomposed PV power time series directly, the use of feature selection is a necessary step in improving prediction performance. Decomposition models are a feasible way of enhancing forecasting precision, based on the advantages and limits indicated in the current research. This research makes use of the concept of hybrid forecasting and introduces a new way of predicting PV power to fill the gap in the existing literature on this problem. The proposed hybridization mechanism is based mainly on the following combination: ensemble decomposition methods, multi-scale feature fusing, feature selection approach, and deep learning model.
The following section outlines the work's main novelty:
-
A new fusion strategy IF-VMD-FSRA-CNN for short PV power assessment is optimized to generalize and improve predicting efficiency in a variety of meteorological conditions.
-
The assessment and interpretation of several decomposition methods for short-term PV-plants power forecasting.
-
The fusing of multi-scale features from the employed decomposition techniques for boosting the forecasting precision of PV power output.
-
Using a feature selection technique allows users to choose the most meaningful intrinsic function IMFs from various multi-scale methodologies, which improves forecasting ability and minimizes the dimensionality of the data.
-
The deep CNN model is capable of deriving deeper characteristics from the fused multi-scale information to provide the appropriate PV output power.
-
Several tests were conducted, and the findings show that the suggested fusion mechanism produces more precise forecast outcomes than its counterparts models.
In comparison to previous research, the suggested forecasting methodology's efficiency is confirmed and validated on three grid-connected PV power systems in Algeria with various climate conditions. The suggested solution that utilizes hybrid approaches has yielded the lowest forecasting error.
Material and monitoring
Summary of data
Data from three photovoltaic power installed in three distinct locations covering different climatic conditions in Algeria were used in the study. The map in Fig. 1 depicts the geographic coverage of solar PV power plants employed in this research. The study area covers the three selected sites. The first PV plant station is Lekhneg, in the Laghouat region (33° 43′ 26.74″ N, 2° 48′ 45.27″ E)with a capacity of 60 MWp located in the south of Algeria55. The second grid-connected PV power is Oud Nechou in the Ghardaia region56,57, (32° 36′ 1.46″ N, 3° 42′ 3.42″ E) located also in the south of Algeria with a capacity of 1.1MWp. The third PV power station is Dhaya of Sidi Bel-Abbes (34° 41′ 32.23″ N, 0° 36′ 2.89″ O) located in the west of Algeria with a capacity of 12 MWp58.

The geographical distribution of the three grid-connected PV-plants [Software-QGIS (A Free and Open Source Geographic Information System), Version 3.36.0 RC, Link: https://qgis.org/en/site/)] [Global Solar Atlas (Link: https://globalsolaratlas.info/map)].
The photovoltaic solar power plants of Lahgouat, Ghardaa, and Sidi Bel-Abbes were commissioned in (April 2015/2016), as part of the national renewable energy program, and are one of 21 identical stations installed across the country to produce 400 MW. The information regarding the type of photovoltaic modules, the area of photovoltaic plants, and the data period of measured PV power in each PV station are given in Table 1. The photographs of the studied PV plants can be viewed in Fig. 2.

(a) Photo of the Laghouat site, (b) Photo of Sidi Bel Abbés site, (c) Photo of Ghardaia site.
Methodology
Complete ensemble empirical mode decomposition with adaptive noise (CEEMD)
CEEMDAN is an extension of EMD. Modal aliasing could be further reduced by using adaptive white noise to increase decomposition effectiveness. It is possible to utilize CEEMDAN to analyze and handle non-stationary signals in time and frequency59. It can generate signal wave patterns of various sizes and create a series of data sequences with local features at various periods, where each component is a stationary IMF. Two criteria must be satisfied by each IMFs component: (1) the mean value of the envelope formed by its local maximum and minimum must be zero at any moment, and (2) the number of extreme points in the entire dataset must be the same as zero-crossing points or vary by at most one.
For a time-series sequence \(\left(t\right)\) , the key steps of CEEMDAN decomposition are as follows:
-
At time m, we introduce white noise \({W}^{m}\left(t\right)\) to the original signal \({X}^{m}\left(t\right)\).
$${X}^{m}\left(t\right)=X\left(t\right)+{\varepsilon }_{0}{W}^{m}\left(t\right),m=\mathrm{1,2},\dots ,M$$(1)where M represents the number of realizations.
-
The first EMF \(\overline{{IMF }_{1}} \left(t\right)\) is calculated by taking the average of the EMD:
$$\overline{{IMF }_{1}} \left(t\right)=\frac{1}{M}\sum_{i=1}^{M}{IMF}^{1}\left(t\right)$$(2)Then, the residual components are computed as:
$${{\text{r}}}_{1}\left(t\right)=X\left(t\right)-\overline{{IMF }_{1}} \left(t\right)$$(3) -
The signal \({r}_{1}\left(t\right)+{\varepsilon }_{1}{EMD}_{1}\left({W}^{m}\left(m\right)\right)\) is decomposed in its turn by the EMD algorithm to produce the second IMF and the corresponding residual as below:
$$\overline{{IMF }_{2}}=\frac{1}{M}\sum_{i=1}^{M}{EMD}_{1}\left({r}_{1}\left(t\right)+{\varepsilon }_{1}{EMD}_{1}\left({W}^{i}\left(t\right)\right)\right)$$(4)$${r}_{2}\left(t\right)={r}_{1}\left(t\right)-\overline{{IMF }_{2}}$$(5) -
Repeat these steps to obtain the k-th residual and k + 1-th IMF component:
$${r}_{k}\left(t\right)={r}_{k-1}\left(t\right)-\overline{{IMF }_{2}}\left(t\right)$$(6)$$\overline{{IMF }_{k+1}}\left(t\right)=\frac{1}{M}\sum_{i=1}^{M}{EMD}_{1}\left({r}_{k}\left(t\right)+{\varepsilon }_{k}{EMD}_{k}\left({W}^{i}\right)\right)$$(7)where \({EMD}_{k}\) (■) indicates the k-th IMF mode.
-
Repeat Eqs. (6) and (7) until the remaining signal is unsuitable for being further decomposed through the EMD algorithm and then terminate the algorithm.
Finally, the time series X(t) decomposition result may be written as follows:
Variation mode decomposition (VMD)
The VMD technique is one of the most recent signal processing methods.. The VMD method is a non-recursive and adaptive decomposition process proposed for non-stationary signals. The VMD algorithm is similar to an adaptive Winer filter bank, which can split a given signal into a set of center frequencies with a restricted frequency range different from the EMD algorithm. The essence of the VMD technique is to decompose a given input signal into several sub-models that have a restricted bandwidth and a certain level of sparseness in bandwidth60.
Constructing and resolving variation issues is the primary focus of this approach. Solving constrained variation optimization issues is stated as:
Wher \({u}_{k}\left(t\right)\) represent the model function of the signal,\(\left\{uk\right\}\) is the model group {\(u1\) ,\(u2\) ,…,\(u3\) },\(wk\) is the central frequency of the k-th mode of the signal,\(\left\{uk\right\}\) indicate the center frequency of these decomposed modes,f(t) and \(\delta \left(t\right)\) represent the input signal and unit pulse function respectively.
Utilizing quadratic penalty factor and Lagrangian multiplier Eq. (1) can be developed as:
The changing orientation multiplication technique (ADMM) is employed to solve Eq. (10). The \({u}_{k}\) can be described as:
where n represents the iteration numbers, \(\widehat{f}\left(w\right)\), \({\widehat{u}}_{k}^{n+1}\left(w\right)\), \({\widehat{u}}_{i}\left(w\right)\) and \({\stackrel{`}{\lambda }}\left(w\right)\) indicate the form after \(f\left(wt\right)\), \({u}_{k}^{n+1}\left(t\right)\), \({u}_{k}\left(t\right)\), and \(\lambda \left(t\right)\) Fourier transform61.
Wavelet packet decomposition (WPD)
The WPD technique is traditional signal processing, which split a given signal into its adequate and detailed elements. Wavelet basis and decomposition levels have a significant impact on the WPD's performance. There are two kinds of WPD: the wavelet transform in its continuous and discrete forms. The following is a description of the continuous wavelet transform62:
where f(t) and \({\psi }\left(t\right)\) represent the input signal and the mother wavelet, respectively. The term b indicates the translation factor and a represents the scale factor and * denotes the conjugate complex factor. The discrete form of a and b in DWT can be summarized as follows:
Iterative filtering decomposition method (IF)
Recently, the iterative filtering technique is proposed to be an alternative to the EMD method and its variants2 for signal processing with adaptive filtering to enforce the convergence of IF. The primary variance between the IF approach and EMD and its alternative is that the moving average of a specific signal \(f\left(x\right),x\in {\mathbb{R}}\) is accomplished by employing the convolution of \(f\left(x\right)\) with a specific law pass filter63. Let's consider a signal \(\left(x\right),x\in {\mathbb{R}}\) and \(\mathcal{L}\left(f\right)\) represent the moving average of the input signal which can be estimated by64:
The term \(a\left(t\right)\) indicate the double average filter given by:
In IF methodology the operator \(\mathcal{L}\left(f\right)\) is obtained by the convolution of the signal \(f\left(x\right)\) by some specific filter \(W\).
Let’s define our operator as: \({S}_{1,n}\left({f}_{n}\right)\)=\({f}_{n}-{\mathcal{L}}_{1,n}\left({f}_{n}\right)={f}_{n+1}\) which shows the alteration part of \({f}_{n}\), the first IMF1 can be obtained by Eq. (17):
Apply the same method to the rest \(f-{IMF}_{1}\) until it becomes a trend signal, which implies it has just one local maximum or minimum. All IMF components are driven by two loops in the proposed IF methodology: an inner and an outer loop.
Time-varying filter-based empirical mode decomposition algorithm (TVF-EMD)
Time-varying filter-based empirical mode decomposition (TVF-EMD) is a newly established variant of the classic (EMD) suggested by Li et al.65. By adopting a B-spline approach filter to cope with shifting processes, the suggested TVF-EMD demonstrates its efficacy in resolving the shortcomings of the standard EMD algorithm. The fundamental concept of the suggested TVF-EMD relies on the fixed cutoff frequency and then follows with a time-varying filtering technique. The following are the key phases of the proposed TVF-EMD65,66:
-
1: Estimate the maximum point and identify it for a given signal \(x\left(t\right)\) as :
-
2: Determine all instances of intermittency that meet the following criteria:
\(\frac{max\left({\varphi }_{bis}{\prime}\left({u}_{i}:{u}_{i+1}\right)\right)-min({\varphi }_{bis}{\prime} ({u}_{i}:{u}_{i+1} ))}{min\left({\varphi }_{bis}{\prime}({u}_{i}:{u}_{i+1})\right)}>\rho \), where the position of \({u}_{i}\) can be considered as an intermittence :\({e}_{j}\left(j=\mathrm{1,2},3,\dots \right),{e}_{j}={u}_{i}\).
-
3: For each state of \({e}_{j}\) , there are two alternative positions placed on the falling edge or rising of \({\varphi }_{bis}{\prime}\left(t\right)\), if \({\varphi }_{bis}{\prime}\left({u}_{i+1}\right)>{\varphi }_{bis}{\prime}\left({u}_{i}\right)\),\({\varphi }_{bis}{\prime}\left({u}_{i}\right)\) can be viewed as a floor. Although, if \({\varphi }_{bis}{\prime}\left({u}_{i+1}\right)<{\varphi }_{bis}{\prime}\left({u}_{i}\right)\), then \({\varphi }_{bis}{\prime}\left({u}_{i}\right)\) can be found on its falling edge.
-
4: Interpolatebetween the maxima to perform the adaptation of the local cut-off frequency.
where \(\left({\varphi }_{bis}{\prime}\left(t\right)\right)\) specifies the cutoff frequency; a more detailed explanation may be found in65. Furthermore, the ending condition mentioned in the sifting step is as follows:
where \({B}_{Loughlin}\left(t\right)\) represent Loughlin instantaneous bandwidth and \({\varphi }_{avg}\left(t\right)\) displays the weighted average of the different components' instantaneous frequencies65,66. Actually, with the stated bandwidth cutoff \(\varepsilon \), the term "signal local narrow-band" is described as:\(\theta \left(t\right)\le \varepsilon \) , in which TVF-EMD spliting performance will be adequately adjusted.
Convolution neural network (CNN)
Deep learning techniques as a subfield of machine learning (ML) have received considerable attention from the scientific community in recent years. The CNN model, which is a significant deep-learning architecture inspired by the natural visual system of mammals is developed by LeCun67,68,69proposed. Deep CNNs can be built using the backpropagation technique to perform tasks such as classifying handwritten digits. Deep CNNs have dominated various computer vision and image processing applications, and recent applications of CNNs for time series prediction have generated highly promising results70,71. Convolution, pooling layer, and fully connected layers are the main building blocks that CNN's use to perform spatial hierarchies of features. The deep CNN model is mostly well adopted with time series signals for various regression and classification problems as introduced in72. The CNN models perform the optimization performance with less memory consumption, there is already a connection between the neurons in the adjacent layer of the fully connected networks. The hyper-parameters of Deep CNN model can be reduced efficiently; also, CNN models are able to extract special features with different lengths. Figure 5 displays an illustration of a CNN model used for time series forecasting employing univariate time-series data as input, we note that CNN's are more suitable suited for multivariate time series with features extracted through convolution and pooling layers.
Forward stepwise regression algorithm (FSRA)
Forward Stepwise Regression Algorithm (FSRA) is a systematic method used in statistical modeling to select the most relevant variables for a predictive model. This algorithm falls under the category of stepwise regression, which includes both forward selection and backward elimination methods. FSRA specifically uses the forward selection approach, where the model building process starts with no variables and then adds them one at a time based on specific criteria. The main steps of FSRA are as follow:
-
1.
Initialization Begin with a model containing no predictors. This means starting with a simple model that only includes the intercept .
-
2.
Variable Selection At each step, consider adding each variable that is not already in the model. The choice of which variable to add is based on a predetermined criterion, usually the one that results in the most significant improvement to the model. Common criteria include the lowest p-value in a t-test for the coefficient, the largest increase in R2, or a significant decrease in the Akaike Information Criterion (AIC) or Bayesian Information Criterion (BIC).
-
3.
Model Evaluation After adding the new variable, evaluate the model to ensure it significantly improves the model's performance. This can involve checking for statistical significance, improvements in goodness-of-fit measures, or cross-validation performance.
-
4.
Iteration Repeat the variable selection and model evaluation steps, adding one variable at a time, until no further significant improvements can be made to the model.
-
5.
Final Model The result is a model that includes a subset of the available variables that best explain the variation in the response variable, based on the criteria used for variable selection.
The hybrid-forecasting model
The main configuration of the suggested fusion strategy is presented in Fig. 3. Furthermore, the following are the major phases involved in the construction of the combined IF-VMD-FSRA-CNN forecasting model:
-
Step 1 Collect and analyze PV power data to generate training and testing sets. The training sets are utilized for model tuning (Hyper-parameter setting), while the testing sets are used for model assessment.
-
Step 2 Using the decomposition techniques, divide the training and testing sets into a varied number of IMFs elements. The nonlinearity and non-stationarity characteristic of the actual data might be efficiently used addressed using these decomposition methodologies.
-
Step 3 Individual use of each decomposition method for PV power forecasting and then fusing them to increase the forecasting accuracy.
-
Step 4 A feature selection technique is used to identify and rank the most important IMFs components for PV power forecasting.
-
Step 5 The identified IMFs sequence is deployed to train the deep CNN forecasting model as input variables.
-
Step 6 After that, the fully trained CNN model is utilized to evaluate forecasting efficiency on the test dataset.
-
Step 7 Examine the findings and assess the effectiveness of the three grid-connected under consideration.

Flowchart of the proposed fusing strategy.
It is feasible to demonstrate that the suggested integrated approach is intended to deal with a variety of qualities found that occur in the real world. Particularly, decomposition strategies were used to cope with the data's non-stationarity. The noisy and unnecessary IMFs components are then removed using a feature selection approach. The non-linear CNN model is then used to model the PV power output.
Results and discussion
Precise short-term assessments of PV power are crucial for ensuring the production and stability of necessary power system capacity. This section intends to present the simulation results for the suggested technique using multiple techniques. These strategies are further divided into three phases. The primary concept is to create a combination of different decomposition strategies with a deep learning approach for PV power forecasting, and then apply the suggested strategy to diverse time series forecasting. We start by assessing the potential of extracting multi-frequency features with the suggested decomposition techniques and evaluate each decomposition method separately on three grid-connected photovoltaic stations. The suggested combination methodologies have been adjusted for a horizon of 15 min, and a half hours ahead of PV power output. The suggested combination technique is assessed and verified on three separate PV power data sets, with 50% of each analyzed data set employed for training and the remainder for assessing forecasting ability. Solar irradiation, temperature, and the angle at which PV arrays are installed all influence PV power production. The association between previous PV power and future output PV power was the only focus of the present research. The concept of trial and error was used to evaluate the effect of different delays and determine the acceptable number of delays.
The PV power and its previously decomposed elements with optimum lag identification are the target outputs for training the supervised decomposition-deep learning method in this work. For each analyzed region, data pre-processing is the same. To validate the integrated model's forecasting ability, the hybridization approaches were compared to stand-alone models (GPR, LS-SVM, ELM). All models were trained and tested using the same methodology. The quantitative findings of the assessment criteria for each decomposition strategy and their counterpart models are depicted in Tables 3, 4, and 5 for Laghouat, Sidi Bel Abbés, and Ghardaia stations, respectively. Bold numbers reflect the most accurate estimation. during the forecasting process. According to the findings reported, in Tables 3, 4, and 5, various observations may be inferred. Starting with the results delivered by hybrid approaches, where we can see that these latter significantly exceed the basic models in terms of statistical metrics75. Moreover, the hybrid approaches generate PV power output with high precision. It observed that the nRMSE error generated by all decomposition techniques is less than 10% in all analyzed areas whereas the nRMSE of individual models ranged from 22 to 39%. It can be also observed that all decomposition algorithms provide different forecasting errors which vary within the range of nRMSE = [0.61–7.44] in all studied stations. That is, the proposed combination can generate a 30-min and 15-min ahead PV power output with acceptable accuracy better than stand-alone models. The proposed VMD-CNN and IF-CNN models, followed by TVF-CNN, WPD-CNN, and CEEMDAN-CNN models achieve the best forecasting precision in all studied regions. The VMD-CNN and IF-CNN models provide the highest average PV power production, which will be evaluated as the best candidate algorithm for multiscale fusing. For a more comprehensive view of the model's precision, a statistical representation is also required in order to have a better comprehension of model precision.
As shown in Fig. 4, the VMD-CNN model ranked as the best forecasting model for Laghouat and Sidi bel abbes PV station followed by the IF-CNN model. In the case of Ghardaia PV station, we observe that the IF-CNN model provides the best forecasting performance followed by the VMD-CNN model. All hybrid models, which have satisfactory convergence, perform better than individual models. On the contrary, the results achieved by single models (LS-SVM, GPR, and ELM-model) illustrate that these models are ineffective as compared to hybrid models.

Forecasting results overall studied regions in terms of nRMSE.
Figures 5, 6, and 7 show the actual and estimated PV power output on sunny and cloudy days patterns for the three studied regions. One can observe from the comparison of PV power forecasting that the forecasted PV power curve of stand-alone models (GPR, ELM, and LS-SVM model) show a remarkable gap between true and modeled values of PV power under different weather conditions. In both specific cases (sunny, and cloudy days), the results produced using hybrid decomposition ensemble learning techniques outperform those obtained with stand-alone models. Another relevant point is that the forecasting trend of the five developed hybrid models is identical to the actual data. For the three-studied PV station, the IF-CNN model and VMD-CNN model generate the closest PV power estimate to the real PV power data. In addition, the sub-figures show that the proposed VMD-CNN model and IF-CNN model can accurately match the trend and features of real PV power than the benchmarking models. The same figures may be used to infer additional information.

Forecasting results of various models Laghouat PV stations.

Forecasting results of various models Sidi Bel Abbés PV stations.

Forecasting results of various models (Ghardaia PV stations).
The outcomes are analyzed by considering all information investigated with all forecasting ranges. Because of the large number of numerical results in Tables 3, 4 and 5, it is necessary to investigate several elements of the forecasting model efficiency. On the resulting nRMSE metric, the Friedman and Nemenyi hypothesis testing76 was employed. Friedman test is a statistical method used to rank various models in classification or regression tasks. This test is particularly useful when these models exhibit inconsistent performance, i.e., their effectiveness varies from one dataset to another, making it challenging to determine the best model for a specific application. The Friedman-Nemenyi test is an effective statistical approach that aids in the ranking and comparison of the models used.
Friedman's test has been employed to score the proposed models throughout all forecasting horizons and analyzed PV plants. If the order difference is statically important, then a Nemenyi hypothesis test is conducted by comparing all forecasting models pair-by-pair. The RMSE, as a dependent scale statistic, cannot be used for model comparison across several datasets77. The previous study on time series forecasting has reported a similar concept, which can arise when alternative error metrics are utilized78. As a result, the test is conducted totally with the nRMSE metric, and the results are shown in Fig. 8.
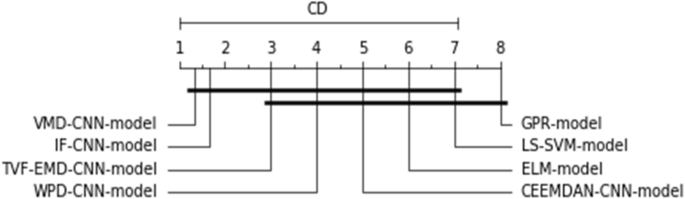
The Friedman-Nemenyi test applied to all datasets and methodologies.
As can be shown, after employing the Friedman-Nemenyi test statistic with 95% certainty, the suggested hybridization approach VMD-CNN-model delivers the best overall forecasting performance, outperforming hybrid and classic models when all-time series data is used.
The second part of our experiment investigates the fusing of multi-scale features two by two to improve the effectiveness of the forecasting performance of PV power output. Tables 7, 8, and 9, show the achieved results of the suggested strategy. The forecasting combination’s performance was examined using distinct day types. The results of different fusing combinations are shown in Tables 6, 7, and 8, the best outcomes are shown in bold. According to the numerical indicators, all proposed combination methods succeed in increasing the forecasting accuracy compared to the conventional forecasting model and individual decomposition techniques combined with the deep-CNN model, resulting in a reduced nRMSE = [0.44%-4] for all studied regions.
Another important remark is that combining decomposition approaches results in a significant improvement compared with the case of using each decomposition technique individually. As expected the integration of IF and VMD algorithm with deep-CNN-model provides high forecasting precision for all grid-connected PV stations. These outcomes show clearly that combining multi-scale features is highly beneficial for improving the forecasting precision of PV power87,88.
Another important observation is that VMD-CEEMDAN-CNN, VMD-WPD-CNN, and VMD-IF-CNN models are ranked as the best forecasting models for PV power output production, with a significant improvement achieved by the VMD-IF-CNN model for all studied PV power stations.
Figures 9, 10 and 11 exhibits the forecasting outcomes of all suggested multi-scale approach combinations in terms of the nRMSE indicator. According to the findings shown in Fig. 9, all suggested combinations produce strong forecasting results and increase the forecasting precision of individual decomposition approaches; in which the nRMSE error of the proposed hybridization technique varies within the range of [0.44–4].

Performance comparison of different decomposition algorithms in terms of nRMSE (Ghardaia).

Performance comparison of different decomposition algorithms in terms of nRMSE (Laghouat).

Performance comparison of different decomposition algorithms in terms of nRMSE (Sidi bel abbes).
As can be observed, after the employment of the Friedman–Nemenyi statistical test with 95% confidence, it was discovered that the suggested VMD-IF-CNN-model combination approach delivers the best forecasting performance, and outperforms its counterpart hybrid models for used time series data (See Fig. 12).
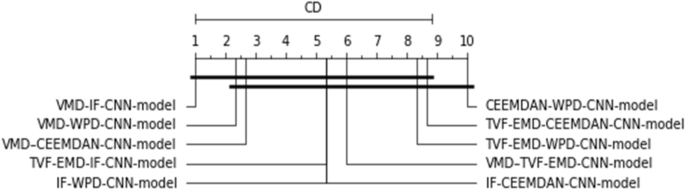
The Friedman-Nemenyi test is applied to all datasets and methodologies.
Furthermore, an effective PV power-forecasting algorithm should not be time-consuming; however, the suggested forecasting strategy is based on a deep learning technique, which requires time during the training phase. This indicates that training the deep CNN model may take a long time if a large number of similar multi-scale samples are employed. In this respect, Forward Stepwise Regression Algorithm (FSRA) is utilized for selecting the most appropriate IMFs input for PV power forecasting. The primary purpose of identifying the most significant IMFs inputs is to eliminate redundant features, which reduces the computation costs and model complexity89. The threshold between approved and rejected features was empirically established during the feature selection process. The developed models are assessed and trained by sequential feature sets obtained by including the next essential IMF elements continuously. The statistical forecasting metrics of the three analyzed PV stations are obtained by two scenarios, the suggested IF-VMD-CNN model with all IMFs elements, and the proposed IF-VMD-FSRA-CNN model combined with a feature selection approach (FSRA), which are illustrated in Table 9 for the three grid-connected photovoltaic plants. The benefit of combining our forecasting technique with a feature selection approach on forecasting accuracy and information space saving is observed. For all analyzed PV power stations, the FSRA algorithm was very useful in minimizing the amount of IMFs inputs necessary for training our deep neural network model while maintaining the forecasting quality of PV power output.
The undesired IMF features differ slightly by regional location, and forecasting time step, taking the case of the Laghouat PV station 30 min ahead forecasting, the selected IMFs components are 120 IMFs, and the unwanted IMFs numbers are 42. For Sidi Bel Abbés station, the FSRA algorithm removes 46 unneeded IMFs elements from the entire dataset while maintaining the forecasting effectiveness of the IF-VMD-CNN model. The FSRA technique at Ghardaia station removes 84 redundant IMFs elements from the entire dataset while retaining the forecasting ability of the proposed IF-VMD-CNN model. The FSRA algorithm was useful in reducing the amount of IMFs elements for training our model while preserving forecasting effectiveness. This reveals the findings that FS techniques can improve the accuracy of PV power forecasting methods. It is concluded that using a feature selection technique in training the suggested methodology improves forecasting accuracy and computation efficiency. The efficacy of FS methods is highly dependent on the dataset employed since the appropriate quantity of input varies from one PV plant to another. In addition, for each forecasting time step in each analyzed location, a distinct quantity of IMFs was employed as inputs. The findings clearly show that the proposed technique not only provided a remarkable precision rate but also ensured precise forecasting results throughout all periods and regions examined.
An additional evaluation was carried out to compare our proposed model with existing state-of-the-art models in PV power forecasting. The complexity of directly comparing our model to those from previous studies arises from variations in data duration, input variables, climate conditions, and the fact that most studies focus solely on one-step-ahead forecasting at a specific time scale. According to Table 10, our hybridization approach achieves superior forecasting performance relative to numerous preceding efforts. The IF-VMD-FSRA-CNN method we propose demonstrates enhanced suitability for forecasting PV power output, highlighting its efficacy and potential advancements in the field.
Limitations of the study
Our model demonstrates considerable potential in forecasting photovoltaic power yet encounters several challenges. These challenges encompass reliance on the quality of data, a propensity for overfitting when using small datasets, questions about its adaptability to various geographical locations and types of PV systems, and the need for significant computational resources due to its complexity.
In this research, our focus was primarily on the three region, constrained by the availability of data. It is imperative for future studies to broaden their scope to encompass additional regions characterized by diverse weather conditions, especially areas prone to cloudy skies. Examining the efficacy of different PV panel technologies across these varied climates could shed light on the versatility and effectiveness of forecasting models in differing environmental settings.
Moreover, although we employed deep learning techniques such as CNNs, LSTMs, which have shown encouraging outcomes, there remains room for exploration of other sophisticated deep learning architectures. Techniques like the Transformer and Informer, known for their prowess in time series forecasting, present promising avenues for future work. Investigating these models could uncover new strategies to enhance the accuracy and efficiency of PV power forecasting models.
Conclusion
The present study investigates the performance assessment and short-term forecasting of three PV systems of a 73.1 MW located in Algeria. The proposed forecasting method, VMD-IF-FSRA-CNN is presented to deal with dynamic changes in PV power production 15–30 min ahead. It was tested on three grid-connected PV power plants, and the results were compared to hybrid and stand-alone models. The findings show that the VMD-IF-FSRA-CNN model outperforms the state-of-the-art techniques and exhibits high forecasting accuracy for short-term prediction of PV power. Therefore, this work concentrates on the issue of forecasting PV power in the absence of climatic data, using few historical PV plant data as inputs to the suggested model. to estimate the future PV power output. An in-depth examination of several decomposition approaches coupled with a deep learning algorithm was carried out to get a better insight into what drives the performance of the PV dataset. This study indicates that the proposed combination mechanism is more suitable for multi-site time series forecasting, and could be used for other grid-connected PV power plants.
For future work, we aim to enhance our forecasting models by exploring more sophisticated deep learning methods in conjunction with sky imager data for PV power forecasting. This direction is intended to improve the accuracy and adaptability of our forecasting models by incorporating detailed visual observations of the sky. Such advancements will not only refine solar irradiance predictions but also broaden the models' applicability across diverse geographical locations and environmental conditions. Our ongoing research efforts will focus on developing these integrated models to further optimize the utilization of renewable energy resources, contributing to significant progress in the field of PV power forecasting.
Data availability
The datasets used and/or analysed during the current study available from the corresponding author on reasonable request.
Abbreviations
- ACO:
-
Ant colony optimization
- ANFIS:
-
Adaptive neuro-fuzzy inference system
- ANN:
-
Artificial neural networks
- AR:
-
Auto-regression
- ARIMA:
-
Auto-regressive integrated moving average
- ARMAX:
-
Auto-regressive moving average extrapolation
- a-Si:
-
One amorphous
- BiGRU:
-
Bi-directional gated recurrent unit
- BI-LSTM:
-
Bidirectional long short-term memory
- BPNN:
-
Back propagation neural network
- CEEMD:
-
Complementary ensemble empirical mode decomposition
- CGAN:
-
Conditional generative adversarial model network
- CNN:
-
Convolutional neural network
- DBN:
-
Deep belief network
- DCNN:
-
Deep convolutional neural network
- DL:
-
Deep learning
- EEMD:
-
Empirical mode decomposition
- ELM:
-
Extreme learning machine
- EMD:
-
Empirical mode decomposition
- FCBF:
-
Fast correlation-based filter
- GA:
-
Genetic algorithm
- GANs:
-
Generative adversarial model networks
- GPR:
-
Gaussian process regression
- GRU:
-
Gated recurrent unit
- HSV:
-
Hue saturation value
- ICEEMDAN:
-
Improved complete ensemble empirical mode decomposition with adaptive
- IEA:
-
International energy agency
- IEMD:
-
Improved empirical mode decomposition
- IF:
-
Iterative filtering
- IGIVA:
-
Improved grey ideal value approximation
- LR:
-
Linear regression
- LS-SVM:
-
Least squares support vector machines
- LSTM:
-
Long short-term memory
- MAE:
-
Mean absolute error
- MAPE:
-
Mean absolute percentage error
- MEMD:
-
Multivariate empirical mode decomposition
- MLP:
-
Multi-layer perceptron
- MOcsa:
-
Multi-objective chameleon swarm algorithm
- MODWT:
-
Maximum overlap discrete wavelet transform
- MPSO:
-
Modified particle swarm optimization
- MRE:
-
Mean relative error
- MRMGR:
-
Maximize relevancy minimize global redundancy
- m-Si:
-
Eight monocrystalline noise
- NWP:
-
Numerical weather prediction
- PR:
-
Performance ratio
- p-Si:
-
One polycrystalline
- PSO:
-
Particle swarm optimization
- PV:
-
Photovoltaic
- RBF:
-
Radial basis function
- RMSE:
-
Root mean square error
- RNN:
-
Recurrent neural network
- RVFL:
-
Random vector functional link
- SARIMA:
-
Seasonal autoregressive integrated moving average
- SCA:
-
Sine cosine algorithm
- SMAPE:
-
Symmetric mean absolute percentage error
- SPVP:
-
Solar photovoltaic plant
- SVM:
-
Support vector machine
- TSF-CGAN:
-
Time series conditional generative adversarial model network
- VAE:
-
Variational autoencoder
- VMD:
-
Variational mode decomposition
- WGANGP:
-
Wasserstein GAN with gradient penalty
- WPD:
-
Wavelet packet decomposition
- WT:
-
Wavelet transform
References
Minai, A., Husain, M., Naseem, M. & Khan, A. Electricity demand modeling techniques for hybrid solar PV system. Int. J. Emerg. Electr. Power Syst. 22(5), 607–615. https://doi.org/10.1515/ijeeps-2021-0085 (2021).
Khan, A. A. & Minai, A. F. Energy harvesting and A strategic review: The role of commercially available tools for planning, modelling, optimization, and performance measurement of photovoltaic systems. Systems, (2023).
Ahmed, R., Sreeram, V., Mishra, Y. & Arif, M. D. A review and evaluation of the state-of-the-art in PV solar power forecasting: Techniques and optimization. Renew. Sustain. Energy Rev. 124, 109792. https://doi.org/10.1016/j.rser.2020.109792 (2020).
Minai, A. F., Usmani, T., Alotaibi, M. A., Malik, H. & Nassar, M. E. Performance analysis and comparative study of a 467.2 kWp grid-interactive SPV system: A case study. Energies 15, 1107 (2022).
Bacher, P., Madsen, H. & Aalborg, H. Online short-term solar power forecasting. Sol. Energy 83(10), 1772–1783. https://doi.org/10.1016/j.solener.2009.05.016 (2009).
Li, Y., Su, Y. & Shu, L. An ARMAX model for forecasting the power output of a grid connected photovoltaic system. Renew. Energy 66, 78–89. https://doi.org/10.1016/j.renene.2013.11.067 (2014).
Khan, A. A., Minai, A. F., Pachauri, R. K. & Malik, H. optimal sizing, control, and management strategies for hybrid renewable energy systems: A comprehensive review. Energies 15, 6249 (2022).
Husain, M. A. et al. Performance analysis of the global maximum power point tracking based on spider monkey optimization for PV system. Renew. Energy Focus 47, 100503 (2023).
Guermoui, M., Gairaa, K., Boland, J. & Arrif, T. A novel hybrid model for solar radiation forecasting using support vector machine and Bee colony optimization algorithm: Review and case study. J. Sol. Energy Eng. Trans. ASME https://doi.org/10.1115/1.4047852 (2021).
Khan, A. A., Minai, A. F., Devi, L., Alam, Q. & Pachauri, R. K. Energy demand modelling and ANN based forecasting using MATLAB/Simulink. In 2021 International Conference on Control, Automation, Power and Signal Processing (CAPS), Jabalpur, India, pp. 1–6 (2021).
Minai, A. F., Usmani, T. & Iqbal, A. Performance evaluation of a 500 kWp rooftop grid-interactive SPV system at Integral University, Lucknow: A Feasible Study Under Adverse Weather Condition. In: Studies in Big Data, vol 86. (Springer, Singapore, 2021).
Fatima, K., Alam, M. A. & Minai, A. F. Optimization of solar energy using ANN techniques. In 2019 2nd International Conference on Power Energy, Environment and Intelligent Control (PEEIC), 2019, pp. 174–179.
Cherier, M. K., Hamdani, M., Guermoui, M., Mohammed, S. & Amine, E. Multi-hour ahead forecasting of building energy through a new integrated model. Environ. Progress Sustain Energy https://doi.org/10.1002/ep.13823 (2022).
Yan, C., Zou, Y., Wu, Z. & Maleki, A. Effect of various design configurations and operating conditions for optimization of a wind/solar/hydrogen/fuel cell hybrid microgrid system by a bio-inspired algorithm. Int. J. Hydrog. Energy 60, 378–391. https://doi.org/10.1016/j.ijhydene.2024.02.004 (2024).
Li, P., Hu, J., Qiu, L., Zhao, Y. & Ghosh, B. K. A distributed economic dispatch strategy for power-water networks. IEEE Trans. Control Netw. Syst. 9(1), 356–366. https://doi.org/10.1109/TCNS.2021.3104103 (2022).
Wen, L., Zhou, K., Yang, S. & Lu, X. Optimal load dispatch of community microgrid with deep learning based solar power and load forecasting. Energy https://doi.org/10.1016/j.energy.2019.01.075 (2019).
Dairi, A., Harrou, F., Sun, Y. & Khadraoui, S. Applied sciences short-term forecasting of photovoltaic solar power production using variational auto-encoder driven deep learning approach. Appl. Sci. https://doi.org/10.3390/app10238400 (2020).
Qing, X. & Niu, Y. Hourly day-ahead solar irradiance prediction using weather forecasts by LSTM. Energy 148, 461–468. https://doi.org/10.1016/j.energy.2018.01.177 (2018).
Narvaez, G., Giraldo, L. F., Bressan, M. & Pantoja, A. Machine learning for site-adaptation and solar radiation forecasting. Renew. Energy https://doi.org/10.1016/j.renene.2020.11.089 (2020).
Lee, W., Kim, K., Park, J., Kim, J. & Kim, Y. Forecasting solar power using long-short term memory and convolutional neural networks. IEEE Access 6, 73068–73080. https://doi.org/10.1109/ACCESS.2018.2883330 (2018).
Zhen, H., Niu, D., Wang, K., Shi, Y. & Ji, Z. Photovoltaic power forecasting based on GA improved Bi-LSTM in microgrid without meteorological information. Energy 231, 120908. https://doi.org/10.1016/j.energy.2021.120908 (2021).
Abdel-basset, M., Hawash, H., Chakrabortty, R. K. & Ryan, M. PV-Net : An innovative deep learning approach for ef fi cient forecasting of short-term photovoltaic energy production. J. Clean. Prod. 303, 127037. https://doi.org/10.1016/j.jclepro.2021.127037 (2021).
Wang, F. et al. Generative adversarial networks and convolutional neural networks based weather classi fi cation model for day ahead short-term photovoltaic power forecasting. Energy Convers. Manag. 181, 443–462. https://doi.org/10.1016/j.enconman.2018.11.074 (2019).
Mohamed, N., Bendaoud, M., Farah, N. & Ben, S. Energy & buildings comparing generative adversarial networks architectures for electricity demand forecasting. Energy Build. 247, 111152. https://doi.org/10.1016/j.enbuild.2021.111152 (2021).
Huang, X. et al. Time series forecasting for hourly photovoltaic power using conditional generative adversarial network and Bi-LSTM intergovernmental panel for climate change. Energy 246, 123403. https://doi.org/10.1016/j.energy.2022.123403 (2022).
Ghimire, S., Deo, R. C., Raj, N. & Mi, J. Wavelet-based 3-phase hybrid SVR model trained with satellite-derived predictors, particle swarm optimization and maximum overlap discrete wavelet transform for solar radiation prediction. Renew. Sustain. Energy Rev. 113, 109247. https://doi.org/10.1016/j.rser.2019.109247 (2023).
Andr, M., Calif, R. & Soubdhan, T. Hourly forecasting of global solar radiation based on multiscale decomposition methods: A hybrid approach. Energy 119, 288–298. https://doi.org/10.1016/j.energy.2016.11.061 (2017).
Wang, Y. & Wu, L. On practical challenges of decomposition-based hybrid forecasting algorithms for wind speed and solar irradiation. Energy 112, 208–220. https://doi.org/10.1016/j.energy.2016.06.075 (2016).
Prasad, R., Ali, M., Kwan, P. & Khan, H. Designing a multi-stage multivariate empirical mode decomposition coupled with ant colony optimization and random forest model to forecast monthly solar radiation. Appl. Energy 236, 778–792. https://doi.org/10.1016/j.apenergy.2018.12.034 (2019).
Sun, S., Wang, S., Zhang, G. & Zheng, J. A decomposition-clustering-ensemble learning approach for solar radiation forecasting. Sol. Energy 163, 189–199. https://doi.org/10.1016/j.solener.2018.02.006 (2018).
Guermoui, M. et al. Potential assessment of the TVF-EMD algorithm in forecasting hourly global solar radiation: Review and case studies. J. Clean. Prod. 385, 135680. https://doi.org/10.1016/j.jclepro.2022.135680 (2023).
Hou, M., Zhao, Y. & Ge, X. Optimal scheduling of the plug-in electric vehicles aggregator energy and regulation services based on grid to vehicle. Int. Trans. Electr. Energy Syst. 27(6), e2364. https://doi.org/10.1002/etep.2364 (2017).
Shang, C. & Wei, P. Enhanced support vector regression based forecast engine to predict solar power output. Renew. Energy 127, 269–283. https://doi.org/10.1016/j.renene.2018.04.067 (2018).
Tesfaye, A., Zhang, J. & Zheng, D. Short-term photovoltaic solar power forecasting using a hybrid wavelet-PSO–SVM model based on SCADA and Meteorological information. Renew. Energy 118, 357–367. https://doi.org/10.1016/j.renene.2017.11.011 (2018).
Behera, M. K. & Nayak, N. Engineering science and technology, an international journal a comparative study on short-term PV power forecasting using decomposition based optimized extreme learning machine algorithm. Eng. Sci. Technol. Int. J. 23(1), 156–167. https://doi.org/10.1016/j.jestch.2019.03.006 (2020).
Power, P. V. & Algorithm, S. V. M. SS symmetry the short-term forecasting of asymmetry photovoltaic power based on the feature extraction of,” 2020.
Wang, H., Sun, J. & Wang, W. Photovoltaic power forecasting based on EEMD and a variable-weight combination forecasting model. Sustainability https://doi.org/10.3390/su10082627 (2018).
Zhou, Y., Wang, J., Li, Z. & Lu, H. Short-term photovoltaic power forecasting based on signal decomposition and machine learning optimization. Energy Convers. Manag. 267, 115944. https://doi.org/10.1016/j.enconman.2022.115944 (2022).
Lin, W., Zhang, B., Li, H. & Lu, R. Neurocomputing Multi-step prediction of photovoltaic power based on two-stage decomposition and BILSTM. Neurocomputing 504, 56–67. https://doi.org/10.1016/j.neucom.2022.06.117 (2022).
Niu, D., Wang, K., Sun, L., Wu, J. & Xu, X. Short-term photovoltaic power generation forecasting based on random forest feature selection and CEEMD: A case study. Appl. Soft Comput. J. 93, 106389. https://doi.org/10.1016/j.asoc.2020.106389 (2020).
Zhang, W., Dang, H. & Simoes, R. A new solar power output prediction based on hybrid forecast engine and decomposition model Hilbert Huang transform. ISA Trans. https://doi.org/10.1016/j.isatra.2018.06.004 (2018).
Kushwaha, V. & Pindoriya, N. M. A SARIMA-RVFL hybrid model assisted by wavelet decomposition for very short-term solar PV power generation forecast. Renew. Energy 140, 124–139. https://doi.org/10.1016/j.renene.2019.03.020 (2019).
De Giorgi, M. G., Congedo, P. M., Malvoni, M. & Laforgia, D. Error analysis of hybrid photovoltaic power forecasting models: A case study of mediterranean climate. Energy Convers. Manag. 100, 117–130. https://doi.org/10.1016/j.enconman.2015.04.078 (2015).
Wang, H. et al. Deterministic and probabilistic forecasting of photovoltaic power based on deep convolutional neural network. Energy Convers. Manag. 153(April), 409–422. https://doi.org/10.1016/j.enconman.2017.10.008 (2017).
Chen, C., Ouedraogo, F. B., Chang, Y., Larasati, D. A. & Tan, S. Hour-ahead photovoltaic output forecasting using wavelet-ANFIS. Mathematics 9, 2438 (2021).
Zhang, C. & Zhang, M. Wavelet-based neural network with genetic algorithm optimization for generation prediction of PV plants. Energy Rep. 8, 10976–10990. https://doi.org/10.1016/j.egyr.2022.08.176 (2022).
Li, P., Zhou, K., Lu, X. & Yang, S. A hybrid deep learning model for short-term PV power forecasting. Appl. Energy 259, 114216. https://doi.org/10.1016/j.apenergy.2019.114216 (2020).
Zang, H. et al. Hybrid method for short-term photovoltaic power forecasting based on deep convolutional neural network. IET Gener. Transm. Distrib. https://doi.org/10.1049/iet-gtd.2018.5847 (2018).
Netsanet, S., Dehua, Z., Wei, Z. & Teshager, G. Short-term PV power forecasting using variational mode decomposition integrated with Ant colony optimization and neural network. Energy Rep. 8, 2022–2035. https://doi.org/10.1016/j.egyr.2022.01.120 (2022).
Selection, F. A short-term photovoltaic power forecasting method (2022).
Xie, T., Zhang, G., Liu, H., Liu, F. & Du, P. Applied sciences a hybrid forecasting method for solar output power based on variational mode decomposition, deep belief networks and auto-regressive moving average. Appl Sci. https://doi.org/10.3390/app8101901 (2018).
Korkmaz, D. SolarNet : A hybrid reliable model based on convolutional neural network and variational mode decomposition for hourly photovoltaic power forecasting. Appl. Energy 300, 117410. https://doi.org/10.1016/j.apenergy.2021.117410 (2021).
Zhang, C., Peng, T. & Shahzad, M. A novel integrated photovoltaic power forecasting model based on variational mode decomposition and CNN-BiGRU considering meteorological variables. Electr. Power Syst. Res. 213, 108796. https://doi.org/10.1016/j.epsr.2022.108796 (2022).
Korkmaz, D. SolarNet: A hybrid reliable model based on convolutional neural network and variational mode decomposition for hourly photovoltaic power forecasting. Appl. Energy 300, 117410. https://doi.org/10.1016/J.APENERGY.2021.117410 (2021).
Khelifi, R. et al. Short-term PV power forecasting using a hybrid TVF-EMD-ELM strategy. Int. Trans. Electr. Energy Syst. https://doi.org/10.1155/2023/6413716 (2023).
Bai, X., Xu, M., Li, Q. & Yu, L. Trajectory-battery integrated design and its application to orbital maneuvers with electric pump-fed engines. Adv. Space Res. 70(3), 825–841. https://doi.org/10.1016/j.asr.2022.05.014 (2022).
Gairaa, K., Voyant, C., Notton, G., Benkaciali, S. & Guermoui, M. Contribution of ordinal variables to short-term global solar irradiation forecasting for sites with low variabilities. Renew. Energy 183, 890–902. https://doi.org/10.1016/j.renene.2021.11.028 (2022).
Lei, Y., Yanrong, C., Hai, T., Ren, G. & Wenhuan, W. DGNet: An adaptive lightweight defect detection model for new energy vehicle battery current collector. IEEE Sens. J. 23(23), 29815–29830. https://doi.org/10.1109/JSEN.2023.3324441 (2023).
Yue, W., Li, C., Wang, S., Xue, N. & Wu, J. Cooperative incident management in mixed traffic of CAVs and human-driven vehicles. IEEE Trans. Intell. Transp. Syst. 24(11), 12462–12476. https://doi.org/10.1109/TITS.2023.3289983 (2023).
Yao, L., Wang, Y. & Xiao, X. Concentrated solar power plant modeling for power system studies. IEEE Trans. Power Syst. 39(2), 4252–4263. https://doi.org/10.1109/TPWRS.2023.3301996 (2024).
Naoussi, S. R. D. et al. Enhancing MPPT performance for partially shaded photovoltaic arrays through backstepping control with Genetic Algorithm-optimized gains. Sci. Rep. 14, 3334. https://doi.org/10.1038/s41598-024-53721-w (2024).
Liu, H., Mi, X. & Li, Y. Smart deep learning based wind speed prediction model using wavelet packet decomposition, convolutional neural network and convolutional long short term memory network. Energy Convers. Manag. 166(March), 120–131. https://doi.org/10.1016/j.enconman.2018.04.021 (2018).
Huang, N. E. et al. “The empirical mode decomposition and the Hilbert spectrum for nonlinear and non-stationary time series analysis. The empirical mode decomposition and the Hilbert spectrum for nonlinear and non-stationary time series analysis. Proc. R. Soc. London Ser. A Math. Phys. Eng. Sci. https://doi.org/10.1098/rspa.1998.0193 (1998).
Mfetoum, I. M. et al. A multilayer perceptron neural network approach for optimizing solar irradiance forecasting in Central Africa with meteorological insights. Sci. Rep. 14, 3572. https://doi.org/10.1038/s41598-024-54181-y (2024).
Li, H., Li, Z. & Mo, W. A time varying filter approach for empirical mode decomposition. Signal Process. 138, 146–158. https://doi.org/10.1016/j.sigpro.2017.03.019 (2017).
Jiang, Y., Liu, S., Zhao, N., Xin, J. & Wu, B. Short-term wind speed prediction using time varying fi lter-based empirical mode decomposition and group method of data handling-based hybrid model. Energy Convers. Manag. 18, 10. https://doi.org/10.1016/j.enconman.2020.113076 (2020).
Howard, R. E., Hubbard, W. & Jackel, L. D. Handwritten Digit Recognition with a Back-Propagation Network. pp. 396–404.
Li, S., Zhao, X., Liang, W., Hossain, M. T. & Zhang, Z. A fast and accurate calculation method of line breaking power flow based on taylor expansion. Front. Energy Res. 10, 94396. https://doi.org/10.3389/fenrg.2022.943946 (2022).
Guermoui, M. New soft computing model for multi-hours forecasting. Eur. Phys. J. Plus https://doi.org/10.1140/epjp/s13360-021-02263-5 (2022).
Shi, X., Chen, Z. & Wang, H. Convolutional LSTM network : A machine learning approach for precipitation nowcasting arXiv : 1506 . 04214v2 [cs . CV ] pp. 1–12 (2015).
Yang, C. et al. Optimized integration of solar energy and liquefied natural gas regasification for sustainable urban development: Dynamic modeling, data-driven optimization, and case study. J. Clean. Prod. https://doi.org/10.1016/j.jclepro.2024.141405 (2024).
Zeiler, M. D. & Fergus, R. Visualizing and understanding convolutional networks. pp. 818–833 (2014).
Guermoui, M., Gairaa, K., Rabehi, A., Djafer, D. & Benkaciali, S. Estimation of the daily global solar radiation based on the Gaussian process regression methodology in the Saharan climate. Eur. Phys. J. Plus 133(6), 1–17. https://doi.org/10.1140/epjp/i2018-12029-7 (2018).
Guermoui, M., Melgani, F. & Danilo, C. Multi-step ahead forecasting of daily global and direct solar radiation: A review and case study of Ghardaia region. J. Clean. Prod. https://doi.org/10.1016/j.jclepro.2018.08.006 (2018).
Wang, H. et al. A junction temperature monitoring method for igbt modules based on turn-off voltage with convolutional neural networks. IEEE Trans. Power Electron. 38(8), 10313–10328. https://doi.org/10.1109/TPEL.2023.3278675 (2023).
Demˇ, J. Statistical comparisons of classifiers over multiple data sets. J. Mach. Learn. Res. 7, 1–30 (2006).
Santos, D. S. D. O. et al. Solar irradiance forecasting using dynamic ensemble selection. Appl. Sci. 12, 3510 (2022).
Neto, P. S. G. D. M. et al. Neural-based ensembles and unorganized machines hydroelectric plants. Energies 13, 4769 (2020).
Wang, H., Lei, Z., Zhang, X., Zhou, B. & Peng, J. A review of deep learning for renewable energy forecasting. Energy Convers. Manag. 198, 111799. https://doi.org/10.1016/j.enconman.2019.111799 (2019).
Du, P. et al. The photovoltaic output prediction based on variational mode decomposition and maximum relevance minimum redundanc. Appl. Sci. 9(17), 3593. https://doi.org/10.3390/app9173593 (2019).
Zhang, T. et al. A photovoltaic power forecasting model based on dendritic neuron networks with the aid of wavelet transform. Neurocomputing 397, 438–446. https://doi.org/10.1016/j.neucom.2019.08.105 (2020).
AlHakeem, D., Mandal, P., Haque, A. U., Yona, A., Senjyu, T. & Tseng, T.-L. (Bill). A new strategy to quantify uncertainties of wavelet-GRNN-PSO based solar PV power forecasts using bootstrap confidence intervals. pp. 0–4 (2015).
VanDeventer, W. et al. Short-term PV power forecasting using hybrid GASVM technique. Renew. Energy 140, 367–379. https://doi.org/10.1016/j.renene.2019.02.087 (2019).
Ospina, J., Newaz, A. & Omar Faruque, M. Forecasting of PV plant output using hybrid wavelet-based LSTM-DNN structure model. IET Renew. Power Gener. 13(7), 1087–1095. https://doi.org/10.1049/iet-rpg.2018.5779 (2019).
Behera, M. K. & Nayak, N. A comparative study on short-term PV power forecasting using decomposition based optimized extreme learning machine algorithm. Eng. Sci. Technol. Int. J. 23(1), 156–167. https://doi.org/10.1016/j.jestch.2019.03.006 (2019).
Pan, M. et al. Photovoltaic power forecasting based on a support vector machine with improved ant colony optimization. J. Clean. Prod. 277, 123948. https://doi.org/10.1016/j.jclepro.2020.123948 (2020).
Duan, Y., Zhao, Y. & Hu, J. An initialization-free distributed algorithm for dynamic economic dispatch problems in microgrid: Modeling, optimization and analysis. Sustain. Energy Grids Netw. 34, 101004. https://doi.org/10.1016/j.segan.2023.101004 (2023).
Shirkhani, M. et al. A review on microgrid decentralized energy/voltage control structures and methods. Energy Rep. 10, 368–380. https://doi.org/10.1016/j.egyr.2023.06.022 (2023).
Liu, Y., Liu, X., Li, X., Yuan, H. & Xue, Y. Model predictive control-based dual-mode operation of an energy-stored quasi-Z-source photovoltaic power system. IEEE Trans. Ind. Electron. 70(9), 9169–9180. https://doi.org/10.1109/TIE.2022.3215451 (2023).
Acknowledgements
The researchers would like to acknowledge the Deanship of Scientific Research, Taif University for funding this work.
Funding
This work is funded and supported by the Deanship of Scientific Research, Taif University.
Author information
Authors and Affiliations
Contributions
M.G., A.F., Z.M., A.R.: Conceptualization, Methodology, Software, Visualization, Investigation, Writing—Original draft preparation. K.F., N.B., S.B., A.R.: Data curation, Validation, Supervision, Resources, Writing—Review & Editing. E.A., M.B., S.A.D.M. and S.S.M.G.: Project administration, Supervision, Resources, Writing—Review & Editing.
Corresponding authors
Ethics declarations
Competing interests
The authors declare no competing interests.
Additional information
Publisher's note
Springer Nature remains neutral with regard to jurisdictional claims in published maps and institutional affiliations.
Rights and permissions
Open Access This article is licensed under a Creative Commons Attribution 4.0 International License, which permits use, sharing, adaptation, distribution and reproduction in any medium or format, as long as you give appropriate credit to the original author(s) and the source, provide a link to the Creative Commons licence, and indicate if changes were made. The images or other third party material in this article are included in the article's Creative Commons licence, unless indicated otherwise in a credit line to the material. If material is not included in the article's Creative Commons licence and your intended use is not permitted by statutory regulation or exceeds the permitted use, you will need to obtain permission directly from the copyright holder. To view a copy of this licence, visit http://creativecommons.org/licenses/by/4.0/.
About this article

Cite this article
Guermoui, M., Fezzani, A., Mohamed, Z. et al. An analysis of case studies for advancing photovoltaic power forecasting through multi-scale fusion techniques. Sci Rep 14, 6653 (2024). https://doi.org/10.1038/s41598-024-57398-z
Received:
Accepted:
Published:
DOI: https://doi.org/10.1038/s41598-024-57398-z
Keywords
Comments
By submitting a comment you agree to abide by our Terms and Community Guidelines. If you find something abusive or that does not comply with our terms or guidelines please flag it as inappropriate.
