
Abstract
Potential risks of treatment with hydroxychloroquine (HCQ) include QT interval prolongation, hypoglycemia, a wide range of neuropsychiatric manifestations, hematotoxicity, and potential genetic defects. HCQ is extremely toxic when used in overdose and can lead to tachycardia, hypotension, known central nervous system, transmission defects, hypokalemia and other manifestations in individuals. The mechanism of excessive HCQ leading to these manifestations is still unclear. In this paper, overdose HCQ at different concentrations was used to treat zebrafish embryos, and the phenomena like human beings were obtained, such as increased heart rate and nervous system inhibition. With the increase of concentration to 100 μM, embryo mortality and malformation rate increased and hatching rate decreased, in situ hybridization showed abnormal differentiation of embryo germ layers and formation of vital organs. We selected embryos treated with 50 μM HCQ, in which concentration the mortality rate, hatching rate and malformation rate of the embryos were like those of the control group, for transcriptome analysis. Although the above indexes did not change significantly, the molecular changes related to the development of the heart, eye, nerve and other important organs were significant. This study provides useful information for further research on the toxicity mechanism of HCQ overdose, and provides some insight that can guide future studies in humans.
Introduction
Hydroxychloroquine (HCQ) is a 4-aminoquinoline derivative prepared by beta hydroxylation of chloroquine. It is used in the treatment of malaria, rheumatoid arthritis, and systemic lupus erythematosus (SLE)1. Over the last several years, there has been heightened interest in HCQ because of it being a candidate drug for the treatment and/or prophylaxis of coronavirus disease 2019 (COVID-19). Between March 30, 2020, and June 15, 2020, HCQ was granted emergency use authorization by the Food and Drug Administration, allowing it to be used for COVID-19 outside the clinical trial setting, resulting in widespread use during that time window2,3. Later investigations demonstrated increased morbidity and mortality, largely owing to cardiotoxicity associated with HCQ. The FDA retracted its EUA on June 15, 2020, warning not to use these agents to treat COVID-194,5.
HCQ is generally well tolerated, but clinicians and patients should be aware of serious adverse events that can occur, even during short courses of treatment. Potential risks of treatment include QT interval prolongation (a measurement made on an electrocardiogram, calculated as the time from the start of the Q wave to the end of the T wave), hypoglycemia, neuropsychiatric effects, drug–drug interactions and idiosyncratic hypersensitivity reactions6. Genetic variability in metabolism of these drugs is considerable and influences their safety and effectiveness7. HCQ overdoses are rare, and very serious. Life-threatening symptoms may occur within 30 min with very rapid progression to death within a few hours1. A previous study found that a 16-year-old girl ingested a handful of HCQ 200 mg, 30 min before presentation and presented with tachycardia (heart rate 110 beats/min), hypotension (systolic blood pressure 63 mmHg), central nervous system depression, conduction defects (QRS = 0.14 ms), and hypokalemia (K = 2.1 meq/L)1. Awareness of the onset of symptoms, potential severity, toxidrome, and treatment recommendations will greatly aid in patient survival. Unfortunately, treatment recommendations for this drug overdose are not well established and are often unconventional.
The study of the effect of excessive HCQ on the heart, nerves and other important organs and the mechanism of toxicity will provide a theoretical basis for the treatment of excessive HCQ intake. In this study, zebrafish was used as a model organism to study the toxic effects of excessive HCQ on the body. We believe that our study provides insights into the toxicity of HCQ in the animal model studied. Furthermore, considering that zebrafish is considered a good translational model for humans8, this study provides some insight that can guide future studies in humans.
Results
HCQ-induced developmental defects
Mortality
Zebrafish embryo mortality was recorded at 8 h postfertilization (hpf), 1 day postfertilization (dpf), 2 dpf, 3 dpf, and 4 dpf under the influence of 0 μM, 12.5 μM, 25 μM, 50 μM, 100 μM, and 200 μM HCQ that was administered at 0 hpf.
The cumulative mortality of the control and experimental groups at concentrations of HCQ not exceeding 50 μM remained low (p > 0.05) as follows: 0 μM (0.0%), 12.5 μM (5.9%), 25 μM (3.6%), and 50 μM (0.0%). Prior to completion of 1 dpf, the experimental group mortality rate at concentrations exceeding 50 μM remained low. On reaching 1 dpf however, the cumulative mortality rate at 100 μM increased significantly to 26.8% (p < 0.05). The mortality rate at 200 μM further surged significantly to 81.2% at 1 dpf, 89.6% at 2 dpf, and reached a maximum of 93.8% at 3 dpf (p < 0.05) (Fig. 1A).

Survival curves of zebrafish embryos exposed to different concentrations of HCQ from 8 hpf to 4 dpf. Lines of different colors represent different groups, and green represents the control group. (A) Unpaired t test was used to test for statistical significance *P < 0.05; **P < 0.01; ***P < 0.001; ****P < 0.0001, the same as below. (B–E) Images are examples of developmental malformations. Scale bars, 100 μM.
Deformity
While embryos in the control group were found to develop normally during all exposure periods. the HCQ group developed abnormalities at concentrations higher than 50 μM. As shown in Fig. 1B–E, these included tail deformities, scoliosis, yolk deformities, delayed development, pericardial edema, and ocular deformities, with the latter two being the most obvious. Similar to effect observed in terms of embryo mortality, the severity of abnormalities including pericardial edema, yolk sac deformities, and ocular deformities increased with increasing HCQ concentrations. Embryos exposed to 200 μM HCQ exhibited the severest deformities.
Hatching rate
At 3 dpf, the hatching rate of the control group was 89%. At HCQ concentrations below 50 μM, the hatching rate was 71% (12.5 μM), 91% (25 μM), and 68% (50 μM). At concentrations above 50 μM, the hatching rate decreased rapidly to 32% (100 μM) and 6% (200 μM) (Fig. 2B), which may be related to the increase in embryo mortality (26.8% at 100 μM, and 93.8% at 200 μM) (Fig. 1A) at similar HCQ concentrations. At 96 hpf, all the live embryos were found to be dechorionated (Fig. 2B).
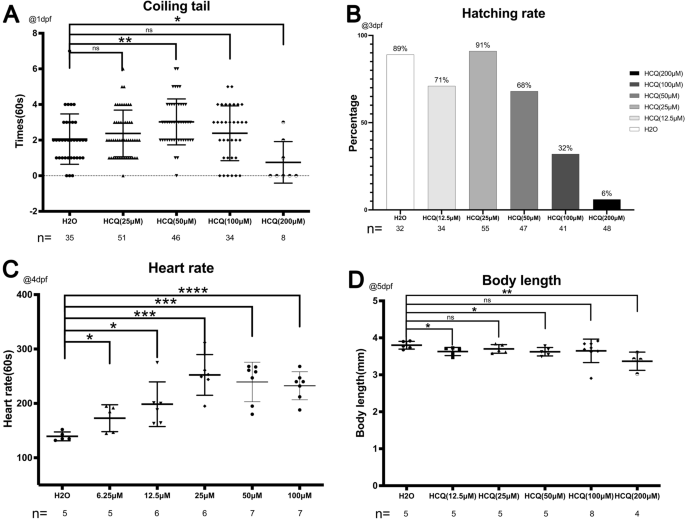
(A) Scatter plot and statistical results of the number of coiling tail at 1 dpf. (B) Scatter plot and statistical results of hatching rate in 3 dpf. (C) Scatterplot and statistical results of heart rate in 4 dpf. (D) Scatter plot and statistical results of body length in 5 dpf.
Heart rate
The heart rates of the zebrafish embryos were recorded at 4 dpf. Towards this end, heart rates of selected embryos from each group were recorded for 20 s post stabilization of the embryonic heartbeat at room temperature for 10 min9.
The heart rate of the control group was 139.4 ± 8.1 beats per minute, which was increased to 172.8 ± 24.7 (6.25 μM), 198.5 ± 41.0 (12.5 μM), 252.3 ± 37.4 (25 μM), 239.4 ± 36.4 (50 μM), and 232.4 ± 25.8 (100 μM) bpm post exposure to HCQ, thereby demonstrating that HCQ affects cardiac contractility of zebrafish embryos.
These results indicate that HCQ significantly increases the heart rate of zebrafish embryos (p < 0.05), in a dose-dependent manner. However, the effect was slower at concentrations above 25 μM, which may be a consequence of the cardiotoxic potential of high HCQ concentrations10,11 (Fig. 2C).
Body length
The body length of zebrafish was found to decrease with increasing HCQ concentrations at 5 dpf. While the body length of zebrafish in the control group was 3.8 ± 0.1 mm, that of the experimental group was 3.6 ± 0.1 mm (12.5 μM), 3.7 ± 0.1 mm (25 μM), 3.6 ± 0.1 mm (50 μM), 3.6 ± 0.3 mm (100 μM), and 3.3 ± 0.2 mm (200 μM). Further, the experimental groups exposed to 12.5 μM, 50 μM and 200 μM HCQ differed significantly from the control group, with the most obvious decrease in body length observed at 200 μM (Fig. 2D).
Behavior
Spontaneous embryonic movements in the yolk sac were recorded for 1 min at 1 dpf (Fig. 2A). The number of tail coilings per minute in the control group was 2.1 ± 1.4 which was significantly different from that observed at 25 μM (2.4 ± 1.3 times/min) and 100 μM (2.4 ± 1.5 times/min). While the 50 μM group (3.0 ± 1.3 times/min) showed a significant increase (p < 0.005), the 200 μM group (0.8 ± 1.2 times/min) demonstrated a significant decrease (p < 0.05).
As evident from Supplementary video 1, the movements of larvae in terms of swimming distance and velocity in the HCQ group showed reduced responsiveness to external stimuli as compared to that in the control group at 3 dpf. This effect was increasingly apparent with increasing concentrations of HCQ.
Furthermore, replacing the 50 μM HCQ group experimental solution with the same egg water as the control group at 3 dpf, we observed a recovery of responsiveness to external stimuli at 4pdf (24 h later). Therefore, it may be inferred that HCQ interferes, although reversibly with spontaneous zebrafish movements.
In situ hybridization
To determine the effect of HCQ on zebrafish embryonic tissue development, the control as well as the 50 μM and 100 μM HCQ-treated groups were continually monitored.
At 5 hpf, whole-mount in situ hybridization (WISH) revealed significant increase in the dorsal organizer markers gsc and chd in embryos exposed to 50 μM and100 μM HCQ at the shield stage (p < 0.05). In these groups HCQ changed the fate of dorsal–ventral cells and expanded the dorsal area, thus indicating that it can developmentally regulate the dorsoventral axis in zebrafish. In contrast, the expression of the ventral marker eve1 did not differ significantly between the 50 μM (p > 0.05), 100 μM (p > 0.05) and control groups (Fig. 3A).

Germ layer marker expression detected by ISH during gastrulation at 5 hpf (A) and 7 hpf (B). Orientation: ntla and sox17, dorsal views with animal pole to the top at 75% epiboly stage; dorsal-animal views with anterior towards the top: otx2; others, animal-pole view (eve1, chd, gsc and gata2a) with dorsal to the right. The scatter plot on the right corresponds to the statistical results of hybridization signals. Scale bars, 100 μM.
The expression of the epidermal marker gata2a was decreased throughout the ectoderm in the shielding stage (7 hpf stage) in the 50 μM (p < 0.05) and 100 μM (p < 0.05) groups, and zebrafish in these groups exhibited significantly reduced ectodermal development (Fig. 3B).
Additionally, similar to the observation made for marker genes at 7 hpf, the expression level of the mesoderm marker ntla was not significantly different in the 50 μM group (p > 0.05), but increased significantly in the 100 μM group (p < 0.05) as compared to that of the control group. Therefore, 100 μM HCQ upregulates development of zebrafish mesoderm (Fig. 3B).
The endoderm marker sox17 and anterior neuroectoderm marker otx2 did not differ significantly between the 50 μM and control groups (p > 0.05), but were significantly reduced in the 100 μM group (p < 0.05). Therefore, 100 μM HCQ downregulates the development of zebrafish endoderm (intestines, liver, and other internal organs) and anterior neuroectoderm (Fig. 3B).
Prox1a is a target of β-catenin-TCF/LEF signaling in the zebrafish eye12, and Pax2a is expressed in several structures, including the immature eye, mesoderm, nervous system, neural keel, and pronephros. At 1 dpf, the expression levels of prox1a and pax2a were not significantly different between the 50 μM and control groups (p > 0.05), but were significantly lowered in the 100 μM group (p < 0.05). A decrease in the expression of these two markers indicates that HCQ downregulates development of the zebrafish eye, nervous system, and renal system (Fig. 4A).

(A) Marker expression at 24 hpf. Lateral views with anterior to the left. (B) Heart morphology (marked by the pan-cardiomyocyte marker myl7) at 48 hpf. Embryo orientation: ventral view with the anterior at the top. Arrows point to the atrium; red lines demonstrate the acute angle formed between the atrial and ventricular axes. The scatter plot on the right corresponds to the statistical results of angles.
Myl7, a cardiac marker is expressed in cardiomyocytes throughout the entire heart. At 2 dpf, the expression of myl7 was not significantly different between the control, 50 μM (p > 0.05), and 100 μM (p > 0.05) groups (Fig. 4B).
Transcriptome analysis
The molecular mechanism of HCQ treatment in terms of its effect on zebrafish embryonic RNA levels was analyzed by using a transcriptome assay (NCBI SRA accession: PRJNA879284).
Treatment with 50 μM HCQ resulted in differential expression of 960 transcripts, of which 581 were upregulated and 379 were significantly downregulated as compared to that in the control group (Fig. 5A and Supplementary Table 1).

(A) Overall statistics of differential genes. (B) Significantly differential genes associated with the development of the cardiovascular system. (C) Significantly differential genes associated with eye and optic nerve development. (D) Number of significantly differentially expressed genes for biological processes, cellular components, and molecular functions. (E) Significantly differential genes associated with the development of the nervous system.
Gene Ontology (GO) enrichment analysis revealed that expression of genes related to 24 biological processes, 16 cellular components, and 11 molecular functions was significantly modified (Fig. 5D). Among those involved in biological processes, 1322 genes exhibited increased expression and 1489 demonstrated decreased expression. The number of upregulated and downregulated genes related to cellular components was found to be 1062 and 801 respectively. An additional 518 genes were upregulated and 424 were downregulated among those related to molecular functions (Fig. 5D and Supplementary Table 2).
Given the ISH results and abnormal zebrafish development consequent to HCQ treatment, we specifically analyzed the transcriptomics of certain systems. The findings revealed significant differences in 53 genes related to cardiovascular development between the HCQ and control groups, of which 26 genes were downregulated and 27 genes were upregulated (Fig. 5B and Supplementary Table 3).
Additionally, significant differences in the expression of 16 genes related to ocular development were found between the HCQ and control groups, of which five genes were upregulated and 11 genes were downregulated (Fig. 5C and Supplementary Table 4). We found significant differences in 91 genes related to nervous system development in the HCQ group compared with the control group. 46 genes were up-regulated and 45 genes were down-regulated (Fig. 5E and Supplementary Table 4).
To characterize the functions of these differentially expressed transcripts, the Kyoto Encyclopedia of Genes and Genomes (KEGG) pathway-based classification analysis of the ontology of cellular processes, environmental information processing, genetic information processing, human diseases, metabolism, and organismal systems was performed. This revealed that the longevity regulating pathway was the only one which was significantly enriched in the HCQ-treated embryos as compared to that in the control embryos (Fig. 6 and Supplementary Table 5). A previous study demonstrated enhancement of the oxidative stress processes in zebrafish because of HCQ exposure13. We found two genes, namely nfe2 and pxdn, that are involved in the oxidative stress process. The gene nfe2 is also involved in cancer pathways, cardiovascular disease, and aging; however, none of these pathways were found to be significantly enriched (Supplementary Table 6).

The top 20 enriched KEGG pathways, the pathway selected by the red dashed box is the only one significantly enriched.
Discussion
Hydroxychloroquine has a good oral absorption, long plasma elimination, and slow renal clearance and crosses the placental barrier, being found at similar concentrations in both the umbilical cord blood and maternal blood14. The therapeutic range for SLE was 500–2000 ng/ml (1.15–4.61 μM), and above 2000 ng/ml were considered supratherapeutic15. In this study, zebrafish was used as a model organism to study the toxic effect of excessive HCQ on the body. The experimental concentrations were 6.25 μM, 12.5 μM, 25 μM, 50 μM, 100 μM and 200 μM. Is about 5 times, 10 times, 20 times, 40 times, 80 times, 160 times, 320 times of the minimum therapeutic blood concentration, while the starting 6.25 μM is similar to the maximum therapeutic concentration. We observed the phenotype, mortality, hatching rate, body length, heart rate and behavior of zebrafish embryos treated with excessive HCQ, and analyzed the important marker genes such as embryo differentiation and tissue formation by in situ hybridization and transcriptome analysis, in order to obtain the effect of excessive HCQ on the phenotype and function of zebrafish embryos.
This study found that: (1) when the concentration was greater than 50 μM, the embryo mortality increased significantly, the developed abnormalities mortality increased significantly, the hatching rate decreased rapidly; (2) in all of the concentrations of overdose HCQ, the heart rate of zebrafish embryos increased significantly; (3) he movements of larvae in terms of swimming distance and velocity in the HCQ group showed reduced responsiveness to external stimuli as compared to that in the control group. This effect was increasingly apparent with increasing concentrations of HCQ.
In 50 μM HCQ, except the dorsal organizer markers gsc and chd were significantly increased, the ventral marker eve1, the epidermal marker gata2a, the mesoderm marker ntla, the endoderm marker sox17, prox1a and pax2a were no significant change from the control group. but in 100 μM HCQ, all markers were significant change from the control group.
The molecular mechanism of HCQ treatment in terms of its effect on zebrafish embryonic RNA levels was analyzed by using a transcriptome assay. Treatment with 50 μM HCQ resulted in differential expression of 960 transcripts, of which 581 were upregulated and 379 were significantly downregulated as compared to that in the control group Including genes related to ocular development, heart development and nerves.
For the first time, we evaluated the toxicity of overdose HCQ on zebrafish embryos, provided useful information for further research on the toxicity mechanism of HCQ overdose, and provides some insight that can guide future studies in humans.
Material and methods
Ethical approval and ethics statement
All experiments in this study were conducted in accordance with ARRIVE guidelines and “Guide for the Care and Use of Laboratory Animals”16, and were approved by the Animal Care and Use Committee of West China Second University Hospital, Sichuan University (Approval ID: HXDEYY20131021)17.
Zebrafish lines and embryos
Wildtype (WT) AB strain fish lines were utilized. Staging of the embryos was carried out as previously described18. Ages of the embryos are given as hours post-fertilization (hpf) or days post-fertilization (dpf). Zebrafish are reared under a 14 h light/10 h dark cycle and are fed the shrimp larvae 2–3 times a day. The water temperature is maintained at 28 ± 1 °C at pH 7. The day before spawning, two pairs of adult zebrafish are placed in a breeding pond with spawning trays and separate males and females overnight by clapboard. The next morning, the zebrafish mate after removing the clapboard, then collect the embryos and place them in a Petri dish filled with egg-water (60 μg ocean salt/mL) (https://zfin.org/zf_info/zfbook/zfbk.html).
Reagents
HCQ stock solution
HCQ sulfate was purchased from MedChemExpress (MCE) (Cat # HY-B1370, China), for experimental use, a 10 mM stock solution was prepared in ultra-pure water (Millipore Milli-Q® Integral 3 Water Purification System), then storage at – 80 °C (Haier Ultra Low Temperature Freezer DW-86L626).
HCQ working solution
Working solutions of HCQ at concentrations of 12.5, 25, 50, 100, 200 μM were prepared by dilution with egg-water [reverse osmosis water containing 60 mg sea salt (Crystal Sea®, Aquatic Eco-systems, Inc., Apopka, FL, USA) per liter of water (pH 7.5) with addition of freshly made sodium bicarbonate solution]19. All solutions were temporarily stored at 4 °C before use.
Treatment of zebrafish embryos with HCQ and measurement parameters at each stage
For treatment with HCQ (12.5, 25, 50, 100, 200 μM), 1-cell stage post-fertilization embryos were used to simulate in vivo fertilization. For each experiment leading to the analysis of relevant endpoints, eggs laid at the exact same time were pooled. For each treatment, around 50 embryos (± 5) were placed in each Petri dish containing 20 ml buffered egg water. At 5 hpf, 7 hpf, 24 hpf and 48 hpf stage, we collected embryos and larvae for ISH experiment. We calculated the survival rate at 8 hpf, 1 dpf, 2 dpf and 3 dpf. Hatching rate was calculated after 3 dpf. At 60 hpf, tail coiling activity was videoed. At 80 hpf stage, heart rate was scored. Body length were measured at 5 dpf stage with ImageJ software, iridophore images were acquired at the same stage. Control groups (egg-water) were examined simultaneously.
Zebrafish embryo in situ hybridization and statistics
Whole-mount in situ hybridization was carried out as previously described in Thisse et al.20 and Sun et al.21. Antisense probe RNAs for in situ hybridization were synthesized using DIG RNA Labeling Kit (SP6/T7) (Roche) and purified by MEGAclear (Ambion). Grayscale measurement and statistics were performed as previously described22. Whole-mount ISH images were taken under same magnification and exposure settings by Nikon SMZ1270 microscopy and standardized them with same software setting. Signal strength gray scale of wholemount ISH images was measured by ImageJ software. Measurement for cardiac looping angle at 2 dpf was done as Peng et al.23 and Choudhry and Trede24 described25. Statistical significance is defined as P < 0.05(*), P < 0.01(**), P < 0.001(***).
Analysis of the transcriptome
We collected the embryos to RNA extraction and RNA-seq experiments by Genedenovo Biotechnology Co., Ltd (Guangzhou, China) for transcriptomic analysis by RNA-seq as previously described26. Embryos were collected from control and experiment group treated with 50 μM HCQ at 5 hpf stage.
Statistical analysis
GraphPad Prism, version 9 (GraphPad Software Inc., CA, USA), was used for statistical analysis. We used the unpaired t test to assess for significant differences in expected frequencies between two groups. The survival analyses were conducted using the log-rank (Mantel–Cox) test. P < 0.05 was considered statistically significant in a two-sided test.
Data availability
Raw sequencing data of transcriptome assay from this study has been deposited in the NCBI Sequence Read Achieve (SRA) under the accession number PRJNA879284 (Release date: 2022-09-13, http://www.ncbi.nlm.nih.gov/sra/).
References
Marquardt, K. & Albertson, T. E. Treatment of hydroxychloroquine overdose. Am. J. Emerg. Med. 19, 420–424. https://doi.org/10.1053/ajem.2001.25774 (2001).
Huybrechts, K. F. et al. Hydroxychloroquine early in pregnancy and risk of birth defects. Am. J. Obstet. Gynecol. 224, 290.e291–290.e222. https://doi.org/10.1016/j.ajog.2020.09.007 (2021).
Levy, R. A. et al. Hydroxychloroquine (HCQ) in lupus pregnancy: Double-blind and placebo-controlled study. Lupus 10, 401–404. https://doi.org/10.1191/096120301678646137 (2001).
Rosenberg, E. S. et al. Association of treatment with hydroxychloroquine or azithromycin with in-hospital mortality in patients with COVID-19 in New York State. JAMA 323, 2493–2502. https://doi.org/10.1001/jama.2020.8630 (2020).
Hidano, D., Dhruva, S. S. & Redberg, R. F. US Food and Drug Administration-mandated postmarketing studies for high-risk cardiovascular devices approved 2015–2019. JAMA Intern. Med. 182, 556–558. https://doi.org/10.1001/jamainternmed.2022.0184 (2022).
Juurlink, D. N. Safety considerations with chloroquine, hydroxychloroquine and azithromycin in the management of SARS-CoV-2 infection. Can. Med. Assoc. J. 192, E450. https://doi.org/10.1503/cmaj.200528 (2020).
Juurlink, D. N. Safety considerations with chloroquine, hydroxychloroquine and azithromycin in the management of SARS-CoV-2 infection. CMAJ 192, E450–E453. https://doi.org/10.1503/cmaj.200528 (2020).
Tal, T., Yaghoobi, B. & Lein, P. J. Translational toxicology in zebrafish. Curr. Opin. Toxicol. 23–24, 56–66. https://doi.org/10.1016/j.cotox.2020.05.004 (2020).
IcogluAksakal, F. & Ciltas, A. Developmental toxicity of penconazole in Zebrfish (Danio rerio) embryos. Chemosphere 200, 8–15. https://doi.org/10.1016/j.chemosphere.2018.02.094 (2018).
Mubagwa, K. Cardiac effects and toxicity of chloroquine: A short update. Int. J. Antimicrob. Agents 56, 106057. https://doi.org/10.1016/j.ijantimicag.2020.106057 (2020).
Jordaan, P. et al. Cardiotoxic potential of hydroxychloroquine, chloroquine and azithromycin in adult human primary cardiomyocytes. Toxicol. Sci. 180, 356–368. https://doi.org/10.1093/toxsci/kfaa194 (2021).
Loh, S.-L. et al. Zebrafish yap1 plays a role in differentiation of hair cells in posterior lateral line. Sci. Rep. 4, 4289. https://doi.org/10.1038/srep04289 (2014).
Mendonça-Gomes, J. M. et al. Environmental impacts of COVID-19 treatment: Toxicological evaluation of azithromycin and hydroxychloroquine in adult zebrafish. Sci. Total Environ. 790, 148129. https://doi.org/10.1016/j.scitotenv.2021.148129 (2021).
Bouariu, A. et al. The potential benefit of hydroxychloroquine in chronic placental inflammation of unknown etiology associated with adverse pregnancy outcomes. Healthcare 10, 168 (2022).
Durcan, L., Clarke, W. A., Magder, L. S. & Petri, M. Hydroxychloroquine blood levels in systemic lupus erythematosus: Clarifying dosing controversies and improving adherence. J. Rheumatol. 42, 2092–2097. https://doi.org/10.3899/jrheum.150379 (2015).
National Research Council Committee for the Update of the Guide for the, C. & Use of Laboratory, A. In Guide for the Care and Use of Laboratory Animals (National Academies Press (US) Copyright © 2011, National Academy of Sciences, 2011).
Lin, Z., Luo, M., Zhou, B., Liu, Y. & Sun, H. CFTR regulates embryonic T lymphopoiesis via Wnt signaling in zebrafish. Immunol. Lett. 234, 47–53. https://doi.org/10.1016/j.imlet.2021.04.010 (2021).
Kimmel, C. B., Ballard, W. W., Kimmel, S. R., Ullmann, B. & Schilling, T. F. Stages of embryonic development of the zebrafish. Dev. Dyn. 203, 253–310. https://doi.org/10.1002/aja.1002030302 (1995).
Gu, Q., Rodgers, J., Robinson, B. & Kanungo, J. N-acetylcysteine prevents verapamil-induced cardiotoxicity with no effect on the noradrenergic arch-associated neurons in zebrafish. Food Chem. Toxicol. 144, 111559. https://doi.org/10.1016/j.fct.2020.111559 (2020).
Thisse, C. & Thisse, B. High-resolution in situ hybridization to whole-mount zebrafish embryos. Nat. Protoc. 3, 59–69. https://doi.org/10.1038/nprot.2007.514 (2008).
Sun, H. et al. Zili inhibits transforming growth factor-beta signaling by interacting with Smad4. J. Biol. Chem. 285, 4243–4250. https://doi.org/10.1074/jbc.M109.079533 (2010).
Sun, H. et al. CFTR mutation enhances dishevelled degradation and results in impairment of Wnt-dependent hematopoiesis. Cell Death Dis. 9, 275. https://doi.org/10.1038/s41419-018-0311-9 (2018).
Peng, X. et al. CXXC5 is required for cardiac looping relating to TGFβ signaling pathway in zebrafish. Int. J. Cardiol. 214, 246–253. https://doi.org/10.1016/j.ijcard.2016.03.201 (2016).
Choudhry, P. & Trede, N. S. DiGeorge syndrome gene tbx1 functions through wnt11r to regulate heart looping and differentiation. PLoS ONE 8, e58145. https://doi.org/10.1371/journal.pone.0058145 (2013).
Liu, Y. et al. CFTR deficiency causes cardiac dysplasia during zebrafish embryogenesis and is associated with dilated cardiomyopathy. Mech. Dev. 163, 103627. https://doi.org/10.1016/j.mod.2020.103627 (2020).
Liu, M. et al. Treatment of human T-cell acute lymphoblastic leukemia cells with CFTR inhibitor CFTRinh-172. Leuk. Res. 86, 106225. https://doi.org/10.1016/j.leukres.2019.106225 (2019).
Funding
This research was supported by grants from National Natural Science Foundation of China (82271692, 81670346, 81974365 and 81974226), Natural Science Foundation of Sichuan Province (2022NSFSC0782), Sichuan Science and Technology Program (2020ZYD007, 2018HH0014 and 2019YFS0350) and the Fundamental Research Funds for the Central Universities (SCU2022F4080) and the West China Second University Hospital (Nos. KS151 and KS152).
Author information
Authors and Affiliations
Contributions
H.S. and Y.L. conceived and designed the experiments; M.L., D.X. and Z.L. performed the experiments; H.S., Y.L., M.L., D.X. and Z.L. analyzed the data; M.L., D.X., Y.L. and H.S. wrote the paper.
Corresponding authors
Ethics declarations
Competing interests
The authors declare no competing interests.
Additional information
Publisher's note
Springer Nature remains neutral with regard to jurisdictional claims in published maps and institutional affiliations.
Supplementary Information
Rights and permissions
Open Access This article is licensed under a Creative Commons Attribution 4.0 International License, which permits use, sharing, adaptation, distribution and reproduction in any medium or format, as long as you give appropriate credit to the original author(s) and the source, provide a link to the Creative Commons licence, and indicate if changes were made. The images or other third party material in this article are included in the article's Creative Commons licence, unless indicated otherwise in a credit line to the material. If material is not included in the article's Creative Commons licence and your intended use is not permitted by statutory regulation or exceeds the permitted use, you will need to obtain permission directly from the copyright holder. To view a copy of this licence, visit http://creativecommons.org/licenses/by/4.0/.
About this article

Cite this article
Luo, M., Xie, D., Lin, Z. et al. Toxicology evaluation of overdose hydroxychloroquine on zebrafish (Danio rerio) embryos. Sci Rep 12, 18259 (2022). https://doi.org/10.1038/s41598-022-23187-9
Received:
Accepted:
Published:
DOI: https://doi.org/10.1038/s41598-022-23187-9
This article is cited by
Comments
By submitting a comment you agree to abide by our Terms and Community Guidelines. If you find something abusive or that does not comply with our terms or guidelines please flag it as inappropriate.
