
Abstract
Fertility plays a key role in the success of calf production, but there is evidence that reproductive efficiency in beef cattle has decreased during the past half-century worldwide. Therefore, identifying animals with superior fertility could significantly impact cow-calf production efficiency. The objective of this research was to identify candidate regions affecting bull fertility in beef cattle and positional candidate genes annotated within these regions. A GWAS using a weighted single-step genomic BLUP approach was performed on 265 crossbred beef bulls to identify markers associated with scrotal circumference (SC) and sperm motility (SM). Eight windows containing 32 positional candidate genes and five windows containing 28 positional candidate genes explained more than 1% of the genetic variance for SC and SM, respectively. These windows were selected to perform gene annotation, QTL enrichment, and functional analyses. Functional candidate gene prioritization analysis revealed 14 prioritized candidate genes for SC of which MAP3K1 and VIP were previously found to play roles in male fertility. A different set of 14 prioritized genes were identified for SM and five were previously identified as regulators of male fertility (SOD2, TCP1, PACRG, SPEF2, PRLR). Significant enrichment results were identified for fertility and body conformation QTLs within the candidate windows. Gene ontology enrichment analysis including biological processes, molecular functions, and cellular components revealed significant GO terms associated with male fertility. The identification of these regions contributes to a better understanding of fertility associated traits and facilitates the discovery of positional candidate genes for future investigation of causal mutations and their implications.
Introduction
As the human population continues to grow exponentially, so does the demand for animal proteins, such as beef and beef by-products1. In 2014, the Intergovernmental Panel on Climate Change (IPCC) report estimated that by 2050 meat consumption will rise 21% per capita as a result of a larger human population, leading to business and economic benefits for beef producers2. One way we can continue to match the demand of beef and beef by-products with the ever-growing population is through increasing beef cattle fertility3,4. This can be attained through the use of genetics to select for more fertile bulls, thereby increasing breeding success rates and decreasing the number of replacement heifers. However, over the last few decades, fertility in beef cattle has decreased because of intense selection pressure on production traits3. One of the reasons for this decrease in fertility results from the pleiotropic effect of genes and biological processes underlying fertility and production, such as cell proliferation and energy conservation metabolism5,6. Therefore, further research on the functional biology underlying fertility traits in cattle is required to prevent these undesirable side effects of selection6,7,8,9.
Genetic studies have focused primarily on female fertility, which presents a significant challenge to improving beef cattle fertility because of the low heritability (0.01–0.10) of these reproductive traits10. Fertility-related traits in bulls are moderately heritable (0.05–0.22) and significantly influenced by genetics11. Therefore, improving our understanding of the genes and epigenetic modifications that contribute to bull fertility could improve reproduction success in beef cattle11,12. Indeed, sires directly influence the fertilization process, the viability of the preimplantation embryo, as well as the conception rate13. Sperm motility (SM) could be used as a proxy for identifying more fertile sires and improving reproduction success because it is a moderate to highly heritable trait (0.29–0.60) with significant components in the genome contributing to semen quality14,15,16. With reduced motility in bull semen becoming a prominent concern in the breeding industry, it is essential to continue studying genomic regions, variants and functional genes that impact motility15.
Scrotal circumference (SC) is also a good indicator trait for sire fertility because it is highly correlated with testes weight, sperm output, and semen quality17. Previous studies have suggested that a smaller SC is associated with lower fertility measures compared to bulls with a larger SC18. Moreover, a positive association has been reported between SC and the percentage of live sperm, sperm number, and SM18. Therefore, the identification of genetic markers linked to SC and SM could be used as a strategy to genetically improve reproductive performance17. However, there is a negative genetic correlation between performance traits, such as feed efficiency, and SC, with more feed-efficient bulls having smaller SC17,19. Thus, careful consideration must be taken into account when selecting for both production and fertility traits to avoid undesirable effects.
Relatively fewer GWAS for bull fertility traits have focused on crossbred beef cattle, which represent a significant proportion of the beef cattle population, compared to purebred cattle20,21. This is in part due to multiple beef breeds with each breed association carrying out a separate genetic evaluation using different methods to calculate expected progeny deviation and the correspondence of SNP effects22. In this study we used a sample size of 265 bulls with both SC and SM measurements. Numerous other male fertility GWAS in cattle have obtained interesting results with a very similar sample size15,18,23,24,25,26,27. Therefore, the objectives of the present study were (1) to find SNP windows significantly associated with SC and SM in crossbred beef bulls using a single-step approach, and (2) to identify positional candidate genes with additional functional evidence and their potential role in bull fertility. To the best of our knowledge, this is the first study that uses a GWAS to analyze both SC and SM measurements simultaneously, in Canadian crossbred beef cattle, bringing new considerations for the current stage of literature regarding male fertility traits in beef cattle.
Results
Scrotal circumference genome wide association study and QTL enrichment
After quality control, 379,591 markers remained for analysis based on a call rate greater than 95% and a minor allele frequency greater than 5% with non-autosomal markers. The Manhattan plot in Fig. 1a shows the non-overlapping windows 1 Mb apart which explain the highest proportion of variance for SC. Eight windows explained more than 1% of the genetic variance for SC which were located on BTA9, BTA10, BTA20, BTA24 and BTA29, and explained 13.19% of the total genetic variance (Table 1). Thirty-two positional candidate genes were identified within these windows explaining more than 1% of the genetic variance for SC. ToppGene prioritization analysis revealed 14 of the 32 positional candidate genes were prioritized for spermatic-related processes and the windows which these genes are mapped within explained 9.76% of the total genetic variance for SC. The QTL annotation revealed several reproduction QTLs, annotated within the coordinates of the windows explaining > 1% of the total genetic variance for SC, account for 7.85% of the QTLs annotated in those regions (Fig. 2a). The QTL enrichment analysis revealed 38 significant QTLs (FDR-corrected p value ≤ 0.05) on BTA9 and BTA10 annotated for traits related to exterior conformation (Table 2; Fig. 2b).

Manhattan plot for the GWAS of (a) scrotal circumference and (b) sperm motility in crossbred beef cattle. The y-axis shows the proportion of variance explained by the non-overlapping windows and the x-axis indicates the chromosome number. The red line indicates the threshold for 1% of the variance explained by the windows.

(a) Pie plot showing the percentage of each QTL class annotated in the windows explaining > 1% of the total genetic variance for scrotal circumference. (b) Enriched traits identified in the QTL enrichment analysis for scrotal circumference. The area with the circles represents the number of observed QTLs for that class, while the color represents the p value scale (the darker the color, smaller the p value). The x-axis shows the richness factor for each QTL, representing the ratio of number of QTLs and the expected number of that QTL.
Sperm motility genome wide association study and QTL enrichment
The Manhattan plot in Fig. 1b shows the non-overlapping SNP windows 1 Mb apart that explain the highest proportion of variance for SM. Five windows explained more than 1% of the genetic variance for SM which were located on BTA9, BTA13, BTA20, and BTA24, and explained 7.17% of the total genetic variance (Table 1). Twenty-eight positional candidate genes were identified within these SNP windows explaining more than 1% of the genetic variance for SM. ToppGene prioritization revealed 14 of the 28 positional candidate genes were prioritized for spermatic-related processes and the windows which these genes are mapped within explained 7.16% of the total genetic variance for SM. The QTL annotation revealed several reproduction QTLs, annotated within the coordinates of the windows explaining > 1% of the total genetic variance for SM, account for 8.11% of the QTLs annotated in these regions (Fig. 3a). The QTL enrichment analysis revealed 13 significant QTLs (FDR-corrected p value ≤ 0.05) on BTA9 and BTA13 annotated for traits related to reproduction and exterior conformation (Table 2; Fig. 3b).

(a) Pie plot showing the percentage of each QTL class annotated in the windows explaining > 1% of the total genetic variance for sperm motility. (b) Enriched traits identified in the QTL enrichment analysis for sperm motility. The area with the circles represents the number of observed QTLs for that class, while the color represents the p value scale (the darker the color, smaller the p value). The x-axis shows the richness factor for each QTL, representing the ratio of number of QTLs and the expected number of that QTL.
Functional analysis of prioritized candidate genes for scrotal circumference and sperm motility
The network constructed with the 14 prioritized candidate genes for SC and SM (total of 28 genes) using NetworkAnalyst had 1442 nodes (genes) related to 120 GO:BP (Table S2a), 78 GO:MF (Table S3a) and 69 GO:CC (Table S4a) terms. One hundred and twenty GO:BP were significant (FDR-corrected p value ≤ 0.05) and 64 were identified as related to male fertility and reproduction (Table S2b). These 64 GO:BP terms were selected to construct the first module containing 752 genes (Table S2c). A second module was generated composed only by the prioritized candidate genes for SC and SM and its directly connected nodes leading to a network constructed of 20 genes and 26 GO:BP terms (Fig. 4a, Table S2d). None of the GO:BP in this module were significant (the smallest FDR-corrected p value was 0.128), however nine were related to male fertility and reproduction of which regulation of MAPK cascade, spermatid differentiation, and regulation of hormone secretion were the most notable (Table 3). In this second module, five of the 20 genes were prioritized candidate genes for SM and one gene was prioritized for SC.

Gene network generated in NetworkAnalyst 3.0 (https://www.networkanalyst.ca) via selection of the prioritized candidate genes for scrotal circumference and sperm motility and the significant (a) Biological process, (b) Molecular function, and (c) Cellular component GO terms involved in reproductive processes (FDR-corrected p value ≤ 0.05).The blue circles are the prioritized candidate genes for scrotal circumference and sperm motility and the grey circles represent the directly connected genes.
Of the 78 GO:MF, 75 were significant (FDR-corrected p value ≤ 0.05) and 34 were identified as related to male fertility and reproduction functions (Table S3b). The first module for GO:MF terms was extracted using these 34 GO:MF terms containing 684 genes (Table S3c). A second module for GO:MF was generated composed only by the prioritized candidate genes for SC and SM and its directly connected nodes revealing a network constructed of 32 genes and 20 GO:MF terms (Fig. 4b, Table S3d). In this second module, 10 GO:MF were significant (FDR-corrected p value ≤ 0.05) and six of these were related to male fertility and reproduction including, acetyltransferase activity, zinc ion binding, lipase activity, endonuclease activity, nuclease activity, and cation channel activity (Table 3). Five of the 32 genes in this second module for GO:MF were prioritized candidate genes for SM and four were prioritized candidate genes for SC.
Of the 69 GO:CC terms, 55 were significant (FDR-corrected p value ≤ 0.05) and 28 were related to male fertility and reproduction functions and processes (Table S4b). These 28 GO:CC terms were selected to extract the first module for GO:CC which contained 992 genes (Table S4c). “Batch Selection” of the prioritized candidate genes for SC and SM was used to extract the second module for GO:CC which revealed a network containing 51 genes and 21 GO:CC terms (Fig. 4c, Table S4d). In this second module, five GO:CC were significant (FDR-corrected p value ≤ 0.05) and three of these were related to male fertility and reproduction including, kinesin complex, spindle microtubule and cytosol (Table 3). Five of the 51 genes in the second GO:CC module were prioritized candidate genes for SM and seven genes were prioritized candidate genes for SC. A graphical representation of the functional analysis can be found in Fig. 5.
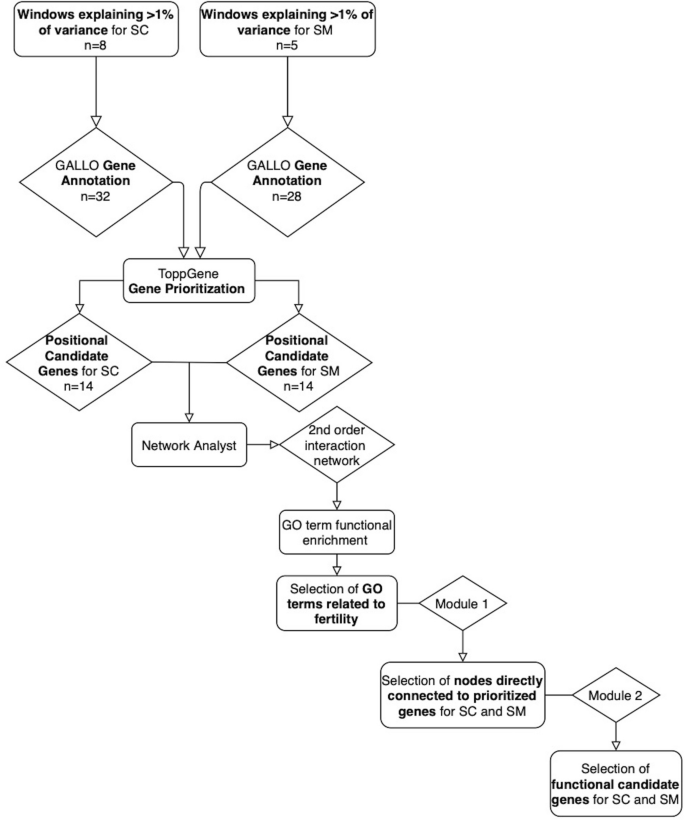
Graphical representation of the functional analyses performed to identify the positional candidate genes with additional functional evidence for scrotal circumference and sperm motility.
Discussion
The ability to identify cattle with greater reproductive performance would significantly improve the efficiency of the beef cattle industry. Thus, the discovery of genetic markers related to male fertility through GWAS can contribute to the evaluation of fertility traits, such as SC and SM, and their implications on male fertility. Spermatic related traits, including SM are commonly measured in dairy cattle where semen is widely used for artificial insemination and measuring semen parameters is a standard practice15,21,24,25,26,27. However, SM measurements are much less common in the beef industry where natural breeding is often used, which can be seen in our sample size. Testicular related traits, including SC have higher heritability values and correlations with fertility traits, although the majority of studies on SC have been on purebred bulls18,21,28,29,30,31,32. Few SC GWAS have been conducted in crossbred beef cattle26,33, which represents a significant proportion of the beef industry20. To the best of our knowledge, this is the first study that uses a GWAS to analyze both SC and SM measurements, simultaneously in Canadian crossbred beef cattle. The sample size in the present study (265) might result in a careful interpretation of the obtained results, however many other GWAS have obtained notable results with similar sample sizes, ranging from 41 to 69215,18,23,24,25,26,27. For example, Hering et al.15 conducted a GWAS on 41 bulls with very poor SM and 279 bulls with excellent SM and identified nine candidate genes all with a strong relationship to sperm function. Buzanskas et al.26. used SC records on 392 bulls in a GWAS and identified the STATU2 gene which participates in multiple biological processes, including reproduction, developmental and immune systems. When taken together, the limited studies conducted in crossbred beef cattle, the high heritability of SC and SM, and the evaluation of these traits together results in a study that can bring new considerations for the current stage of the literature regarding male fertility traits in beef cattle.
The ssGBLUP method is based on an infinitesimal model and thus assumes equal variance for all SNP effects, posing an unrealistic situation for traits of economic interest, such as fertility34. Therefore, a weighted ssGBLUP (WssGBLUP) approached was used that combines pedigree, phenotype, and genotype data with the integration of different weights for markers in an iterative process to update SNP solutions. For SC, 8 windows, located on BTA9, BTA10, BTA24, and BTA29, explained more than 13.19% of the total genetic variance. For SM, 5 windows explained more than 7.17% of the genetic variance and were located on BTA9, BTA13, BTA20, and BTA24. Of these, BTA9 explained the highest proportion of the variance for SC (4.03%) and SM (2.76%), respectively. Chromosome-wise and genome-wise associations have previously been identified in BTA9 for SC at 420 days in Canchim beef cattle26. Moreover, a region on BTA9 in Nellore cattle was found to be associated with testicular hypoplasia, which is defined by a reduced size of both testicles, and consequently reduced scrotal circumference and sperm physiology35.
Of the 14 prioritized candidate genes identified for SC (SASH1, VIP, FBX05, MTRF1L, RGS17, SLC24A5, SEMA6D, MAP3K1, SRPRA, TIRAP, DCPS, ST3GAL4, KIRREL3, CDON), two, MAP3K1 and VIP, were previously reported as related to male reproduction. Mitogen-activated protein kinase kinase kinase 1 (MAP3K1), was mapped within a window that explained 1% of the variance in SM (BTA20: 22.18–23.18 Mb) and was of interest for its anti- and pro-apoptotic functions in germ cells36. Guan et al.37 found the MAP3K1 gene was differentially expressed in testis from underfed and well-fed sexually mature sheep, indicating it could be a marker of germ cell apoptosis and therefore change SC and the efficiency of sperm production. The vasoactive intestinal peptide (VIP; BTA9: 89.51–90.51 Mb window), another prioritized candidate gene mapped within a window for SC that explained 1.61% of the variance, is known to act directly on the testis, promoting the production of testosterone in mice and rats38,39. In a study conducted by Lacombe et al.39, VIP null male mice exhibited a reduction in circulating concentrations of testosterone and follicle stimulating hormone (FSH), inhibiting the morphology of testicular seminiferous tubules. This gene has also been found to play a role in mammalian folliculogenesis, ovarian development, and puberty5,40,41.
Five of the prioritized candidate genes for SM have also been previously identified as candidate genes in the regulation of male fertility. These include, superoxide dismutase 2, T-complex protein 1, parkin co-regulated gene, sperm flagella 2 gene, and prolactin receptor (SOD2, TCP1, PACRG, SPEF2, PRLR). One of the main causes of sperm chromatin damage is through oxidative stress caused by an imbalance between reactive oxygen species and scavenger systems42. Superoxide dismutase isoenzymes, like SOD2 (BTA9: 95.18–96.18 Mb window), destroy these toxic superoxide radicals that are normally produced within cells43. They have been found to be highly expressed in mammalian semen and their activity is positively associated with sperm concentration and motility44,45. Another gene found to be associated with spermatogenesis is TCP1 (BTA9: 95.18–96.18 Mb window), a member of the cytosolic chaperonin-containing TCP1 complex46, which has been identified in the cytosolic fraction47 and plasma membrane 48 of bovine spermatozoa. The PACRG and SPEF2 genes are essential for the development of normal sperm and male fertility. Previous studies involving PACRG (BTA9: 97.25–98.24 Mb window) knockdown in mice have discovered it plays a vital role in maintaining the functional stability of flagella indicating an important relation to sperm motility49,50. Moreover, Guo et al.51 discovered SPEF2 (BTA20: 38.08–39.08 window) gene expression in the testes and sperm is regulated by alternative splicing and is thus, one of the determining factors of sperm motility. Lastly, PRLR (BTA20: 38.08–39.08 window) gene expression was identified in the bovine reproductive tract including, the testis, epididymis, spermatogonia, and differentiating germ cells, leading researchers to believe it may have an effect on spermatogenesis52. This gene was also found to play a role in fertilization and survival rates through SNP-SNP interactions53.
Five of the prioritized candidate genes for SC and SM have also been identified as playing important roles in the regulation of female fertility. Such genes include, semaphorin 6D, SRP receptor alpha subunit, Kirre like nephrin family adhesion molecule 3, acetyl-CoA Acetyltransferase 2, and proto-oncogene, G protein-coupled receptor (SEMA6D, SRPRA, KIRREL3, ACAT2, MAS1). Both SEMA6D (BTA10: 22.10–63.21 Mb) and SRPRA (BTA29: 29.35–30.35 Mb window) are expressed in the human female genital tract, with SEMA6D linked to known gonadal genes54 and SRPRA upregulated during pregnancy and involved in the transport of secretory and membrane proteins55. On the other hand, the KIRREL3 (BTA29: 29.35–30.35 Mb window), ACAT2 (BTA9: 95.18–96.18 Mb window), and MAS1 (BTA9: 95.18–96.18 Mb window) genes have been previously studied in bovine. The KIRREL3 gene was found to be highly expressed in granulosa cells and may act as a metabolic messenger linking metabolism, body composition and fertility56. The ACAT2 gene was associated with both daughter pregnancy rate and cow conception rate57, and MAS1 gene has been suggested to play a role in the regulation of ovulation58. Therefore, despite these genes being identified as prioritized candidate genes regulating male fertility traits, SC and SM, they also play a role in female fertility and regulation.
Through functional analysis, three modules were created with the prioritized candidate genes for SC and SM for the GO:BP, GO:MF, and GO:CC terms related to male fertility and reproduction. Even though nine GO:BP in the module (created via selection of the GO terms related to reproductive processes and the prioritized candidate genes for SC and SM) were related to male fertility and reproduction, due to the few genes contained in the network, only one or two genes were associated with these BPs, thus, none of the terms were significantly enriched. Despite this, it is worthy to highlight the most notable BPs in this network: regulation of MAPK cascade, spermatid differentiation, and regulation of hormone secretion. The MAPK cascade regulates spermatogenesis, sperm maturation, and the acrosome reaction, thereby playing an important role in male reproductive processes59. One of the genes involved in the regulation of MAPK cascade is the T-complex protein 1 subunit alpha, TCP1, a prioritized candidate gene for SM and is involved in the assembly of actin and tubulin filaments60. Actin filaments are present in mammalian germ cells and are involved in a number of changes that occur during spermatogenesis such as, the determination of cell shape, motility, maturation of spermatozoa, and capacitation61. In particular, actin proteins change their distribution in the sperm head during maturation and control the balance between globular actin and fibrous actin61. Another GO:BP, spermatid differentiation, is also an important part of spermatogenesis that involves the differentiation of spermatids into mature spermatozoa in the seminiferous tubules62. The prolactin receptor, a SM prioritized candidate gene, was found to be directly linked with spermatid differentiation. Moreover, spermatogenesis and reproductive success is completely dependent on the secretion of various hormones, including FSH, androgen, and testosterone. For example, testosterone levels and SC in bulls are known to be correlated, with peak testosterone levels being lower in bulls with smaller SC63. Six of the significant GO:MF were related to male fertility and reproduction, including acetyltransferase activity, zinc ion binding, lipase activity, endonuclease activity, nuclease activity, and cation channel activity. Acetyltransferases, specifically, histone acetyltransferases, act during spermatogenesis through the differentiation of spermatocytes64. Zinc is incorporated into spermatozoa where it is bound by seminal fluid Zn-interacting proteins and plays a protective role for sperm chromatin decondensation and sperm motility65. Moreover, a number of cation channels, including potassium and chloride channels, are involved in sperm motility, maturation, and the acrosome reaction66. Three of the significant GO:CC terms were related to male fertility and reproduction, including, kinesin complex, spindle microtubule and cytosol. A number of kinesin families play key roles in mammalian spermatogenesis, including mitosis, meiosis, acrosome biogenesis, and tail formation67. Moreover, kinesins, specifically kinesin-13 s, regulate the spindle microtubule dynamics and control spindle assembly and kinetochore-microtubule attachments67. One example of the importance of the cytosol in male fertility is the cytosolic fraction of bovine spermatozoa, which exhibits tyrosine kinase activity associated with sperm capacitation and acrosome reaction47. The GO:BP term spindle microtubule contained the TIRAP and RGS17 genes which are prioritized candidate genes for SC and PRLR, a prioritized candidate gene for SM, indicating that these genes could be important biomarkers of bovine fertility.
The QTL annotation revealed reproduction QTLs account for 7.85% and 8.11% of the QTLs annotated in the windows explaining > 1% of the total genetic variance for SC and SM, respectively. These reproduction QTLs included, reproductive efficiency, age at first calving, calving ease, daughter pregnancy rate, interval from first to last insemination, fertility index, conception rate, and interval to first estrus after calving. The largest proportion of QTLs in this study were related to milk production for both SC and SM (31.94% and 54.05%, respectively). A QTL enrichment analysis was conducted as the simple bias of investigation in the QTL database for cattle can result in a larger proportion of records in the database. The enrichment analysis for the windows explaining > 1% of the total genetic variance for SC and SM revealed QTLs annotated for exterior conformation traits, including five different body depth, three different feet and leg conformation, five different strength, and five different stature QTLs annotated within the candidate windows for SC, and three different stature QTLs and three different body weight gain QTLs annotated within the candidate windows for SM (Table 2; Table S5). In a study conducted by Schenkel et al.68, SC was found to be genetically correlated (P < 0.05) to average daily gain, ultrasound backfat thickness, mid-test metabolic weight and hip height in 13,151 bulls (rg = 0.24, 0.19, 0.31, 0.16, respectively). Another study revealed a positive correlation for SC and body weight in both pubertal and post-pubertal Holstein bulls (rg = 0.76 and 0.45, respectively69). Therefore, bulls with larger SC have a larger body size and faster growth68,69,70. This suggests that these regions may be regulating both fertility and conformation traits, however the biological mechanisms associated with this correlation is not well understood6,71,72. Other enriched QTLs for SC included udder depth, udder attachment, teat placement-rear, and udder cleft (Table 2; Table S5). Cows with tightly attached udders and proper teats tend to remain in a herd longer, are easier to nurse, and less susceptible to mastitis, therefore udder traits may be used in conjunction with body conformation traits for the indirect selection of longevity in beef cattle73,74. The QTL enrichment analysis for SM also revealed QTLs related to fertility on BTA9, one for daughter pregnancy rate and two different QTLs for interval to first estrus after calving (Table 2; Table S5). This is consistent with other studies that reveal a genetic correlation between male and female fertility traits. For example, Johnston et al. 75 found SM at 18 months of age to be highly correlated with female reproduction traits in Brahman and Tropical Composite cows, such as conception (0.53 and 0.72, respectively) and pregnancy rate (0.58 and 0.95, respectively). Gargantini et al.76 identified a genetic correlation between yearling SC and age at puberty and pregnancy rate in heifers was − 0.57 and 0.35, respectively. Thus, BTA9 may be a candidate region for bovine fertility. A study conducted by McClure et al.77 identified 41 SC QTLs in Angus cattle, of which three QTLs were identified on BTA9. The overlap between the candidate regions identified in the present study and previous studies reinforces the association of these genomic regions with the regulation of genes and biological processes responsible for male fertility traits, including VIP and SOD2 genes, mapped on BTA9, and the regulation of MAPK cascade and spermatid differentiation.
To conclude, functional analysis for the prioritized candidate genes identified in this study revealed significant GO terms associated with biological processes and molecular functions related to male fertility and reproduction. For scrotal circumference, both MAP3K1 and VIP identified genes control testis function and could be used as potential biomarkers of spermatogenesis and apoptosis. For sperm motility, the SOD2, TCP1, PACRG, SPEF2, and PRLR genes were related to sperm concentration, development, and motility. These results help to better understand the genetic bases of scrotal circumference and sperm motility specifically in crossbred beef bulls and revealed positional candidate genes with additional functional evidence that might ultimately improve bull genomic prediction for these traits. Moreover, these candidate regions, specifically those mapped on BTA9, have known genetic correlations to other economically important traits including, conformation, female fertility, and udder structure. However, future research on these candidate genes and their impact on bull fertility is warranted.
Materials and methods
Population structure and phenotypic data
Data used in this study are from animals cared for under protocols approved by the University of Guelph Animal Care Committee, which follows guidelines of the Canadian Council on Animal Care (1993).
The population for this study came from the Ontario Beef Research Centre; the University of Guelph research farm located in Elora, ON, Canada and consisted of 265 crossbred bulls. At the time of collection, bulls had an average age of 384 days and average weight of 555 kg. The predominant breeds (and corresponding average composition of that breed in the test group, see Table S1) of these crossbred bulls were Angus (AN: 52%), Simmental (SM: 24%), Piedmontese (PI: 6.6%), Gelbvieh (GV: 6.3%), Charolais (CH: 3.8%), and Limousine (LM: 1.1%).
The fertility traits used in this study were SC and SM. Scrotal circumference was measured by palpating the testes into the lower half of the scrotum and measuring the greatest circumference using a looped tape as described by Awada et al.19. Semen ejaculates were collected between 12 and 15 months of age immediately after the SC measurement using electroejaculation (Pulsator IV- Auto Adjust Electro-Ejaculator: Lane Manufacturing, Inc, Denver, CO). Sperm motility was visually estimated immediately and ejaculates were then extended, cooled, placed in liquid nitrogen and thawed as previously described by Pursel & Johnson78. Sperm motility was assessed as described by Awada et al.79. Briefly, sperm were evaluated on the CASA (Integrated Visual Optical System (IVOS) CASA System, Hamilton Thorne, Inc., Beverly, MA) sampled from 1 × 10⁷ spermatozoa/ml in BTS78 and a four-chamber standard count analysis slide (Leja products B.V. Luzernestraat 10, 2153 GN Nieuw-Vennep, The Netherlands), at 37 °C.
Genotyping and quality control
Genotyping was completed from 265 animals using the Affymetrix Genechip Bovine Genome High Density Array, which included 648,874 SNPs. Marker coordinates were converted to the new bovine genome assembly ARS-UCD 1.2. Quality control was performed using Plink80 and the following criteria were used for the exclusion of SNPs: non-autosomal regions; minor allele frequency < 0.05; and a call rate < 95%.
Genome-wide association study
The programs of BLUPF90 family were used for the weighted single-step genomic BLUP (WssGBLUP) analysis81. The GWAS results were reported as the proportion of the variance explained by non-overlapping genomic windows of 1 Mb82.
A WssGBLUP method was used to estimate SNP effects. The observed phenotypes of SC and SM were used as dependent variables in a single-trait animal model:
where y represented a vector of observed phenotypes for animals (SC or SM); X is the incidence matrix of fixed effects; b is the vector of fixed effects, Za is the incidence matrix of additive genetic effects; a is the random vector of additive genetic effects; and e is the vector of residual effects. Fixed effects for SC included 25 levels of herd-year-season (HYS), body weight, age as a third-degree polynomial, and breed composition for the most prevalent breeds (AN, SM, PI, GV, CH, and LM). Fixed effects for SM included 25 levels of HYS, age, and breed composition for the most prevalent breeds.
The solutions of the SNP effects (û) were obtained using the AIREMLF9081 algorithm with two iterations, as proposed by Wang et al.34.
For each iteration of the algorithm D(n) = I and G(n) = ZD(n)Z’λ, where D is a diagonal matrix of weights for SNP variances, G is the weighted genomic relationship matrix, Z is a matrix relating genotypes of each locus, λ is a variance ratio, and n is the iteration number; the breeding values (âv) were calculated using single-step genomic best linear unbiased predictor (ssGBLUP); SNP effects were calculated via û(n) = λD(n)Z′G(n)−1âv; SNP weights were calculated via di(n+1) = û2i(n)2pi(1 − pi), where i is the ith SNP; the weights were normalized via D(n+1)\({ } = \frac{{tr(D_{\left( 0 \right)} )}}{{tr(D_{{\left( {n + 1} \right)}} )}}\) D(n+1) so the additive genetic variance remains constant; and the Genomic matrix was recalculated via G(n+1) = ZD( n+1)Z’λ to obtain the SNP effects. These iterations were used to calculate the proportion of variance explained by non-overlapping windows.
The proportion of variance explained by non-overlapping windows were estimated using the PostGSf90 algorithm by summing the variance of SNPs within 1 Mb82. Windows that explained greater than 1% of the genetic variance for SC and SM were selected for QTL and gene annotation83, conducted using R (Version 4.0.0.; R Core Team, 2020) and the R package: Genomic Annotation in Livestock for positional candidate LOci (GALLO—https://github.com/pablobio/GALLO). The .gtf annotation file corresponding to the bovine gene annotation from ARS-UCD1.2 assembly and the .gff file with the QTL information from Animal QTL Database84, using the same reference genome (ARS-UCD1.2) to map the QTLs, were used for gene and QTL annotation, respectively. A QTL enrichment analysis was also conducted using the GALLO R package for all the QTL information annotated within the candidate windows using a chromosome-based enrichment analysis. Briefly, a bootstrap approach was used to compare the observed number of QTL for each trait in each chromosome annotated using GALLO with the expected number for each trait estimated using 1000 iteration rounds of random sampling from the whole Cattle QTLdb. Using this approach, a p value for the QTL enrichment status of each annotated trait within the candidate windows was calculated, Additionally, the p values were corrected for multiple testing using FDR (5%).
Gene prioritization analysis
Functional candidate gene prioritization was conducted using the ToppGene Suite85. A trained list of genes associated with keywords outlined by Fonseca et al. 21 using the GUILDify86 software and a species-specific (Homo sapiens) interaction network, including, “scrotal circumference,” “scrotal,” “testicular,” “testis,” “testes,” “sperm,” “semen,” “spermatozoa,” “spermatogenesis,” and “fertility,” made up the “trained list” of genes. From this analysis, the top 100 genes ranked using an algorithm based on network topology on GUILDify were used to create the “trained” gene list. This “trained” gene list was used in conjunction with the “test” gene list containing the genes within windows explaining greater than 1% of the genetic variance for SC and SM. An annotation-based prioritization analysis through a multivariate approach was conducted using ToppGene. Gene Ontology terms for molecular function (MF), biological process (BP), and cellular component (CC); human and mouse phenotypes; metabolic pathways; Pubmed publications; and diseases were utilized to retrieve functional information for the trained list and for the list of positional candidate genes (those genes annotated within windows explaining more than 1% of the genetic variance for the trait). Overall p values were obtained using a combination of the p values obtained from the intermediate values from the above functional information using a random sampling of 5000 genes from the whole genome for each annotation information. Significant prioritized genes were selected based on a FDR 5% multiple correction, meaning these genes have a functional profile that is significantly similar to the functional profile of the “trained” gene list. As the “trained” gene list is known to be associated with fertility, by the guilty by association principle, it is probable that the prioritized genes will also be associated with fertility.
Functional analysis
A protein–protein interaction network analysis was performed in order to identify interactions between the positional candidate genes and other genes in the genome that are relevant to fertility. Therefore, the prioritized candidate genes for both SC and SM were inputted together into NetworkAnalyst 3.0 (87 https://www.networkanalyst.ca) and the STRING interactome protein–protein interaction database was used with a confidence score cutoff of 900. A second-order interaction network was generated containing 1442 nodes (genes) with 4888 edges. Then, gene ontology (GO) enrichment analyses, including the three main categories biological process (BP), molecular functions (MF), and cellular components (CC), was performed using the genes comprising the network88. Functional evidence of the relationship between the significant GO terms (FDR-corrected p value ≤ 0.05) and the target phenotypes (SC and SM) was identified. The GO terms related to reproductive processes were selected to extract the first module from this network composed only by the nodes (genes) associated with the selected GO:BP, GO:MF and GO:CC. Next, a second module was extracted, from the previous sub-network. This second module was composed only by the positional prioritized candidate genes for SC and SM and its direct connected nodes. The GO:BP, GO:MF and GO:CC enriched for this second module were analyzed for its association with reproductive processes.
Abbreviations
- ssGBLUP:
-
Single-step genomic BLUP
- WssGBLUP:
-
Weighted single-step genomic BLUP
- SC:
-
Scrotal circumference
- SM:
-
Sperm motility
- FDR:
-
False discovery rate
- AN:
-
Angus
- SM:
-
Simmental
- PI:
-
Piedmontese
- GV:
-
Gelbvieh
- CH:
-
Charolais
- LM:
-
Limousine
- HYS:
-
Herd-year-season
- GALLO:
-
Genomic Annotation in Livestock for positional candidate LOci
- MF:
-
Molecular function
- BP:
-
Biological process
- CC:
-
Cellular component
- MAP3K1:
-
Mitogen-activated protein kinase kinase kinase 1
- VIP:
-
Vasoactive intestinal peptide
- FSH:
-
Follicle stimulating hormone
- SOD2:
-
Superoxide dismutase 2
- TCP1:
-
T-complex protein 1
- PACRG:
-
Parkin co-regulated gene
- SPEF2:
-
Sperm flagella 2 gene
- PRLR:
-
Prolactin receptor
- SEMA6D:
-
Semaphorin 6D
- SRPRA:
-
SRP receptor alpha subunit
- KIRREL3:
-
Kirre like nephrin family adhesion molecule 3
- ACAT2:
-
Acetyl-CoA Acetyltransferase 2
- MAS1:
-
Proto-oncogene, G protein-coupled receptor
- TCP1:
-
T-complex protein 1 subunit alpha
References
Cerri, C. C. et al. Assessing the carbon footprint of beef cattle in Brazil: a case study with 22 farms in the State of Mato Grosso. J. Clean Prod. 112, 2593–2600. https://doi.org/10.1016/j.jclepro.2015.10.072 (2016).
Revell, B.J. One man’s meat...2050? Ruminations on future meat demand in the context of global warming. J. Agric. Econ. 66, 573–614. https://doi.org/10.1111/1477-9552.12121 (2015).
Thundathil, J. C., Dance, A. L. & Kastelic, J. P. Fertility management of bulls to improve beef cattle productivity. Theriogenology 86, 397–405. https://doi.org/10.1016/j.theriogenology.2016.04.054 (2016).
Nguyen, L. T. et al. STAT6, PBX2, and PBRM1 emerge as predicted regulators of 452 differentially expressed genes associated with puberty in Brahman heifers. Front. Genet. https://doi.org/10.3389/fgene.2018.00087 (2018).
Cánovas, A. et al. Multi-tissue omics analyses reveal molecular regulatory networks for puberty in composite beef cattle. PLoS ONE https://doi.org/10.1371/journal.pone.0102551 (2014).
Fonseca, P. A. S. et al. Combining multi-OMICs information to identify key-regulator genes for pleiotropic effect on fertility and production traits in beef cattle. PLoS ONE https://doi.org/10.1371/journal.pone.0205295 (2018).
Rauw, W., Kanis, E., Noordhuizen-Stassen, E. & Grommers, F. Undesirable side effects of selection for high production efficiency in farm animals: a review. Livest. Prod. Sci. 56, 15–33. https://doi.org/10.1016/S0301-6226(98)00147-X (1998).
de Camargo, G. M. et al. Non-synonymous mutations mapped to chromosome X associated with andrological and growth traits in beef cattle. BMC Genomics 16, 384. https://doi.org/10.1186/s12864-015-1595-0 (2015).
Dias, M. M. et al. SNP detection using RNA-sequences of candidate genes associated with puberty in cattle. Genet. Mol. Res. https://doi.org/10.4238/gmr16019522 (2017).
Ortega, M. S., Denicol, A. C., Cole, J. B., Null, D. J. & Hansen, P. J. Use of single nucleotide polymorphisms in candidate genes associated with daughter pregnancy rate for prediction of genetic merit for reproduction in Holstein cows. Anim. Genet. 47, 288–297. https://doi.org/10.1111/age.12420 (2016).
Berry, D. P., Wall, E. & Pryce, J. E. Genetics and genomics of reproductive performance in dairy and beef cattle. Animal 8, 105–121. https://doi.org/10.1017/S1751731114000743 (2014).
Suchoocki, T. & Szyda, J. Genome-wide association study for semen production traits in Holstein-Friesian bulls. J. Dairy Sci. 98, 5774–5780. https://doi.org/10.3168/jds.2014-8951 (2015).
Han, Y. & Peñagaricano, F. Unravelling the genomic architecture of bull fertility in Holstein cattle. BMC Genet. 17, 143. https://doi.org/10.1186/s12863-016-0454-6 (2016)
Druet, T. et al. Estimation of genetic parameters and genome scan for 15 semen characteristics traits of Holstein bulls. J. Anim. Breed. Genet. 126, 269–277. https://doi.org/10.1111/j.1439-0388.2008.00788.x (2009).
Hering, D. M., Oleński, K. & Kaminski, S. Genome-wide association study for poor sperm motility in Holstein-Friesian bulls. Anim. Reprod. Sci. 146, 3–4. https://doi.org/10.1016/j.anireprosci.2014.01.012 (2014).
Al-Kanaan, A., König, S. & Brügemann, K. Effects of heat stress on semen characteristics of Holstein bulls estimated on a continuous phenotypic and genetic scale. Livest. Sci. 177, 15–24. https://doi.org/10.1016/j.livsci.2015.04.003 (2015).
Wang, Z. et al. Impact of selection for residual feed intake on breeding soundness and reproductive performance of bulls on pasture-based multisire mating. J. Anim. Sci. 90, 2963–2969. https://doi.org/10.2527/jas.2011-4521 (2012).
Gipson, T. A., Vogt, D. W., Massey, J. W. & Ellersieck, M. R. Associations of scrotal circumference with semen traits in young beef bulls. Theriogenology 24, 217–225. https://doi.org/10.1016/0093-691X(85)90186-4 (1985).
Awda, B. J. et al. The relationship between feed efficiency traits and fertility in young beef bulls. Can. J. Anim. Sci. 93, 185–192. https://doi.org/10.4141/cjas2012-092 (2012).
Lu, D. et al. Genome-wide association analyses for growth and feed efficiency traits in beef cattle. J. Anim. Sci. 91, 3612–3633. https://doi.org/10.2527/jas.2012-5716 (2013).
Fonseca, P. A. S. et al. Genetic mechanisms underlying spermatic and testicular traits within and among cattle breeds: systematic review and prioritization of GWAS results. J. Anim. Sci. 96, 4978–4999. https://doi.org/10.1093/jas/sky382 (2018).
Dalton, J.C. Semen quality factors associated with fertility. In Proceedings of Applied Reproductive Strategies in Beef Cattle—Northwest. 265–281 (2011).
Hering, D. M., Oleński, K. & Kaminski, S. Genome-wide association study for sperm concentration in Holstein-Friesian bulls. Reprod. Domest. Anim. 49, 1008–1014. https://doi.org/10.1111/rda.12423 (2014).
Kamiński, S., Hering, D. M., Oleński, K., Lecewicz, M. & Kordan, W. Genome-wide association study for sperm membrane integrity in frozen-thawed semen of Holstein-Friesian bulls. Anim. Reprod. Sci. 170, 135–140. https://doi.org/10.1016/j.anireprosci.2016.05.002 (2016).
Puglisi, R. et al. Genome wide analysis for bull sperm quality and fertility traits. Reprod. Domest. Anim. 51, 840–843. https://doi.org/10.1111/rda.12747 (2016).
Buzanskas, M. E. et al. Candidate genes for male and female reproductive traits in Canchim beef cattle. J. Anim. Sci. Biotechno. https://doi.org/10.1186/s40104-017-0199-8 (2017).
Qin, C. et al. Genome-wide association study for semen traits of the bulls in Chinese Holstein. Anim. Genet. 48, 80–84. https://doi.org/10.1111/age.12433 (2017).
Fortes, M. R., Reverter, A., Hawken, R. J., Bolormaa, S. & Lehnert, S. A. Candidate genes associated with testicular development, sperm quality, and hormone levels of inhibin, luteinizing hormone, and insulin-like growth factor 1 in Brahman bulls. Biol. Reprod. 87, 58. https://doi.org/10.1095/biolreprod.112.101089 (2012).
Utsunomiya, Y. T. et al. Genome-wide mapping of loci explaining variance in scrotal circumference in Nellore cattle. PLoS ONE 9, e88561. https://doi.org/10.1371/journal.pone.0088561 (2014).
Irano, N. et al. Genome-wide association study for indicator traits of sexual precocity in Nellore cattle. PLoS ONE 11, e0159502. https://doi.org/10.1371/journal.pone.0159502 (2016).
Soares, A. C. C. et al. Multiple-trait genomewide mapping and gene network analysis for scrotal circumference growth curves in Brahman cattle. J. Anim. Sci. 95, 3331–3345. https://doi.org/10.2527/jas.2017.1409 (2017).
Menegassi, S. R. O. et al. Evaluation and prediction of scrotal circumference in beef bulls. Theriogenology 140, 25–32. https://doi.org/10.1016/j.theriogenology.2019.08.008 (2019).
Fortes, M. R. et al. Genomic regions associated with fertility traits in male and female cattle: advances from microsatellites to high-density chips and beyond. Anim. Reprod. Sci. 141, 1–19. https://doi.org/10.1016/j.anireprosci.2013.07.002 (2013).
Wang, H., Misztal, I., Aguilar, I., Legarra, A. & Muir, W. M. Genome-wide association mapping including phenotypes from relatives without genotypes. Genet. Res. Camb. Core 94, 73–83. https://doi.org/10.1017/S0016672312000274 (2012).
Neves, H. H. R. et al. Genetic and genomic analysis of testicular hypoplasis in Nellore cattle. PLoS ONE https://doi.org/10.1371/journal.pone.0211159 (2019).
Pham, T. T., Angus, S. P. & Johnson, G. L. MAP3K1: Genomic alterations in cancer and function in promoting cell survival or apoptosis. Genes Cancer 4, 419–426. https://doi.org/10.1177/1947601913513950 (2013).
Guan, Y., Liang, G. & Martin, G. B. Functional changes in mRNA expression and alternative pre-mRNA splicing associated with effects of nutrition on apoptosis and spermatogenesis in the adult testis. BMC Genet. 18, 64. https://doi.org/10.1186/s12864-016-3385-8 (2017).
El-Gehani, F., Tena-Sempere, M. & Huhtaniemi, I. Vasoactive intestinal peptide stimulates testosterone production by cultured fetal rat testicular cells. Mol. Cell. Endocrinol. 140, 175–178. https://doi.org/10.1016/S0303-7207(98)00047-1 (1998).
Lacombe, A. et al. Lack of vasoactive intestinal peptide reduces testosterone levels and reproductive aging in mouse testis. J. Endocrinol. 194, 153–160. https://doi.org/10.1677/JOE-07-0102 (2007).
Gabbay-Benziv, R. et al. Vasoactive intestinal peptide and its receptors in human ovarian cortical follicles. PLoS ONE https://doi.org/10.1371/journal.pone.0037015 (2012).
Chen, N. et al. Vasoactive intestinal peptide can promote the development of neonatal rat primordial follicles during in vitro culture. Biol. Reprod. 88, 1–8. https://doi.org/10.1095/biolreprod.111.098335 (2013).
Simōes, R. et al. Influence of bovine sperm DNA fragmentation and oxidative stress on early embryo in vitro development outcome. Reprod. 146, 433–441. https://doi.org/10.1530/REP-13-0123 (2013).
Peeker, R., Abramsson, L. & Marklund, S. L. Superoxide dismutase isoenzymes in human seminal plasma and spermatozoa. Mol. Hum. Reprod. 3, 1061–1066. https://doi.org/10.1093/molehr/3.12.1061 (1997).
Yan, L. et al. Seminal superoxide dismutase activity and its relationship with semen quality and SOD gene polymorphism. J. Assist. Reprod. Genetics 31, 549–554. https://doi.org/10.1007/s10815-014-0215-2 (2014).
Yu, B. & Huang, Z. Variations in antioxidant genes and male infertility. BioMed Res. Int. https://doi.org/10.1155/2015/513196 (2015).
Lalancette, C., Thibault, C., Bachand, I., Caron, N. & Bissonnette, N. Transcriptome analysis of bull semen with extreme nonreturn rate: Use of suppression-subtractive hybridization to identify functional markers for fertility. Biol. Reprod. 78, 618–635. https://doi.org/10.1095/biolreprod.106.059030 (2008).
Lalancette, C., Faure, R. L. & Leclerc, P. Identification of the proteins present in the bull sperm cytosolic fraction enriched in tyrosine kinase activity: a proteomic approach. Proteomics 6, 4523–4540. https://doi.org/10.1002/pmic.200500578 (2006).
Byrne, K., Leahy, T., McCulloch, R., Colgrave, M. L. & Holland, M. K. Comprehensive mapping of the bull sperm surface proteome. Proteomics 12, 23–24. https://doi.org/10.1002/pmic.201200133 (2012).
Dawe, H. R., Farr, H., Portman, N., Shaw, M. K. & Gull, K. The Parkin co-regulated gene product, PACRG, is an evolutionarily conserved axonemal protein that functions in outer-doublet microtubule morphogenesis. J. Cell Sci. 118, 5421–5430. https://doi.org/10.1242/jcs.02659 (2005).
Lehti, M. S. & Sironen, A. Formation and function of sperm tail structures in association with sperm motility defects. Biol. Reprod. 97, 522–536. https://doi.org/10.1093/biolre/iox096 (2017).
Guo, F. et al. Alternative splicing, promotor, methylation, and functional SNPs of sperm flagella 2 gene in testis and mature spermatozoa of Holstein bulls. Reprod. 147, 241–252. https://doi.org/10.1530/REP-13-0343 (2014).
Pratt, S. L. et al. Identification of bovine prolactin in seminal fluid, and expression and localization of the prolactin receptor and prolactin-inducible protein in the testis and epididymis of bulls exposed to ergot alkaloids. Theriogenology https://doi.org/10.1016/j.theriogenology.2014.10.031 (2014).
Huang, W., Mikhail, D., Bindrim, A. C. & Khatib, H. Interactions of the bovine placental lactogen and prolactin receptor genes are associated with fertility traits in cattle. Anim. 3, 1743–1745. https://doi.org/10.1017/S1751731109990826 (2009).
Jaillard, S. et al. Array-CGH diagnosis in ovarian failure: identification of new molecular actors for ovarian physiology. J. Ovarian Res. https://doi.org/10.1186/s13048-016-0272-5 (2016).
Whittington, C. M. et al. Transcriptomic changes in the pre-implantation uterus highlight histotrophic nutrition of the developing marsupial embryo. Sci. Rep. https://doi.org/10.1038/s41598-018-20744-z (2018).
Coyral-Castel, S. et al. KIRREL is differentially expressed in adipose tissue from ‘fertil+’ and ‘fertil−’ cows: in vitro role in ovary?. Reprod. 155, 181–196. https://doi.org/10.1530/REP-17-0649 (2018).
Cochran, S. D., Cole, J. B., Null, D. J. & Hansen, P. J. Discovery of single nucleotide polymorphisms in candidate genes associated with fertility and production traits in Holstein cattle. BMC Genet. https://doi.org/10.1186/1471-2156-14-49 (2013).
Tonellotto dos Santos, J. et al. Molecular characterization and regulation of the angiotensin-converting enzyme type 2/Angiotensin-(1–7)/MAS receptor axis during the ovulation process in cattle. J. Renin-Angio-Aldo. S. 13, 91–98. https://doi.org/10.1177/1470320311417273(2011).
Li, M. W. M., Mruk, D. D. & Cheng, C. Y. Mitogen-activated protein kinases in male reproductive function. Trends Mol. Med. 15, 159–168. https://doi.org/10.1016/j.molmed.2009.02.002 (2009).
Dun, M. D., Aitken, R. J. & Nixon, B. The role of molecular chaperons in spermatogenesis and the post-testicular maturation of mammalian spermatozoa. Hum. Reprod. Update 18, 420–435. https://doi.org/10.1093/humupd/dms009 (2012).
Howes, E. A., Hurst, S. M. & Jones, R. Actin and actin-binding proteins in bovine spermatozoa: Potential role in membrane remodeling and intracellular signaling during epididymal maturation and the acrosome reaction. J. Androl. 22, 62–72 (2001).
Staub, C. & Johnson, L. Review: Spematogensis in the bull. Animal 12, 27–35. https://doi.org/10.1017/S1751731118000435 (2018).
Palasz, A. T., Cates, W. F., Barth, A. D. & Mapletoft, R. J. The relationship between scrotal circumference and quantitative testicular traits in yearling beef bulls. Theriogenology 42, 715–726. https://doi.org/10.1016/0093-691X(94)90388-Y (1994).
Kim, J. H., Jee, B. C., Lee, J. M., Suh, C. S. & Kim, S. H. Histone acetylation level and histone acetyltransferase/deacetylase activity in ejaculated sperm from normozoospermic men. Yonsei Med. J. 55, 1333–1340. https://doi.org/10.3349/ymj.2014.55.5.1333 (2014).
Kerns, K., Zigo, M. & Sutovsky, P. Zinc: A necessary ion for mammalian sperm fertilization competency. Int. J. Mol. Sci. 19, 4097. https://doi.org/10.3390/ijms19124097 (2018).
Santi, C. M., Orta, G., Visconti, P. E., Darszon, A. & Treviño, C. L. K+ and Cl− channels and transporters in sperm function. Curr. Top. Dev. Biol. 102, 385–421. https://doi.org/10.1016/B978-0-12-416024-8.00014-3 (2013).
Ma, D., Wang, D. & Yang, W. Kinesins in spermatogenesis. Biol. Reprod. 96, 267–276. https://doi.org/10.1095/biolreprod.116.144113 (2017).
Schenkel, F. S., Miller, S. P. & Wilton, J. W. Genetic parameters and breed differences for feed efficiency, growth, and body composition traits of young beef bulls. Can. J. Anim. Sci. 84, 177–218. https://doi.org/10.4141/A03-085 (2003).
Devkota, B. et al. Relationships among age, body weight, scrotal circumference, semen quality, and peripheral testosterone, and estradiol concentrations in pubertal and postpubertal Holstein bulls. J. Vet. Med. Sci. 70, 119–121 (2008).
Trocóniz, J. F., Beltrán, J., Bastidas, H., Larreal, H. & Bastidas, P. Testicular development, body weight changes, puberty and semen traits of growing Guzerat and Nellore bulls. Theriogenology 35, 815–826. https://doi.org/10.1016/0093-691X(91)90422-A (1991).
Bolormaa, S. et al. A multi-trait, meta-analysis for detecting pleiotropic polymorphisms for stature, fatness and reproduction in beef cattle. PloS Genet. 10, e1004198. https://doi.org/10.1371/journal.pgen.1004198 (2014).
Fonseca, P. A. S., Suárez-Vega, A. & Cánovas, A. Weighted gene correlation network meta-analysis reveals functional candidate genes associated with high-and sub-fertile reproductive performance in beef cattle. Genes 11, 543 (2020).
Paputungan, U. & Makarechian, M. The influence of dam weight, body condition and udder scores on calf birth weight and preweaning growth rates in beef cattle. Asian Austral. J. Anim. Sci. 13, 435–439. https://doi.org/10.5713/ajas.2000.435 (2000).
Devani, K., Valente, T. S., Crowley, J. J. & Orsel, K. Development of optimal genetic evaluations for teat and udder structure in Canadian Angus cattle. J. Anim. Sci. https://doi.org/10.1093/jas/skz314 (2019).
Johnston, D. J., Corbet, N. J., Barwick, S. A., Wolcott, M. L. & Holroyd, R. G. Genetic correlations of young bull reproductive traits and heifer puberty traits with female reproductive performance in two tropical beef genotypes in northern Australia. Anim. Prod. Sci. 54, 74–84. https://doi.org/10.1071/AN13044 (2014).
Gargantini, G., Cundiff, L. V., Lunstra, D. D. & Van Vleck, L. D. Genetic relationships between male and female reproductive traits in beef cattle. Prof. Anim. Sci. 21, 195–199 (2005).
McClure, M. C. et al. A genome scan for quantitative trait loci influencing carcass, post-natal growth and reproductive traits in commercial Angus cattle. Anim. Genet. 41, 597–607. https://doi.org/10.1111/j.1365-2052.2010.02063.x (2010).
Pursel, V. G. & Johnson, L. A. Freezing of boar spermatozoa: fertilizing capacity with concentrated semen and a new thawing procedure. J. Anim. Sci. 40, 99–102. https://doi.org/10.2527/jas1975.40199x (1975).
Awada, B. J., Mackenzie-Bell, M. & Buhr, M. M. Reactive oxygen boar species and boar sperm function. Biol. Reprod. 81, 553–561. https://doi.org/10.1095/biolreprod.109.076471 (2009).
Purcell, S. et al. PLINK: A tool set for whole-genome association and population-based linkage analyses. Am. J. Hum. Genet. 81, 559–575. https://doi.org/10.1086/519795 (2007).
Misztal, I. et al. BLUPF90 family of programs (2014).
de Oliveira Fragomeni, B. et al. Changes in variance explained by top SNP windows over generations for three traits in broiler chicken. Front. Genet. https://doi.org/10.3389/fgene.2014.00332 (2014).
Asselstine, V. et al. Genetic mechanisms regulating the host response during mastitis. J. Dairy Sci. 102, 9043–9059. https://doi.org/10.3168/jds.2019-16504 (2019).
Hu, Z., Park, C. A., Wu, X. & Reecy, J. M. Animal QTLdb: an improved database tool for livestock animal QTL/association data dissemination in the post-genome era. Nucleic Acids Res. 41, D871–D879. https://doi.org/10.1093/nar/gks1150 (2013).
Chen, J., Bardes, E. E., Aronow, B. J. & Jegga, A. G. Toppgene suite for gene list enrichment analysis and candidate gene prioritization. Nucleic Acids Res. 37, W305–W311. https://doi.org/10.1093/nar/gkp427 (2009).
Guney, E., Garcia-Garcia, J. & Oliva, B. Guildify: a web server for phenotypic characterization of genes through biological data integration and network-based prioritization algorithms. Bioinform. 30, 1789–1790. https://doi.org/10.1093/bioinformatics/btu092 (2014).
Xia, J., Gill, E. E. & Hancock, R. E. NetworkAnalyst for statistical, visual and network-based meta-analysis of gene expression data. Nat. Protoc. 10, 823. https://doi.org/10.1038/nprot.2015.052 (2015).
Cánovas, A. et al. Segregation of regulatory polymorphisms with effects on the gluteus medius transcriptome in a purebred pig population. PLoS ONE 7, e35583. https://doi.org/10.1371/journal.pone.0035583 (2012).
Acknowledgements
The authors acknowledge financial support from the (FDE.13.17) Sustainable Beef and Forage Science Cluster funded by the Canadian Beef Cattle Check-Off, Beef Cattle Research Council (BCRC), Alberta Beef Producers, Alberta Cattle Feeders’ Association, Beef Farmers of Ontario, La Fédération des Productuers de bovins du Québec, and Agriculture and Agri-Food Canada’s Canadian Agricultural Partnership. This study was also supported by the Ontario Ministry of Agriculture, Food, and Rural Affairs (OMAFRA), Ontario Ministry of Research and Innovation, Agriculture and Agri-Food Canada (AAFC), and Natural Sciences and Engineering Research Council of Canada (NSERC) Discovery Grant. Hannah Sweett was supported by the OMAFRA Highly Qualified Personnel Scholarship Program.
Author information
Authors and Affiliations
Contributions
A.C. was responsible for the conceptualization, experimental design, and theoretical discussions. P.A.S.F., A.S.-V., and A.L. were responsible for data curation. A.C., H.S. and P.A.S.F. conducted the GWAS, gene annotation, QTL annotation and functional analysis. A.C. was responsible for funding acquisition. All authors have read and agreed to the published version of the manuscript.
Corresponding author
Ethics declarations
Competing interests
The authors declare no competing interests.
Additional information
Publisher's note
Springer Nature remains neutral with regard to jurisdictional claims in published maps and institutional affiliations.
Rights and permissions
Open Access This article is licensed under a Creative Commons Attribution 4.0 International License, which permits use, sharing, adaptation, distribution and reproduction in any medium or format, as long as you give appropriate credit to the original author(s) and the source, provide a link to the Creative Commons licence, and indicate if changes were made. The images or other third party material in this article are included in the article's Creative Commons licence, unless indicated otherwise in a credit line to the material. If material is not included in the article's Creative Commons licence and your intended use is not permitted by statutory regulation or exceeds the permitted use, you will need to obtain permission directly from the copyright holder. To view a copy of this licence, visit http://creativecommons.org/licenses/by/4.0/.
About this article

Cite this article
Sweett, H., Fonseca, P.A.S., Suárez-Vega, A. et al. Genome-wide association study to identify genomic regions and positional candidate genes associated with male fertility in beef cattle. Sci Rep 10, 20102 (2020). https://doi.org/10.1038/s41598-020-75758-3
Received:
Accepted:
Published:
DOI: https://doi.org/10.1038/s41598-020-75758-3
This article is cited by
-
Novel lncRNA regulatory elements in milk somatic cells of Holstein dairy cows associated with mastitis
Communications Biology (2024)
-
Whole genome sequencing of simmental cattle for SNP and CNV discovery
BMC Genomics (2023)
-
Sequence level genome-wide associations for bull production and fertility traits in tropically adapted bulls
BMC Genomics (2023)
-
Correlation scan: identifying genomic regions that affect genetic correlations applied to fertility traits
BMC Genomics (2022)
-
Identification of novel alternative splicing associated with mastitis disease in Holstein dairy cows using large gap read mapping
BMC Genomics (2022)
Comments
By submitting a comment you agree to abide by our Terms and Community Guidelines. If you find something abusive or that does not comply with our terms or guidelines please flag it as inappropriate.
