
Abstract
Intestinal immune responses to microbes are controlled by the cytokine IL-10 to avoid immune pathology. Here, we use single-cell RNA sequencing of colon lamina propria leukocytes (LPLs) along with RNA-seq and ATAC-seq of purified CD4+ T cells to show that the transcription factors Blimp-1 (encoded by Prdm1) and c-Maf co-dominantly regulate Il10 while negatively regulating proinflammatory cytokines in effector T cells. Double-deficient Prdm1fl/flMaffl/flCd4Cre mice infected with Helicobacter hepaticus developed severe colitis with an increase in TH1/NK/ILC1 effector genes in LPLs, while Prdm1fl/flCd4Cre and Maffl/flCd4Cre mice exhibited moderate pathology and a less-marked type 1 effector response. LPLs from infected Maffl/flCd4Cre mice had increased type 17 responses with increased Il17a and Il22 expression and an increase in granulocytes and myeloid cell numbers, resulting in increased T cell–myeloid–neutrophil interactions. Genes over-expressed in human inflammatory bowel disease showed differential expression in LPLs from infected mice in the absence of Prdm1 or Maf, revealing potential mechanisms of human disease.
Main
The immune response has evolved to protect the host against infection; however, mechanisms such as the cytokine IL-10 are in place to regulate immune responses to pathogens and pathobionts to prevent untoward inflammation and host damage1,2,3,4,5. Mice deficient in IL-10 (Il10−/−) can develop colitis6, although less evidently in specific-pathogen-free-reared Il10−/− mice or germ-free mice7, triggered by pathobionts such as Helicobacter hepaticus (H. hepaticus)8. T cell-derived IL-10 dominantly controls intestinal responses with T cell-specific IL-10 mutant mice developing colitis to a similar level as Il10−/− mice9. Rare loss-of-function mutations in Il10, Il10ra or Il10rb genes result in inflammatory bowel disease (IBD) in childhood, although it is unclear whether infection by pathobionts contributes to these pathologies10. Genome-wide association studies have identified more than 230 loci linked to human IBD, including those associated with proinflammatory cytokines and transcription factors upstream of immune effector molecules11, such as Blimp-1, encoded by Prdm1 (ref. 12).
Both common and cell-specific transcriptional mechanisms regulate Il10 and proinflammatory gene expression in T cells to ensure a controlled immune response to pathogens or other triggers1,3,4,5,13,14,15. Given that transcription factors have multiple gene targets, those that positively regulate Il10 may simultaneously repress proinflammatory cytokine expression in T cells. c-Maf induces Il10 expression directly in multiple T cell subsets, both in vitro and in vivo1, while also acting as a negative regulator of Il2 (ref. 13) and other proinflammatory cytokines16 and also exhibiting context-specific effects13. Deletion of Maf in T cells or regulatory T cells (Treg) was reported to not result in spontaneous inflammation13,17, whereas in other studies, mice with T cell or Treg-specific deletion of Maf showed signs of intestinal inflammation18,19. The transcription factors c-Maf and Blimp-1 are dominant shared coregulators of Il10 gene expression in multiple T cell subsets14,15. Although T cell-specific deletion of Prdm1 has been reported to result in spontaneous colitis20,21,22 associated with increased frequencies of T helper 17 (TH17) cells23, other studies reported no intestinal inflammation in these mice14,24. Moreover, although Blimp-1 functions as a molecular switch to prevent inflammatory activity in Foxp3+RORγt+ Treg25, deletion of Prdm1 in Treg did not result in severe intestinal inflammation26. Spontaneous colitis has been reported in mice with T cell-specific deletion of the combination of both Prdm1 and Maf, and this pathology was associated with a unique cluster of Treg cells and the abrogation of Il10 expression14.
We report here that mice with T cell-specific deletion of Prdm1, Maf or both transcription factors do not develop colitis at the steady state. Upon infection with H. hepaticus, the absence of Prdm1 or Maf in T cells resulted in mild to moderate pathology, while the absence of both transcription factors resulted in severe pathology. We interrogated the immune response in the colon LPLs underpinning the pathology in the different T cell-specific transcription-factor-deficient H. hepaticus-infected mice using bulk tissue RNA sequencing (RNA-seq) and single-cell RNA sequencing (scRNA-seq), complemented by RNA-seq and assay for transposase-accessible chromatin sequencing (ATAC-seq) analysis of purified CD4+ T cells, and we validated key findings using flow cytometry and immunofluorescence staining of colon tissue. Double-deficient Prdm1fl/flMaffl/flCd4Cre H. hepaticus-infected mice showed a major increase in genes associated with TH1 and natural killer/innate lymphoid cell 1 (NK/ILC1) effector function including interferon-γ (IFNγ) and granulocyte–macrophage colony-stimulating factor (GM-CSF), but this was lower in Prdm1fl/flCd4Cre and Maffl/flCd4Cre mice. By contrast, LPLs from H. hepaticus-infected Maffl/flCd4Cre mice showed an increased type 17 response with increased expression of Il17a and Il22 and a pronounced signature of innate immunity and neutrophils. Genes identified as over-expressed in human IBD colon biopsies from transcriptomic datasets were differentially perturbed in the LPLs of H. hepaticus-infected mice with T cell-specific deficiencies in either Prdm1, Maf or both transcription factors, potentially reflecting different pathobiological mechanisms relevant to human IBD.
Results
T cell Blimp-1 and c-Maf control colitis via lymphoid and myeloid cells
Prdm1fl/flCd4Cre, Maffl/flCd4Cre and Prdm1fl/flMaffl/flCd4Cre mice did not develop colitis in the steady state (Extended Data Fig. 1a). Upon infection with H. hepaticus, these T cell-specific transcription-factor-deficient mice developed colitis with varying degrees of pathology, with an overall trend of double-deficient Prdm1fl/flMaffl/flCd4Cre mice developing the most severe disease, and the Prdm1fl/flCd4Cre and Maffl/flCd4Cre mice each developing mild to moderate colitis, respectively compared to Prdm1fl/flMaffl/fl control mice (hereafter referred to as control mice), which showed no inflammation or colitis (Fig. 1a–c and Methods). Total LPLs increased in all three knockouts compared to controls (Fig. 1d), and CD4+ T cell numbers were increased in the infected single Prdm1fl/flCd4Cre and Maffl/flCd4Cre and most significantly increased in the double-deficient Prdm1fl/flMaffl/flCd4Cre mice compared to controls (Fig. 1e).

a, Schematic of experimental method used to infect mice with H. hepaticus by oral gavage. b–e, Representative H&E colon sections from each genotype following infection with H. hepaticus for 14 days (b) with the corresponding colon histopathology scores (detailed in Methods) (c), colon LPL cell counts for each H. hepaticus-infected group compared to uninfected controls (d) and total CD4+ T cell counts for each H. hepaticus-infected group compared to uninfected controls (e). Each dot within the bar plots represents an individual mouse analyzed. Graph shows means, error bars, s.d. Analyzed by one-way ANOVA followed by Dunnett post-hoc test (*P ≤ 0.05, **P ≤ 0.01, ***P ≤ 0.001, ****P ≤ 0.0001). Scale bar, 100 μm. Bulk tissue RNA-seq was performed on total colon LPLs isolated from uninfected Prdm1fl/flMaffl/fl control and H. hepaticus-infected Prdm1fl/flMaffl/fl mice as well as mice with Cd4Cre-mediated deletion of either Prdm1, Maf or both Prdm1 and Maf. f, Heatmap of expression values (represented as z-scores) of DEGss identified in H. hepaticus-infected mice compared to uninfected Prdm1fl/flMaffl/fl controls (fold change ≥1.5 and Benjamini–Hochberg (BH)-adjusted P < 0.05), partitioned into nine clusters using k-means clustering. Pathology scores associated with each mouse are shown at the top of the heatmap. g, Enrichment of cell-type signatures (taken from a previous publication51) was assessed for each of the clusters in f using a Fisher’s exact test. Only statistically significant enriched signatures (BH-adjusted P < 0.05) were plotted for visualization. Data from n = 3–5 mice.
Given that Blimp-1 and c-Maf induce Il10 gene expression14,15 while negatively regulating a large network of proinflammatory cytokines15, we determined whether the effects of T cell-specific deletion of Prdm1, Maf or the combination of Prdm1 and Maf resulted in increased pathology and inflammation in H. hepaticus-infected mice owing to abrogation of IL-10 signaling. To address this question, the T cell-specific transcription-factor-deficient and control mice were infected with H. hepaticus in the presence of an anti-IL-10R blocking antibody (mAb) or isotype-matched mAb control (Extended Data Fig. 1b, right-hand side). Blockade of IL-10R signaling resulted in moderate to severe pathology in the colons of wild-type control mice and resulted in increased pathology in the single Prdm1fl/flCd4Cre and Maffl/flCd4Cre H. hepaticus-infected mice. However, the most severe pathology was still observed in the infected double-deficient Prdm1fl/flMaffl/flCd4Cre mice in the presence or absence of anti-IL-10R mAb, with no significant increase in pathology observed in mice administered anti-IL-10R mAb compared to those given isotype-control mAb (Extended Data Fig. 1b, right-hand side). These findings suggest that the high level of intestinal pathology observed in the Prdm1fl/flMaffl/flCd4Cre mice results from the effects of both transcription factors on other immune factors in addition to their co-dominant role in Il10 gene regulation.
To dissect the mechanisms underlying the pathology observed in the different T cell-specific transcription-factor-deficient mice, we performed RNA-seq analysis on LPLs from H. hepaticus-infected and uninfected mice (Extended Data Fig. 1c,d, Fig. 1f and Supplementary Table 1). Prdm1fl/flCd4Cre and Maffl/flCd4Cre showed a major increase in differentially expressed genes (DEGs) against uninfected control mice, while double-deficient Prdm1fl/flMaffl/flCd4Cre mice showed much higher numbers of DEGs compared to infected controls, which showed minimal DEGs (Supplementary Table 2). These formed nine clusters of similarly regulated DEGs, which were annotated using pathway analysis tools (Fig. 1f, Supplementary Table 2 and Extended Data Fig. 1e) with the associated pathology scores shown at the top of the heatmap (Fig. 1f). DEGs in cluster 3 (Metabolism/AhR), cluster 4 (signaling/Wnt/extracellular matrix), cluster 9 (stem cell/extracellular structure) and clusters 2 and 8 (miscellaneous) were all decreased in the LPLs from the H. hepaticus-infected transcription-factor-deficient mice compared to control mice and largely represented non-immune genes (Fig. 1f). Conversely, DEGs in cluster 1 (T cell activation/T helper cells) and cluster 5 (cell cycle) were partially increased in LPLs from both Prdm1fl/flCd4Cre and Maffl/flCd4Cre H. hepaticus-infected mice, and further increased in the double-deficient Prdm1fl/flMaffl/flCd4Cre mice (Fig. 1f). DEGs in cluster 6 (innate immunity/granulocytes) and cluster 7 (innate immunity/granulocytes/B cells) were most markedly increased in H. hepaticus-infected Maffl/flCd4Cre mice and in the double-deficient Prdm1fl/flMaffl/flCd4Cre mice, albeit to a lesser extent, while barely increased in the infected Prdm1fl/flCd4Cre (Fig. 1f and Supplementary Table 2). Enrichment of cell type-specific gene signatures, derived using ImmGen Ultra Low Input data (GSE109125), validated the pathway annotation of the clusters representing immune pathways (Fig. 1g and Extended Data Fig. 1e). Cluster 1 (T cell activation/T helper cells) was enriched in αβ-T cells, γδ-T cells and ILCs, and cluster 6 (innate immunity) and cluster 7 (granulocyte-associated genes) showed enrichment of macrophages, dendritic cells and granulocytes, and macrophages and granulocyte-associated genes, respectively (Fig. 1g).
To interrogate the gene expression changes further and identify the cellular sources of immune-associated genes, we performed scRNA-seq on LPLs isolated from colons from an independent experiment with H. hepaticus-infected and uninfected mice (Fig. 2 and Extended Data Fig. 2). Data from the LPLs of all groups were first integrated for analysis into a single uniform manifold approximation and projection plot, revealing 17 distinct cell clusters (Fig. 2a) for annotation, using the single-cell Mouse Cell Atlas as in the Methods, the Immgen database (GSE109125) and manual curation (Fig. 2a and Supplementary Table 3). scRNA-seq data from LPLs from H. hepaticus-infected Prdm1fl/flCd4Cre, Maffl/flCd4Cre and double-deficient Prdm1fl/flMaffl/flCd4Cre mice showed distinct profiles compared to uninfected (fl/fl control mice and double-deficient Prdm1fl/flMaffl/flCd4Cre mice) and infected control fl/fl mice (Fig. 2b and Extended Data Fig. 2). A similar proportion of immune cell types was identified by scRNA-seq in the LPLs from the uninfected control mice, uninfected double-deficient Prdm1fl/flMaffl/flCd4Cre+ mice and H. hepaticus-infected control mice, with no intestinal pathology (Fig. 2b and Extended Data Fig. 2). LPL preparations from uninfected double-deficient Prdm1fl/flMaffl/flCd4Cre+ mice, however, showed some unexplainable increases in the proportion of epithelial cells, although these mice showed no intestinal pathology (Fig. 2b; see Methods). Moreover, no increase in LPLs (Fig. 2c) or CD4+ T cells (Fig. 2d) assessed by flow cytometry was observed at the steady state in these mice.

scRNA-seq was performed on total colon LPL isolated from uninfected Prdm1fl/flMaffl/fl and Prdm1fl/flMaffl/flCd4Cre control mice, and H. hepaticus-infected Prdm1fl/flMaffl/fl mice as well as mice with Cd4Cre-mediated deletion of either Prdm1, Maf or both Prdm1 and Maf. a, Uniform manifold approximation and projection (UMAP) visualization of the integrated scRNA-seq from all conditions, colored by the identified/assigned cell cluster. b, Bar plots representing the proportion of cells in each of the cell clusters per biological replicate within each experimental condition and corresponding histopathological scores (detailed in Methods). c, Colon LPL cell counts for each H. hepaticus-infected group compared to uninfected controls. d, Total CD4+ T cell counts for each group in the experiment for each H. hepaticus-infected group compared to uninfected controls. Each dot within the bar plots represents an individual mouse analyzed. Graph shows means; error bars, s.d. Analyzed by one-way ANOVA followed by Dunnett post-hoc test (*P ≤ 0.05; **P ≤ 0.01; ***P ≤ 0.001; ****P ≤ 0.0001). Data from n = 5 mice. e, Dot plot of the top ten differentially expressed marker genes of relevant cell clusters from a, colored by the average gene expression across all cell clusters. The dot size represents the percentage of cells per cell cluster expressing the gene in question.
Increased intestinal pathology (Fig. 2b) and LPL and CD4+ T cell numbers were again observed by flow cytometry (Fig. 2c,d) in H. hepaticus-infected Prdm1fl/flCd4Cre, Maffl/flCd4Cre and double-deficient Prdm1fl/flMaffl/flCd4Cre compared to control fl/fl mice. The scRNA-seq data revealed a similar increase in the proportion of T cells but additionally revealed greater granularity, with an increase in a subset of Ctla4 high T cells in the LPL from Prdm1fl/flCd4Cre and Maffl/flCd4Cre mice and to a greater extent in infected double-deficient Prdm1fl/flMaffl/flCd4Cre mice (Fig. 2b, Extended Data Fig. 2 and Supplementary Table 3). A smaller increase of Icos high T cells but not Cd8 T cells was observed (Fig. 2b and Extended Data Fig. 2). The NK/ILC cell cluster expressed a distinct discrete set of NK cell-specific genes, including Nkg7, Klrb1b and the highest level of Ifng, confirming their identity as NK/ILC1 cells (Fig. 2e and Extended Data Fig. 3a). The Ctla4 high and Icos high T cell subsets, although clustering separately, broadly shared the expression of the top ten marker genes (Fig. 2e and Extended Data Fig. 3a). scRNA-seq data recapitulated an increase in granulocytes in H. hepaticus-infected Maffl/flCd4Cre and double-deficient Prdm1fl/flMaffl/flCd4Cre only, but not in infected Prdm1fl/flCd4Cre or control mice (Fig. 2b), with increased expression of genes associated with neutrophils, including Acod1, S100a8 and S100a9 (Fig. 2e, Extended Data Fig. 3a and Supplementary Table 3). Populations annotated as macrophages and myeloid leukocytes were increased in the LPLs from H. hepaticus-infected Prdm1fl/flCd4Cre, Maffl/flCd4Cre and double-deficient Prdm1fl/flMaffl/flCd4Cre mice (Fig. 2b and Extended Data Fig. 2), with increased expression of genes associated with myeloid or innate immune responses such as Lyz2 (LysM), Csf2rb, Il1r2, Il1b and Cd14 (Fig. 2e, Extended Data Fig. 3a and Supplementary Table 3). These scRNA-seq data thus identified the cellular sources of key gene expression signatures.
Prdm1 and Maf induce Il10 while also disrupting effector T cell gene expression
Expression of Il10 mRNA in purified CD4+ T cells from LPLs was diminished in H. hepaticus-infected Prdm1fl/flCd4Cre and Maffl/flCd4Cre mice, and to the greatest extent in the double-deficient Prdm1fl/flMaffl/flCd4Cre mice (Fig. 3a and Supplementary Tables 4 and 5). This was mirrored by similar decreases in IL-10 protein production (Extended Data Fig. 4a,d,e). Conversely, CD4+ T cells showed increased Ifng expression in infected Prdm1fl/flCd4Cre and Maffl/flCd4Cre mice (Fig. 3b), with the greatest increase observed in the double-deficient Prdm1fl/flMaffl/flCd4Cre, mirrored by increased IFNγ protein production (Extended Data Fig. 4a–c,e). Increased Ifng expression was more pronounced in total LPLs by RNA-seq (Fig. 3c) and scRNA-seq (Fig. 3d) than in CD4+ T cells, suggesting that increased numbers of CD4+ T cells, γδ-T cells or NK/ILC1 are contributing to the global increased levels of Ifng expression in the LPLs of the H. hepaticus-infected T cell-specific transcription-factor-deficient mice. The level of Il17a and Il22 expression in purified CD4+ T cells from the LPLs was highest in the infected Maffl/flCd4Cre mice and lower in those from infected Prdm1fl/flMaffl/flCd4Cre and Prdm1fl/flCd4Cre mice (Fig. 3b), with similar findings in LPLs by RNA-seq (Fig. 3c) and scRNA-seq (Fig. 3d). Levels of Il17a were similar in CD4+ T cells in the infected Maffl/flCd4Cre mice to those in uninfected and infected control mice (Fig. 3b). However, scRNA-seq showed exclusive elevation of Il17a at the level of expression and percentage of Il17a expressing cells, suggesting that increased numbers of CD4+ T cells, γδ-T cells or ILC3 contribute to the global increase in Il17a expression in LPLs from H. hepaticus-infected Maffl/flCd4Cre mice (Fig. 3c,d). Csf2 RNA expression was highest in CD4+ T cells (Fig. 3b) and in scRNA-seq of LPLs from infected double-deficient Prdm1fl/flMaffl/flCd4Cre mice (Fig. 3d), as were TH1-associated effector molecules Ifng, Il18r1, Il12rb2, Il12rb1 and Cxcr3, and additionally Il23r. Many of these genes were also elevated in the Prdm1fl/flCd4Cre but not in the Maffl/flCd4Cre mice (Fig. 3b,d and Extended Data Fig. 4k).

a,b, RNA-seq gene expression of Il10 (a) and Ifng, Il17a, Il22 and Csf2 (b) in sorted CD4+ T cells from colon LPLs isolated from uninfected Prdm1fl/flMaffl/fl mice and H. hepaticus-infected Prdm1fl/flMaffl/fl mice as well as mice with Cd4Cre-mediated deletion of either Prdm1, Maf or both Prdm1 and Maf. c, Gene expression of Ifng, Il17a and Il22 in bulk tissue total colon LPLs isolated from uninfected and H. hepaticus-infected mice. In a–c, DEGs in each condition against uninfected Prdm1fl/flMaffl/fl mice were marked for statistical significance as follows, *BH-adjusted P ≤ 0.05; **BH-adjusted P ≤ 0.01; ***BH-adjusted P ≤ 0.001; ****BH-adjusted P ≤ 0.0001. d, Dot plot of scRNA-seq gene expression of selected genes Ifng, Il17a, Il22, Il18r1, Il12rb2, Il12rb1, Il23r, Cxcr3 and Csf2 in colon LPLs from H. hepaticus-infected Prdm1fl/flMaffl/fl or mice with Cd4Cre-mediated deletion of either Prdm1, Maf or both Prdm1 and Maf. The dot size represents the percentage of cells per cell cluster expressing the gene in question and the expression level indicated by the color scale. e, Expression of Foxp3 as assessed by scRNA-seq within the UMAP visualization of annotated scRNA-seq datasets within each of H. hepaticus-infected genotypes. f–j, Expression at the single-cell level of Il10 (f), Ifng (g), Csf2 (h), Il17a (i) and Il22 (j) in the 'Ctla4 high' cells expressing Foxp3 (Foxp3+) or not (Foxp3−). The distribution of expression in cells within each condition is shown by the violin plots; the dot plot (top panels) displays the proportion of cells expressing the gene in question, with the expression level indicated by the color scale.
The scRNA-seq data was further interrogated to identify the source of cells expressing Il10 and proinflammatory cytokines in the LPLs from the H. hepaticus-infected T cell-specific transcription-factor-deficient mice. Foxp3+ Treg cells contained within the Ctla4 high cluster of T cells (Fig. 3j) were identified as the main Il10-expressing T cells (Fig. 3e). Expression and percentages of Il10-producing cells were diminished in Foxp3+ Treg cells from both the Prdm1fl/flCd4Cre, Maffl/flCd4Cre and to the greatest extent in the double-deficient Prdm1fl/flMaffl/flCd4Cre infected mice compared to infected control mice, and reduced similarly in the very low numbers of Foxp3−CD4+ Il10-expressing T cells (Fig. 3f). Foxp3+ Treg cells showed a graded increase in numbers by flow cytometry in the LPLs from H. hepaticus-infected Prdm1fl/flCd4Cre, Maffl/flCd4Cre and double-deficient Prdm1fl/flMaffl/flCd4Cre mice, respectively (Extended Data Fig. 5a–c). By contrast, Foxp3+RORγt+ T cells were almost completely abolished in the LPLs from infected Maffl/flCd4Cre mice (Extended Data Fig. 5b,c) as previously reported27, whereas they were increased in LPLs from infected Prdm1fl/flCd4Cre and to a lesser extent double-deficient Prdm1fl/flMaffl/flCd4Cre mice compared to control mice (Extended Data Fig. 5b,c). Despite this, infected double-deficient Prdm1fl/flMaffl/flCd4Cre mice exhibited the maximum pathology (Fig. 1b,c and Fig. 2b) and expressed the lowest levels of Il10 in CD4+ T cells (Fig. 3a,f).
In contrast to the dominant expression of Il10 in Foxp3+ Treg cells, Ifng and Csf2 were most highly expressed in the Foxp3− Ctla4 high T cell cluster, while being scarcely detectable in Foxp3+ Treg cells (Fig. 3g,h) and increased in Prdm1fl/flCd4Cre and Maffl/flCd4Cre and mostly highly in double-deficient Prdm1fl/flMaffl/flCd4Cre-infected mice, respectively. Conversely, Il17a and Il22 expression by scRNA-seq, while also expressed largely in Foxp3−CD4+ T cells, was highest in LPLs from infected Maffl/flCd4Cre mice (Fig. 3i,j), in keeping with RNA-seq data from flow cytometry-purified CD4+ T cells (Fig. 3b). Diminished expression of Il17a and Il22 in LPLs from infected Prdm1fl/flMaffl/flCd4Cre mice suggest repression of the Il17a and/or Il22 response by Blimp-1 regulated factors (Fig. 3i,j). Collectively, these data suggest that the intestinal pathology resulting from T cell-specific deficiency in Maf differs qualitatively from that of Prdm1 and even Prdm1–Maf double deficiency owing to a type 17-mediated effector cytokine response to H. hepaticus infection rather than the increased type 1 mediated response controlled by both transcription factors.
Global analysis of RNA-seq and ATAC-seq data revealed large unique and overlapping changes in gene expression and differentially accessible sites in CD4+ T cells from both H. hepaticus-infected Prdm1fl/flCd4Cre and Maffl/flCd4Cre mice compared to control mice, with much higher changes in CD4+ T cells from infected double-deficient Prdm1fl/flMaffl/flCd4Cre mice (Extended Data Fig. 6a–g and Supplementary Tables 6 and 7). A combination of ATAC-seq and RNA-seq data from purified CD4+ T cells from colon LPLs of the H. hepaticus-infected T cell-specific transcription-factor-deficient mice was integrated with published chromatin immunoprecipitation with sequencing (ChIP-seq) data and revealed common and distinct binding sites for Blimp-1 and c-Maf in the Il10 locus as previously reported14. However, distinct binding sites for Blimp-1 in the Ifng locus were observed, while c-Maf had several binding sites within the Il17 locus and weak binding sites in the Il22 and Csf2 gene loci (Fig. 4a). Our data are supportive of cooperative and independent roles of these transcription factors in the positive regulation of Il10 and additionally in negative regulation of proinflammatory cytokine genes. Pathway analysis applied to the RNA-seq data from CD4+ T cells revealed an increase in IL-12R and downstream Stat1/Stat4 signaling for Ifng induction in the CD4+ T cells from the H. hepaticus-infected Prdm1fl/flCd4Cre, Maffl/flCd4Cre and double-deficient Prdm1fl/flMaffl/flCd4Cre mice, respectively, with the largest increase in IFNγ observed in the double-deficient mice compared to infected control mice (Fig. 4b). Pathway analysis showed the highest increase of IL17A and IL22 within the TH17 pathway in the Maffl/flCd4Cre CD4+ T cells, with a marked decrease in infected double-deficient Prdm1fl/flMaffl/flCd4Cre mice, suggesting that factors regulated by Blimp-1 may repress expression of the Il17a gene (Fig. 4c). Expression of Csf2 observed within the TH17 pathway was again increased in CD4+ T cells from LPLs of all the H. hepaticus-infected Prdm1fl/flCd4Cre, Maffl/flCd4Cre although most marked in Prdm1fl/flMaffl/flCd4Cre mice compared to control infected mice (Fig. 4c).

a, ATAC-seq was performed on sorted CD4+ T cells from colon LPLs isolated from uninfected Prdm1fl/flMaffl/fl control and H. hepaticus-infected Prdm1fl/flMaffl/fl mice as well as mice with Cd4Cre-mediated deletion of either Prdm1, Maf or both Prdm1 and Maf. Genome browser tracks of ATAC-seq data from each condition together with publicly available c-Maf (green) and Blimp-1 (red) ChIP-seq datasets in the Il10, Ifng, Il17a, Il22 and Csf2 loci. Statistically significant ChIP-seq peaks (q < 0.05) are represented by a green or red bar underneath the normalized read coverage tracks for c-Maf and Blimp-1, respectively. b,c, IPA was used to overlay sorted CD4+ T cells RNA-seq onto the TH1 (b) and TH17 (c) pathways. Gene expression fold changes in each H. hepaticus-infected condition relative to the uninfected Prdm1fl/flMaffl/fl control were overlayed onto the TH1 and TH17 pathways. A fixed scale of −5 (blue) to 3.5 (red) was kept between all conditions, and Prdm1 was colored black in the Prdm1-deficient T cells.
T cell-derived Blimp-1 and c-Maf control innate immunity
The average increased expression of ‘innate immunity and myeloid-associated’ genes in the bulk tissue RNA-seq data, cluster 6 (Fig. 1f,g) from the LPLs from H. hepaticus-infected Maffl/flCd4Cre and, to a lesser extent, Prdm1fl/flCd4Cre and double-deficient Prdm1fl/flMaffl/flCd4Cre mice compared to controls was confirmed quantitatively (Fig. 5a); for example, for Il1a and Osm, encoding Oncostatin M (Fig. 5b), which was previously associated with colitis11,28,29. Granulocyte-associated genes in this cluster, including Csf3r, Lcn2, S100a8 and Cxcr2, were most highly expressed in the LPLs from infected Maffl/flCd4Cre mice and to a much lesser extent in the double-deficient Prdm1fl/flMaffl/flCd4Cre and Prdm1fl/flCd4Cre mice (Fig. 5b). Similarly, while the average gene expression in the bulk tissue RNA-seq data granulocyte cluster 7 (Fig. 1f,g) was increased in the LPLs of control mice upon infection with H. hepaticus, a further increase was seen in the Maffl/flCd4Cre and to a lesser extent in the Prdm1fl/flCd4Cre infected mice, but not in the double-deficient Prdm1fl/flMaffl/flCd4Cre infected mice, which showed levels similar to those of the H. hepaticus-infected control mice (Fig. 5c). Genes associated with granulocyte/neutrophil activation, including Ncf2, Itgam, Mmp9 and Padi4, showed the highest expression in the LPLs from infected Maffl/flCd4Cre mice but not in the Prdm1fl/flCd4Cre or double-deficient Prdm1fl/flMaffl/flCd4Cre infected mice, which showed similar or reduced levels to those from infected control mice, the latter suggesting potential counter-regulatory mechanisms provided by Blimp-1 signaling in T cells (Fig. 5d). Additionally, Acod1, a gene encoding enzyme aconitate decarboxylase 1 (Irg1), which produces the metabolite itaconate in myeloid cells30, was found to be most highly expressed in LPLs from infected Maffl/flCd4Cre mice and double-deficient Prdm1fl/flMaffl/flCd4Cre infected mice (Fig. 5d). scRNA-seq analysis showed that the granulocyte/neutrophil and myeloid leukocyte clusters were the source of Il1a and Acod1 in the LPLs from infected Maffl/flCd4Cre and double-deficient Prdm1fl/flMaffl/flCd4Cre mice (Fig. 5e). The expression of genes associated with granulocytes/neutrophils, including Lcn2, S100a8, S100a9 and Cxcr2, was exclusively detected in the ‘granulocyte/neutrophil’ cluster by scRNA-seq (Fig. 5e). Although basal expression of some of these genes was observed in the low number of granulocytes detected by scRNA-seq in the infected control mice, increased expression of these neutrophil-associated genes (Fig. 5e) and granulocyte percentage and numbers (Extended Data Fig. 2b,c) were observed in the LPLs from the Maffl/flCd4Cre and the double-deficient Prdm1fl/flMaffl/flCd4Cre infected mice. In keeping with the scRNA-seq data, increased percentage and numbers of Ly6G+CD11b+ neutrophil cells were observed by flow cytometry analysis in the LPLs from the Maffl/flCd4Cre but to a lesser extent in double-deficient Prdm1fl/flMaffl/flCd4Cre H. hepaticus-infected mice compared to uninfected or infected control mice and infected Prdm1fl/flCd4Cre mice, in which these populations were barely detectable (Fig. 5f,g). This was reinforced by analysis of combined gene expression and percentage in the scRNA-seq data for granulocyte-specific genes, such as Ncf2, Csf3r, S100a8 and S100a9, as well as innate cell genes Il1a, Il1b and Acod1, which were maximal in the LPLs from the infected Maffl/flCd4Cre mice (Fig. 5h). Ly6G−CD11b+ myeloid cells, while present in uninfected and infected control mice at low numbers, showed a significant increase by flow cytometry in the LPLs from the H. hepaticus-infected Prdm1fl/fCd4Cre mice, and to a greater extent in both Maffl/flCd4Cre and double-deficient Prdm1fl/flMaffl/flCd4Cre mice compared to the uninfected or infected control mice (Fig. 5f,g). This increase in myeloid cells is in keeping with increased expression of Il1a, Il1b, Acod1 and the Csf2ra and Csf2rb in the LPLs from both the infected Maffl/flCd4Cre and double-deficient Prdm1fl/flMaffl/flCd4Cre mice (Fig. 5e,h).

a–d, Violin plots summarizing the expression values (quantified as z-scores) and boxplots of example genes of innate immunity-associated genes found in cluster 6 (a,b) and neutrophil activation associated genes found in cluster 7 (c,d) of the bulk tissue LPL RNA-seq data analysis from Fig. 1f. DEGs in each condition against uninfected Prdm1fl/flMaffl/fl mice were marked as follows (all P values BH-adjusted): *P ≤ 0.05; **P ≤ 0.01; ***P ≤ 0.001; ****P ≤ 0.0001. e, Expression of selected innate immunity and granulocyte-associated genes queried in the granulocyte, macrophage and myeloid leukocyte cell clusters across all H. hepaticus-infected conditions within the colon LPL scRNA-seq dataset. f, Representative flow plots and gating strategy used for the flow cytometry analysis of neutrophils (Live CD90.2−TCR-β−CD19− CD11+Ly6G+) across uninfected Prdm1fl/flMaffl/fl and Prdm1fl/flMaffl/flCd4Cre, and H. hepaticus-infected Prdm1fl/flMaffl/fl mice as well as mice with Cd4Cre-mediated deletion of either Prdm1, Maf or both Prdm1 and Maf. g, Bar plots of percentage from live (top panels) and absolute cell counts (bottom panels) of neutrophils and Ly6G–CD11b+ cells from lamina propria of the colon. Each dot within the bar plots represents an individual mouse analyzed. Graph shows means, error bars, s.d. Analyzed by one-way ANOVA followed by Dunnett post-hoc test (*P ≤ 0.05; **P ≤ 0.01; ***P ≤ 0.001; ****P ≤ 0.0001). Data from n = 4–5 mice. h, Dot plot of scRNA-seq gene expression of selected genes Il1b, Ncf2, Acod1, Csf2ra, Csf2rb, Csf3r, Il1a, Osm, S100a8, S100a9, Csf3 and Cxcr2, in the colon LPLs from H. hepaticus-infected control Prdm1fl/flMaffl/fl mice and mice with Cd4Cre-mediated deletion of either Prdm1, Maf or both Prdm1 and Maf. The dot size represents the percentage of cells per cell cluster expressing the gene in question, and the expression level is indicated by the color scale.
Prdm1 and Maf control T cell–myeloid colonic cell interactions
Ligand–receptor pairs identified from the scRNA-seq data using CellChat, as referenced in the Methods, were used to infer putative cell-to-cell crosstalk (Fig. 6 and Extended Data Figs. 7 and 8). Analysis of the immune cells of interest from this study revealed outgoing and incoming interactions between the T cell Ctla4 high population and B cells in the LPLs from H. hepaticus-infected control mice, while in the infected Prdm1fl/flCd4Cre, Maffl/flCd4Cre and double-deficient Prdm1fl/flMaffl/flCd4Cre mice, myeloid leukocyte/macrophage populations delivered increased strength of signals to the T cell Ctla4 high population, which in turn signaled back to these myeloid cells (Fig. 6a). These findings were validated by immunofluorescent staining of colon sections (Fig. 6b and Extended Data Fig. 9). CD4+ T cells (white) and CD68+ mononuclear phagocytes (magenta) were found to be increased and in close proximity in H. hepaticus-infected Prdm1fl/flCd4Cre mice, and to a greater extent in Maffl/flCd4Cre and double-deficient Prdm1fl/flMaffl/flCd4Cre-infected mice compared to control mice (Fig. 6b). Neutrophils staining positive for MPO were most abundant in Maffl/flCD4Cre-infected mice (Fig. 6b), in keeping with the RNA-seq and flow cytometry data, and appeared to co-localize for the most part with CD68+ mononuclear phagocytes and CD4+ T cells (Fig. 6b). The largest inferred increase in both outgoing and incoming signals observed in myeloid leukocytes was in the LPLs from infected Maffl/flCd4Cre and double-deficient Prdm1fl/fMaffl/flCd4Cre mice, which included strong outgoing CCL and CXCL signaling. The T cell Ctla4 high population was inferred to deliver a strong Ccl5 signal to Ccr1/Ccr5 on myeloid leukocytes (Fig. 6c,d), whereas the myeloid leukocyte population was predicted to deliver a strong Cxcl16/Cxcl10 signal largely to Cxcr6/Cxcr3 on the T cell Ctla4 high population, highlighting potential axes contributing to CD4 T cell accumulation in the LPLs of these mice (Fig. 6c,d). Consistent with the well-established role of Cxcl2–Cxcr2 in neutrophil responses, inferred interactions between the myeloid leucocyte population and granulocytes through the Cxcl2–Cxcr2 axis—and additionally, strong Ccl interactions within the myeloid leukocyte population and from myeloid leukocytes to granulocytes—were detected in the infected Maffl/flCd4Cre and double-deficient Prdm1fl/flMaffl/fCd4Cre mice (Fig. 6c,d), potentially contributing to the increased neutrophil and myeloid numbers in these mice. While IFNγ signaling in infected control mice was inferred to be delivered from NK cells to B cells, an outgoing signal from T cell Ctla4 high cells to myeloid cells and B cells was observed in the infected Prdm1fl/flCd4Cre, Maffl/flCd4Cre and double-deficient Prdm1fl/flMaffl/flCd4Cre mice (Extended Data Fig. 8c). Inferred Csf1 signaling between myeloid populations detected in both Maffl/flCd4Cre and double-deficient Prdm1fl/fMaffl/fCd4Cre mice (Extended Data Fig. 8d) potentially contributed to the increased myeloid cells and neutrophils. Thus, dysregulated cytokine and chemokine cell–cell interaction networks downstream of disrupted transcriptional regulation in T cells by Blimp-1 and c-Maf may contribute to pathology during H. hepaticus infection.

Cell-to-cell communication networks inferred using CellChat software from gene expression of ligands and their receptors in immune cell clusters of interest from the colonic LPL scRNA-seq dataset. a, Strength of interaction of cell-to-cell interactions, represented in the edge width, in H. hepaticus-infected Prdm1fl/flMaffl/fl mice and mice with Cd4Cre-mediated deletion of either Prdm1, Maf or both Prdm1 and Maf. b, Representative images (n = 4–5) of colon sections by immunofluorescence, staining for CD4+ T cells (CD4, white), mononuclear phagocytes (CD68, magenta), neutrophils (MPO, green) and nuclear staining (DAPI, blue) from H. hepaticus-infected Prdm1fl/flMaffl/fl mice and mice with Cd4Cre-mediated deletion of either Prdm1, Maf or both Prdm1 and Maf. Scale bar, 20 μm. c,d, Cell-to-cell communication networks underlying CCL (c) and CXCL (d) pathways across all H. hepaticus-infected Prdm1fl/flMaffl/fl mice and mice with Cd4Cre-mediated deletion of either Prdm1, Maf or both Prdm1 and Maf. The chord plot has receiver cells at the top (incoming signaling) and transmitter cells (outgoing signaling) at the bottom. The edges are colored based on the cell clusters expressing the outgoing signals. In a,c and d, node size is proportional to the number of cells in each experimental group, and the edges are colored based on the cell clusters expressing the outgoing signals.
Genes expressed in human IBD are controlled by Blimp-1 and c-Maf
Transcriptomic data from colon biopsies of patients with IBD, including Crohn’s disease and ulcerative colitis, were obtained from the Gene Expression Omnibus (GEO) (GSE193677 and GSE126124). Modular analysis was performed to display clusters of up-regulated or down-regulated genes compared to controls. Modules of interest were annotated and selected to interrogate our mouse LPL scRNA-seq dataset from the H. hepaticus-infected mice. (Fig. 7a,b,c and Supplementary Table 8). Genes within the human IBD ‘Immune effector’ module were found to be largely expressed in the ‘B cells 1’, ‘macrophage/myeloid leukocyte’, ‘T cells Ctla4 high’ and ‘T cells Icos high’ in the mouse LPL scRNA-seq clusters from infected Prdm1fl/fCd4Cre mice and to a greater extent the Maffl/flCd4Cre and double-deficient Prdm1fl/fMaffl/flCd4Cre mice (Fig. 7d). Expression of genes from the human ‘granulocyte, myeloid’ module, which were more highly expressed in adult ulcerative colitis, which usually manifests as inflammation of the colon, was largely confined to the mouse scRNA-seq ‘epithelial’, ‘granulocyte’ and ‘macrophage/myeloid leukocyte’ clusters, and expressed at the highest level in the Maffl/flCd4Cre and double-deficient Prdm1fl/fMaffl/fCd4Cre mice (Fig. 7e,f). T cell/ILC-related genes shown earlier to be expressed at the highest level in the LPLs from H. hepaticus double-deficient Prdm1fl/fMaffl/fCd4Cre-infected mice (Fig. 3) were contained within these human IBD modules and IFNG, CSF2, IL18R1, IL-12RB1, IL12RB2 and IL23R expression was increased in Crohn’s disease and to a greater extent in ulcerative colitis (Fig. 7f). Additionally, identified within the human IBD ‘Immune effector module’, IL21 was over-expressed in ulcerative colitis (Fig. 7f) and showed the highest abundance in the LPLs from H. hepaticus double-deficient Prdm1fl/fMaffl/fCd4Cre-infected mice (Fig. 7g), suggesting that IL-21 is associated with a type 1 response. T cell/ILC-associated genes most highly expressed in LPLs from infected Maffl/flCd4Cre mice (Fig. 3), including IL17A and IL17F, were highly expressed in human IBD, again to a higher extent in ulcerative colitis (Fig. 7f,g and Supplementary Table 8). Multiple genes associated with myeloid cells and innate immunity, which we showed earlier were most highly expressed in the LPLs from infected Maffl/flCd4Cre mice (Fig. 5h), were over-expressed in human IBD, including IL1B, IL1A, CSF3, ACOD1, OSM, S100A8, S100A9 and CXCR2 (Fig. 7f). However, ALPK2, over-expressed in human IBD and mostly in ulcerative colitis (Fig. 7f), was equally expressed in Maffl/flCd4Cre and double-deficient Prdm1fl/fMaffl/fCd4Cre mice (Fig. 7g), while CXCL10 was increased in both ulcerative colitis and Crohn’s disease (Fig. 7f), and was highest in the double-deficient LPLs (Fig. 7g). Other genes identified within the human IBD ‘granulocyte, myeloid’ module, including NOD2, FCGR3 and PROK2, which were most highly expressed in the biopsies from ulcerative colitis (Fig. 7f), were most highly abundant in the Maffl/flCd4Cre mice (Fig. 7g). Our findings indicate that genes that show increased expression in human IBD colon biopsies, including those with mutations that have been linked to an increased risk of Crohn’s disease and/or ulcerative colitis, such as NOD2, IL23R, IL21 and IFNG11, are differentially abundant in the LPLs from H. hepaticus-infected mice with T cell-specific deletion of Prdm1, Maf or both transcription factors, suggesting that these mouse models may reflect different pathobiological mechanisms relevant in human IBD.
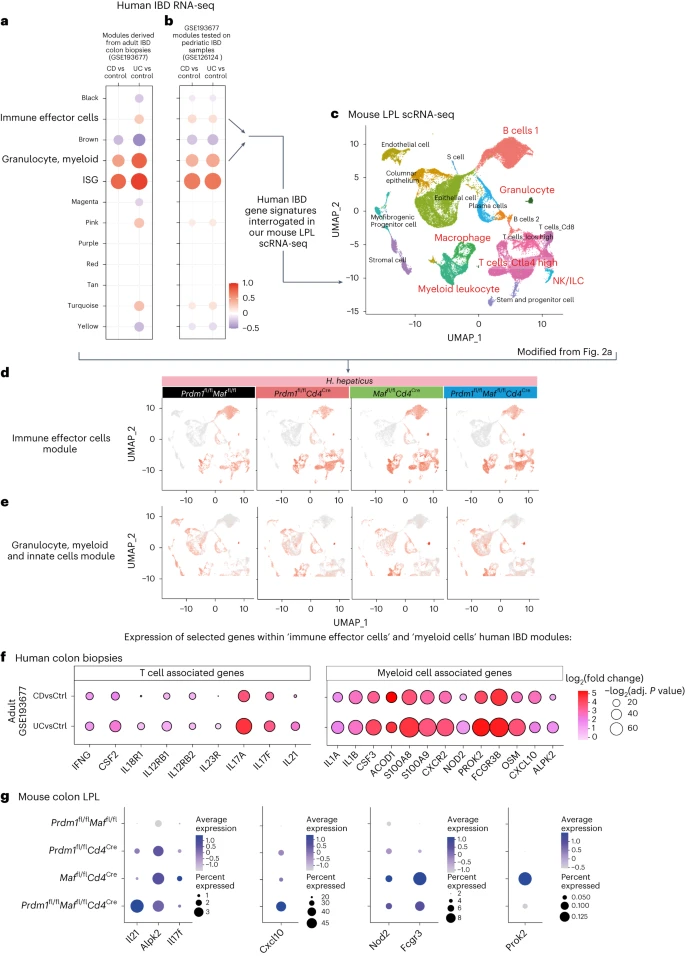
a, Modules of co-expressed genes were derived from human adult IBD colonic biopsies (GSE193677) using the R package WGCNA and b, tested in an independent human pediatric IBD dataset (GSE126124). CD, Crohn’s disease; UC, ulcerative colitis. In the dot plots, the color and size of the dots represent the fold enrichment in disease compared to controls. Re-named modules indicate biological processes associated with the genes within a module. Fold-enrichment scores were derived using QuSAGE software; red and blue colors indicated over-abundance and under-abundance, respectively, of genes within a module (compared to control samples). Size of the dots represents the relative degree of perturbation (larger dots represent a higher degree of perturbation), and only modules with an adjusted P < 0.05 were considered significant and depicted in the plot. c, Enrichment of genes within the 'immune effector cells' and the 'granulocyte, myeloid and innate cells' modules were then tested in our mouse colon LPL scRNA-seq dataset. d,e, Scoring of the 'immune effector cells' (d) and 'granulocyte, myeloid and innate cells' modules (e) were projected into our scRNA-seq UMAP. f, Dot plot of over-expressed T cell-associated or myeloid cell-associated genes from human IBD colon biopsies found within the modules from a and b versus controls. The dot size represents the P value and the log2(fold change) is indicated by the color scale. g, Dot plot of gene expression of selected genes found to be over-expressed in human IBD as in f, in colon LPL scRNA-seq from H. hepaticus-infected control Prdm1fl/flMaffl/fl mice and mice with Cd4Cre-mediated deletion of either Prdm1, Maf or both Prdm1 and Maf. The dot size represents the percentage of cells per cell cluster expressing the gene in question and the expression level indicated by the color scale.
Discussion
IL-10 production by CD4+ T cells is critical in regulating immune responses to avoid intestinal immune pathology in response to any potentially disease-causing microorganisms. Here, we show that during oral infection with H. hepaticus, Blimp-1 and c-Maf cooperate to positively regulate Il10 gene expression and differentially negatively regulate a large network of proinflammatory effector genes. H. hepaticus infection of double-deficient Prdm1fl/flMaffl/flCd4Cre mice resulted in a high-level type 1 immune response in LPLs with increased Ifng, Csf2, Il23r, ll12rb1 and Il12rb2 expression, which were also increased (but to a lesser extent) in LPLs from infected Prdm1fl/flCd4Cre and Maffl/flCd4Cre mice. Conversely, H. hepaticus infection of Maffl/flCd4Cre mice resulted in a Type 17 response, with increased Il17a and Il22 expression and a pronounced signature of neutrophils, myeloid cells and innate immunity. Thus, Blimp-1 and c-Maf cooperate to control common and distinct gene networks in T cells by specific, direct and shared actions on proinflammatory cytokines, over and above their direct stimulatory effects on Il10. Genes over-expressed in human IBD showed differential expression in the LPLs from H. hepaticus-infected mice with T cell-specific deletion of Prdm1 or Maf, potentially revealing T cell-regulated mechanisms relevant to human disease.
Our findings that T cell-specific deletion of Maf did not result in overt inflammation of the colon in the steady state are in keeping with most reports that Maffl/flCd4Cre or Maffl/flFoxp3Cre mice do not develop colitis13,14,17,18 in the absence of challenge, although there are a few conflicting reports of spontaneous mild colitis18,19. Likewise, there are conflicting reports in T cell-specific Prdm1-deficient mice, with some indicating spontaneous colitis22,23,31 whereas in other reports no signs of colitis were observed24, the latter in keeping with our findings. Spontaneous colitis in double-deficient Prdm1fl/flMaffl/flCd4Cre mice has been reported14, in contrast to our findings in the same mice, probably reflecting the controlled microbiota in our vivarium. Spontaneous colitis in mice with T cell-specific deletion of Prdm1, Maf or both transcription factors has been associated with either Treg cells losing their immunosuppressive function14 or increased frequencies of TH17 cells23, probably triggered by undefined microbiota or infection with pathobionts. Microbiota or pathobionts may be maintaining TH17 cells at the steady state, as has been previously described17,32,33 and very recently shown to be under c-Maf-dependent Treg control17.
Given that mice with T cell-specific deletion of Prdm1, Maf or both transcription factors did not exhibit any signs of intestinal inflammation, this provided us with an excellent baseline to determine their role in regulating the intestinal immune response to a defined pathobiont. No intestinal pathology was observed in the control H. hepaticus-infected mice unless they were co-administered anti-IL-10R mAb, in keeping with previous reports8,34,35,36. As no increase in pathology was observed in the Prdm1fl/flMaffl/flCd4Cre H. hepaticus-infected mice when co-administered anti-IL-10R mAb, this suggests that the high level of intestinal pathology resulted from the effects of both Prdm1 and Maf on other immune factors in addition to their co-dominant and direct role in Il10 gene regulation3,4,5,13,14,37. This is supported by our findings of distinct Blimp-1 binding sites for Ifng and unique c-Maf binding sites for Il17a and Il22, coinciding with open chromatin (ATAC-seq) sites from sorted CD4+ T cells from H. hepaticus-infected mice.
Our findings that T cell-associated and ILC-associated genes such as IFNG, IL12RB2, IL23R, IL18R, CSF2, IL17A and IL17F that were highly expressed in colon biopsies from human IBD11,38,39 showed differential expression in the LPLs from double-deficient Prdm1fl/flMaffl/flCd4Cre and Maffl/flCd4Cre mice and were enriched in Foxp3− effector T cells and ILC may reveal distinct pathological mechanisms of human IBD. Many of these genes have been reported as susceptibility loci for IBD and have highlighted shared genetic risk across populations11,39. For example, Prdm1 has been reported to harbor rare missense mutations in PR domain-containing 1 (PRDM1) associated with IBD, and these mutations resulted in increased T cell proliferation and production of proinflammatory cytokines such as IFNγ12. Moreover, the Notch–STAT3−–Blimp-1–c-Maf axis, shown to be a common anti-inflammatory pathway in T cells, has been shown to be defective in effector CD4+ T cells from patients with Crohn’s disease40.
The increased Ifng and Csf2 expression accompanying the intestinal pathology in the Prdm1fl/flMaffl/flCd4Cre H. hepaticus-infected mice, and to a lesser extent in the single T cell-specific transcription-factor-deficient mice, supports earlier studies in different models of colitis, implicating IFNγ41 and GM-CSF42 in exacerbating intestinal pathology. Although IL-23 receptor signaling has been strongly linked with induction of a TH17 response43, expression of Il23r in LPLs from Prdm1fl/flCd4Cre and Prdm1fl/flMaffl/flCd4Cre mice accompanying high levels of Ifng, but not in the Type 17-dominated response in Maffl/flCd4Cre mice, supports earlier reports of IL-23 in promoting IFNγ production and intestinal inflammation35,44. The significant increase in Il17a expression in the LPLs from H. hepaticus-infected Maffl/flCd4Cre mice supported a major role for c-Maf in negatively regulating IL-17 responses to pathobionts, in keeping with previous in vitro reports highlighting c-Maf as a repressor of TH17 (Il17a and Il22) responses16,45. Given that CD4+ T cells from LPLs of H. hepaticus-infected control mice showed a similar level of expression of Il17a, although not Il22, to that in Maffl/flCd4Cre mice, this suggests that microbiota may be maintaining Il17a expression at the steady state as has been previously described17,32,33. The source of the increased Il17a and Il22 in the total LPLs from H. hepaticus Maffl/flCd4Cre mice above that of infected control mice may be attributed to the increased abundance of TH17 cells or to other IL-17A producers such as ILC3 or γδ-T cells34 and to the heterogeneity of TH17 cells.
Increased Il17a expression in the Maffl/flCd4Cre mice may explain the increased numbers of neutrophils in the colon, as IL-17 has been reported to promote neutrophil recruitment and function during infections, and supports the role of neutrophils in intestinal pathology and their association with human IBD29. Other neutrophil/myeloid-associated genes, PROK2 (prokineticin 2) and FCGR3, which were most highly expressed in the biopsies from ulcerative colitis patients, were most abundant in the LPLs from H. hepaticus-infected Maffl/flCd4Cre mice, potentially underpinning a pathobiologic neutrophil-driven mechanism for human IBD. Cytokines previously associated with IBD, such as Il1a28, Osm11,46 and other myeloid-associated genes were elevated in the LPLs from H. hepaticus-infected Maffl/flCd4Cre but to a lesser extent in double-deficient Prdm1fl/flMaffl/flCd4Cre infected mice. Given that neutrophil numbers, neutrophils and innate immunity-associated genes were increased to a lesser extent in the double-deficient Prdm1fl/flMaffl/flCd4Cre infected mice, this may suggest cross-regulation of the IL-17 responses and neutrophil function by IFNγ47 or by other factors elevated in the absence of Prdm1 in T cells.
Our findings support previous reports that Foxp3+ Treg cells are the major source of Il10 during H. hepaticus infection and are most likely to control intestinal inflammation. Foxp3+RORγt+ Treg cells were almost completely abolished in LPLs from infected Maffl/flCd4Cre mice, as previously reported27, but not in the infected double-deficient Prdm1fl/flMaffl/flCd4Cre mice, which exhibited the maximum pathology and expressed the lowest levels of Il10 in CD4+ T cells, indicating that Foxp3+RORγt+ T cells are not the only IL-10 producing Foxp3+ Treg population regulating intestinal pathology. The source of low levels of Blimp-1 and c-Maf-dependent Il10 expression by Foxp3− T cells could potentially be TH cells or Tr1 cells18,48, which could have arisen by chronic stimulation of TH17 or TH1 cells as previously reported49 or from peripherally induced Treg cells that have lost Foxp3 expression50. The CD4+ T cell source of IL-10 controlling immune responses to limit host damage is likely to be dictated by whether the immune response is to intestinal microbiota, pathobionts, different pathogens or different isolates of the same pathogen, and may change at different stages of infection and/or anatomical locations, as we previously discussed4.
Intestinal IL-10-producing Treg cells, which exert their effects in lymphoid aggregates in the lamina propria, have been recently referred to as Foxp3+ Treg effector cells, expressing Areg, Gzmb, Icos, Tigit, Tnfrsf4 (OX40) and Tnfrsf18 (GITR)34. Although our findings support the increased expression of these effector genes in Foxp3+ Treg cells, these genes were increased to a much greater extent in Foxp3− CD4+ T cells in LPLs from H. hepaticus-infected Prdm1fl/flCd4Cre, Maffl/flCd4Cre and double-deficient Prdm1fl/flMaffl/flCd4Cre mice compared to controls (data not shown). Our findings are in keeping with previous reports that c-Maf controls Treg cell-derived IL-10 and intestinal TH17 responses17,18. However, given that Foxp3− c-Maf-deficient T cells expressed the maximal levels of Il17 in the LPLs from H. hepaticus-infected Maffl/flCd4Cre mice, our data suggest that c-Maf is controlling Il17 expression in non-Treg IL-17-producing effector T cells.
Collectively, our findings show that Blimp-1 and c-Maf cooperate to positively regulate Il10 expression and to directly control genes encompassing the type 1 effector cell responses to prevent severe H. hepaticus-induced colitis. However, Maf uniquely regulated increased Il17a and Il22 expression and an accompanying pronounced signature of neutrophil activation and increased neutrophil numbers. Thus, Blimp-1 and c-Maf control common and distinct gene networks in T cells that regulate qualitatively different CD4+ T cell effector and innate immune responses and subsequent intestinal pathology. DEGs in the LPL of H. hepaticus-infected mice with T cell-specific deletion of Prdm1 or Maf were elevated in colon biopsies from patients with IBD and may help delineate pathways to reveal novel pathobiologic mechanisms of human disease.
Methods
Mice
Mice were bred and maintained under specific-pathogen-free conditions in accordance with the Home Office UK Animals (Scientific Procedures) Act 1986. Age-matched male or female mice were used for experiments. Maffl/fl mice were provided by M. Sieweke and C. Birchmeier (Max Delbrück Centre for Molecular Medicine, Germany)52 and backcrossed to C57BL/6J for ten generations and then crossed to Cd4Cre mice to generate Maffl/flCd4Cre mice as previously described13. Prdm1fl/fl mice were purchased from the Jackson Laboratory, backcrossed to C57BL/6J for four generations and then crossed to Cd4Cre mice to generate Prdm1fl/flCd4Cre mice. Prdm1fl/flMaffl/flCd4Cre and Prdm1fl/flMaffl/fl control mice were generated in-house by crossing Maffl/flCd4Cre with Prdm1fl/flCd4Cre mice. All animal experiments were carried out in compliance with UK Home Office regulations and were approved by The Francis Crick Institute Ethical Review Panel.
H. hepaticus colitis model and antibody treatment
H. hepaticus (NCl-Frederick isolate 1A, strain 51449) was grown under anaerobic gas conditions 10% CO2, 10% H2/N2 (BOC) for 3 days on blood agar plates containing 7% laked horse blood (Thermo Scientific) and the Campylobacter selective supplement ‘Skirrow’ containing the antibiotics trimethoprim, vancomycin and polymyxin B (all from Oxoid). Bacteria were collected and then transferred and expanded, again under the anaerobic gas conditions above, for 3–4 days to an optical density of 0.6 in tryptone soya broth (Oxoid) supplemented with 10% FCS (Gibco) and the antibiotics mentioned above. For infection, mice received 1 × 10⁸ colony-forming units of H. hepaticus by oral gavage using a 22-gauge curved blunted needle on day 0 and day 1. Uninfected mice were housed in the same animal facility and only received antibody treatment. For experiments with anti-IL-10R, 1 mg of either anti-mouse IL-10R (CD210) (Clone 1B1.3A, Rat IgG1, kappa) blocking antibody or Rat IgG1 (Clone GL113, Rat IgG1) isotype control was administered on day 0 and day 7.
Histopathology assessment
To assess the severity of colitis in H. hepaticus-infected mice, in addition to uninfected and steady-state aged mice (age 24–30 weeks), formalin-fixed paraffin-embedded cross-sections of proximal, middle and distal colon were stained with hematoxylin and eosin (H&E) and scored by two board-certified veterinary pathologists on a scale of 0–3 across four parameters to give a maximum score of 12. The four parameters included epithelial hyperplasia and/or goblet cell depletion, leucocyte infiltration into the lamina propria, area affected and markers of severe inflammation, which included crypt abscess formation, submucosal leucocyte infiltration, crypt branching, ulceration and fibrosis. Representative images of H&E-stained colon sections were then taken by the pathologists using a light microscope and a digital camera (Olympus BX43 and SC50).
Histopathology scoring throughout the manuscript is collated in the sections below.
For Extended Data Fig. 1, the baseline histopathology score for Maffl/flCD4Cre was 0 for all 22 mice; for Prdm1fl/flCD4Cre, the score was 0 for 16 mice, two mice had a score of 1 or 2 (reflecting very low-level histological changes) and one exceptional mouse had a score of 5 unaccounted for; for Prdm1fl/flMaffl/flCD4Cre, 28 mice had a score of 0, nine mice had low-level histological changes (seven with a score of 2 and two with a score of 3) and one mouse showed a score of 4. The 36 uninfected aged fl/fl mice had a score of 0.
The following range and median of histopathology scores for the different mice infected with H. hepaticus are as follows: Prdm1fl/flMaffl/flCD4Cre, total of 16 mice with scores of 6–11, median 8; Maffl/flCD4Cre, 14 mice scored 2–9 with a median of 6; Prdm1fl/flCD4Cre, 12 mice scored 2–6 with a median of 3.5; fl/fl controls, 25 mice scored 0–3 with a median of 0, showing a consistent trend of increased colitis from the fl/fl control (no colitis) to Prdm1fl/flCD4Cre to Maffl/flCD4Cre to Maffl/flPrdm1fl/flCD4Cre (severe colitis).
For Extended Data Fig. 6a,d, a large number of uninfected Prdm1fl/flMaffl/flCD4Cre mice (and fl/fl control mice) were needed to pool the numbers needed for performing RNA-seq and ATAC-seq on flow-sorted CD4+ T cells from the colon; in this case, 12 Prdm1fl/flMaffl/flCD4Cre mice were pooled in batches of four, for three biological replicates. The histopathology was examined again by two independent pathologists who reported mild changes in three out of the 12 mice; however, the changes were extremely mild, with none of the three individual mice exhibiting histopathology scores greater than two out of a maximal of 12, and the other nine exhibiting histopathology scores of 0 out of 12. The values in Extended Data Fig. 6a,d for uninfected Prdm1fl/flMaffl/flCD4Cre mice were averages of the pooled mice per replicate.
Immunostaining of colon
Proximal, middle and distal colon formalin-fixed paraffin-embedded cross-sections were de-waxed and re-hydrated before being subjected to automated staining on the Leica BOND Rx Automated Research Stainer. Samples were treated with BOND Epitope Retrieval Solution 1 (Leica AR9961) for CD4 and CD68 antibodies, and BOND Epitope Retrieval Solution 2 (Leica AR9640) for the MPO antibody. To block endogenous peroxidase, samples were incubated in 3% hydrogen peroxide solution (Fisher chemical code H/1750/15) and 1% BSA blocking buffer (BSA Sigma-Aldrich A2153-100G, 1003353538 source SLBX0288). A multiplex panel included antibodies against CD4 (rabbit, Abcam ab183685, clone EPR19514; 1:750 dilution), CD68 (rabbit, Abcam ab283654, clone EPR23917-164; 1:2500 dilution) and MPO (goat, R&D Bio-Techne AF3667; 1:200 dilution). Leica Novolink Polymer (anti-rabbit, RE7161) was used as a secondary detection for primary antibodies raised in rabbit (CD4 and CD68) and horse anti-goat IgG polymer reagent (Impress HRP, Vector Laboratories 30036) for primary antibody MPO raised in goat. Samples were then incubated with Opal 690 (Akoya OP-001006) for CD4, Opal 520 (Akoya OP-001001) for CD68 and Opal 570 (Akoya OP-001003) for MPO, followed by DAPI nuclear counterstain (Thermo Scientific 62248; 1:2500 dilution). Slides were scanned using Akoya’s PhenoImager HT at ×20 and viewed in Akoya inForm Automated Image Analysis Software. Scanned slides were imported into QuPath (version 0.4.3) for image analysis. Cell segmentation was performed using the Stardist extension on the DAPI channel in QuPath. Machine learning was used to train object classifiers on representative regions of each experimental group for CD4, CD68 and MPO markers. Exported data was used to determine the number of positive cells per area (µm2) in the gut sections of the mice.
Isolation of colon LPLs
LPLs were isolated from 1.0–1.5 cm pieces of the proximal, middle and distal colon from individual mice, which were cleaned to remove feces, opened lengthwise and transferred into Dulbecco’s PBS with no Ca2+ or Mg2+ ions (Gibco) containing 0.1% (v/v) bovine serum albumin Fraction V (Roche) (PBS + BSA). To remove the epithelium and intraepithelial lymphocytes, colonic tissue was incubated for 40 min at 37 °C with shaking at 220 rpm in 10 ml of RPMI (Lonza, BE12-702F) supplemented with 5% (v/v) heat-inactivated FCS and 5 mM EDTA (RPMI + EDTA). A second RPMI + EDTA wash was performed as above for 10 min, after which the tissue was left standing at room temperature (37 °C) in 10 ml RPMI (Lonza, BE12-702F) supplemented with 5% (v/v) heat-inactivated FCS and 15 mM HEPES (RPMI + HEPES) to neutralize the EDTA. Tissue was then digested at 37 °C with shaking at 220 rpm for 45 min in 10 ml of RPMI + HEPES with 120 µl of Collagenase VIII added at 50 mg ml−1 in PBS (Sigma). The 10 ml of digested tissue was then filtered through a 70 µM filter into a tube containing 10 ml of ice-cold RPMI + EDTA to neutralize the Collagenase VIII and the cells were centrifuged (1,300 rpm, 7 min, 4 °C). The resulting pellet was then resuspended in 4 ml of 37.5% Percoll (GE Healthcare), diluted in PBS + BSA from osmotically normalized stock and centrifuged (1,800 rpm, 5 min, 4 °C). After centrifugation, the pellet was recovered, resuspended in conditioned RPMI and used for subsequent analysis by flow cytometry and RNA and DNA extractions.
Flow cytometry of colon LPLs
For the analysis of intracellular cytokine expression, isolated colon LPLs from individual mice were transferred to 48-well plates and restimulated with conditioned RPMI media containing 500 ng ml−1 Ionomycin (Calibiochem) and 50 ng ml−1 Phorbol 12-myristate 13-acetate (Sigma-Aldrich) for 2 h, after which 10 µg ml−1 Brefeldin A (Sigma-Aldrich) was added to each well and the cells were incubated for another 2 h. All incubations were conducted at 37 °C in a humidified incubator with 5% carbon dioxide. Following re-stimulation, LPLs were transferred into cold Dulbecco’s PBS with no Ca2+ or Mg2+ ions (Gibco). LPLs were first Fc-blocked for 15 min at 4 °C (24G2, Harlan) and then stained with extracellular antibodies: CD90.2 (53-2.1, PE, Invitrogen), CD4 (RM4-5, BV785, BioLegend), TCR-β (H57-597, APC-e780, Invitrogen), CD8 (53-6.7, BV605, BioLegend) and the UV LIVE/DEAD Fixable Blue dead cell stain (Invitrogen). LPLs were then fixed for 15 min at room temperature with 2% (v/v) formaldehyde (Sigma-Aldrich) and permeabilized for 30 min at 4 °C, using permeabilization buffer (eBioscience) and stained with the following cytokine antibodies for 30 min at 4 °C: IL-17A (eBio17B7, FITC, Invitrogen), IFNγ (XMG1.2, PE-Cy7, BD), IL-10 (JES5-16E3, APC, Invitrogen) and GM-CSF (MP1-22E9, BV421, BD). For transcription factor expression analysis, isolated LPLs remained unstimulated, were Fc-blocked and stained with the same extracellular antibodies, plus Ly6G (1A8, PE-Dazzle, BioLegend), CD11b (M1/70, eFluor450, Invitrogen), CD19 (1D3, BV711, BD Biosciences) and UV dead cell stain as with the restimulated LPLs, and then fixed for 30 min at 4 °C using FoxP3/transcription factor staining kit (eBiosciences). Following permeabilization for 30 min at 4 °C using permeabilization buffer (eBioscience), LPLs were then stained with the following transcription factor antibodies for 30 min at 4 °C: RORγt (Q31-378, AF647, BD) and Foxp3 (FJK-16s, FITC, Invitrogen). After staining, cells were resuspended in sort buffer (2% FBS in PBS + 2 mM EDTA) and analyzed on the Fortessa X20 (BD) flow cytometer. Acquired data was analyzed using FlowJo (version 10), with compensation performed using single-color controls from the cells and AbC total compensation beads (Invitrogen). Flow cytometry plots were concatenated for visualization purposes as follows. Each individual acquisition file was down-sampled to the lowest number of events per genotype, thus resulting in a final concatenated file with an even representation of each individual mouse per group. For intracellular cytokine staining, plots in Extended Data Fig. 4d,e,f, are composed of n = 5 for Prdm1fl/flMaffl/fl and n = 4 for Prdm1fl/flCd4Cre, Maffl/flCd4Cre and Prdm1fl/flMaffl/flCd4Cre. The transcription factor staining plots in Extended Data Fig. 4m are composed of n = 5 for Prdm1fl/flMaffl/fl, n = 2 for Prdm1fl/flCd4Cre, n = 4 for Maffl/flCd4Cre and n = 5 for Prdm1fl/flMaffl/flCd4Cre. The extracellular marker staining plots in Fig. 5f are composed of n = 5 for Prdm1fl/flMaffl/fl, n = 5 for Prdm1fl/flCd4Cre, n = 5 for Maffl/flCd4Cre and n = 4–5 for Prdm1fl/flMaffl/flCd4Cre in each uninfected and infected group.
Sorting by flow cytometry of CD4+ T cells from colon lamina propria
Colon LPLs were isolated as described earlier from individual mice and the cells transferred into cold Dulbecco’s PBS (no Ca2+ or Mg2+ ions) (Gibco). Before being sorted, colon LPLs from individual mice within some experimental groups were equally pooled as follows to allow for the sorting of n = 3–6 biological replicates per experiment. In the uninfected groups for Prdm1fl/flMaffl/fl and Prdm1fl/flMaffl/flCd4Cre, n = 12 mice were pooled to give three biological replicates. For the infected Prdm1fl/flMaffl/fl group, n = 16 mice were pooled to give four biological replicates. For the following infected groups, individual mice were not pooled: Prdm1fl/flMaffl/flCd4Cre (n = 6), Prdm1fl/flCd4Cre (n = 4) and Maffl/flCd4Cre (n = 6). For FACS staining, LPLs were first Fc-blocked for 15 min at 4 °C (24G2, Harlan) and then stained with the extracellular antibodies CD90.2 (53-2.1, PE, Invitrogen), CD4 (RM4-5, BV785, BioLegend), TCR-β (H57-597, APC-eFluor 780, Invitrogen), CD8 (53-6.7, BV605, BioLegend) and the UV LIVE/DEAD Fixable Blue dead cell stain (Invitrogen). Live CD4+ T cells (CD4+TCR-β+CD90.2+CD8−) were then sorted to over 95% purity on the FACS Aria III or FACS Aria Fusion cell sorters (both BD). Sorted cells were then used for subsequent RNA and DNA extractions.
RNA-seq of colon LPLs
RNA was extracted from colon LPLs of individual mice using the QIAShredder and RNeasy Mini Kit with on-column DNase digestion, according to the manufacturer’s instructions (Qiagen). RNA-seq libraries were then made with total RNA using the KAPA RNA HyperPrep with RiboErase and unique multiplexing indexes, according to the manufacturer’s instructions (Roche). All libraries were sequenced using the HiSeq 4000 system (Illumina) with paired-end read lengths of 100 bp and at least 25 million reads per sample.
scRNA-seq of colon LPLs
Isolated colon LPLs from individual mice (as detailed above) were filtered using a 70 µm filter, and cells were suspended in PBS 0.04% BSA (UltraPure BSA, Invitrogen). For each sample, an aliquot of cells was stained with AO/PI Cell Viability Kit (Logos Biosystems) and counted with the LunaFx automatic cell counter. For all samples, cell viability before loading was >80%. As per the manufacturer’s instructions, the Master Mix was prepared as detailed in the Chromium Next GEM Single Cell 3′ Reagent Kit v.3.1 (Dual Index) manual, and 10,000 cells per sample were loaded into the 10× Chromium chips (10× Genomics). The 10× Chromium libraries were prepared and sequenced (paired-end reads) using the NovaSeq 6000 (Illumina).
RNA-seq of sorted CD4+ T cells from colon lamina propria
RNA was extracted from flow-sorted CD4+ T cells isolated from the colon lamina propria of individual mice using the QIAShredder and RNeasy Mini Kit with on-column DNase digestion, according to the manufacturer’s instructions (Qiagen). RNA-seq libraries were then made with total RNA using the NEBNext Single Cell/Low Input RNA Library Prep Kit for Illumina and unique multiplexing indexes, according to the manufacturer’s instructions (New England Biolabs). All libraries were sequenced using the HiSeq 4000 system (Illumina) with paired-end read lengths of 100 bp and at least 25 million reads per sample.
ATAC-seq of sorted CD4+ T cells from colon lamina propria
ATAC-seq samples from isolated LPLs were prepared as outlined in a previous publication53. For each sample, 50,000 cells were lysed in cold lysis buffer containing 10 mM Tris-HCl, pH 7.4, 10 mM NaCl and 3 mM MgCl2, 0.1% Nonidet P40 substitute (all Sigma-Aldrich), and the nuclei were incubated for 2 h at 37 °C with 50 μl of TDE1/TD transposase reaction mix (Illumina). Tagmented DNA was then purified using the MinElute kit (Qiagen) and amplified under standard ATAC PCR conditions: 72 °C for 5 min; 98 °C for 30 s and thermocycling at 98 °C for 10 s, 63 °C for 30 s and 72 °C for 1 min for 12 cycles. Each 50 μl PCR reaction consisted of 10 μl Tagmented DNA, 10 μl water, 25 μl NEBNext High-Fidelity 2× PCR Master Mix (NEB), 2.5 μl Nextera XT V2 i5 primer and 2.5 μl Nextera XT V2 i7 primer (Illumina). Nextera XT V2 primers (Illumina) were used to allow larger-scale multiplexing. These sequences were ordered directly from Sigma (0.2 scale, cartridge) and were diluted to 100 μM with 10 mM Tris-EDTA buffer, pH8 (Sigma) and then to 25 μM with DEPC-treated water (Ambion) for use in the reaction. Following amplification, ATAC-seq libraries were cleaned up using 90 μl of AMPure XP beads (Beckman Coulter) and two 80% ethanol washes while being placed on a magnetic plate stand before being eluted in 1 mM (0.1×) Tris-EDTA buffer, pH8 (Sigma-Aldrich) diluted with DEPC-treated water (Ambion). ATAC-seq libraries were then checked on the TapeStation/BioAnalyser (Agilent) before being sequenced on the HiSeq 4000 system (Illumina), with paired-end read lengths of 50 bp and at least 50–80 million uniquely mapped reads per sample.
Statistical analysis
All figure legends show the number of independent biological experiments performed for each analysis and all replicates. Flow cytometry percentages and associated cell numbers were analyzed as a one-way ANOVA with Tukey’s multiple comparisons test and 95% confidence intervals for statistical analysis. All statistical analyses, apart from sequencing, were carried out with Prism8 software (GraphPad), and the following P values were considered statistically significant: *P ≤ 0.05; **P ≤ 0.01; ***P ≤ 0.001; ****P ≤ 0.0001. Analyses for RNA-seq and ATAC-seq data were performed with R version 3.6.1 and Bioconductor version 3.9. Analyses for scRNA-seq data were performed with R version 4.1 and Seurat version 4.1.1. Error bars and sample sizes used are described in the figure legends.
RNA-seq data processing and analysis
For bulk tissue LPL RNA-seq, adaptors were trimmed using Skewer software version 0.2.2 (ref. 54) with the following parameters: '-m pe -q 26 -Q 28 -e -l 30 -L 100', specifying the relevant adaptor sequences. For sorted CD4+ T cell RNA-seq, adaptors were trimmed using FLEXBAR software55, as recommended by the manufacturer (NEB) when using the NEBNext Single Cell/Low input RNA Library Prep Kit for Illumina. FLEXBAR was run following the provider’s suggested pipeline found at https://github.com/nebiolabs/nebnext-single-cell-rna-seq. For both bulk tissue LPL RNA-seq and sorted CD4+ T cell RNA-seq, reads were aligned to the mm10 genome and the GENCODE reference transcriptome version M22 using STAR software version 2.7.1 (ref. 56), excluding multi-mapping reads by setting the parameter 'outFilterMultimapNmax' to 1. To increase read mapping to novel junctions, the parameter 'twopassMode' was set to 'Basic'. Raw gene counts were retrieved using QoRTs software version 1.1.8 (ref. 57). Normalized read counts were retrieved using DeSeq2 version 1.24.0 (ref. 58) and were rlog transformed to visualize gene quantifications.
Differential gene expression of bulk tissue LPLs by RNA-seq
DeSeq2 (ref. 58) was used to obtain DEGs for each of the four H. hepaticus-infected groups: Prdm1fl/flMaffl/fl, Prdm1fl/flCd4Cre, Maffl/flCd4Cre and Prdm1fl/flMaffl/flCd4Cre against the uninfected Prdm1fl/flMaffl/fl control. A gene was considered to be statistically differentially expressed if the fold change was ≥1.5 and the BH-adjusted P value was <0.05, resulting in:
Prdm1fl/flMaffl/fl infected vs uninfected Prdm1fl/flMaffl/fl: 5 DEGs
Prdm1fl/flCd4Cre vs uninfected Prdm1fl/flMaffl/fl: 1,207 DEGs
Maffl/flCd4Cre vs uninfected Prdm1fl/flMaffl/fl: 1,740 DEGs
Prdm1fl/flMaffl/flCd4Cre vs uninfected Prdm1fl/flMaffl/fl: 3,392 DEGs.
Cell enrichment and biological pathway annotation
The identified DEGs (in any condition) were subjected to k-means clustering using k = 9; the expression values for the DEGs were standardized into z-scores and visualized in a heatmap (Fig. 1f). To provide a biological interpretation of these clusters, each cluster was subjected to 'cell-type enrichment' and 'biological pathways' annotation. The cell-type enrichment analysis used the cell-type signatures from a previous publication51, and a Fisher’s exact test was performed to identify cell-type signatures enriched in each of the clusters. Adjusted P values were obtained using the BH correction. Cell-type signatures that are statistically significantly enriched (adjusted P < 0.05) are shown in Fig. 1g. The R package topGO59 was used to obtain the enriched biological processes in each cluster (Extended Data Fig. 1e). Additionally, an ingenuity pathway analysis (IPA) 'core analysis' (Qiagen, www.qiagen.com/ingenuity) was performed to identify the IPA pathways enriched in each cluster. The Prdm1fl/flMaffl/flCd4Cre versus uninfected Prdm1fl/flMaffl/fl expression values served as input for the calculation of the z-scores in the bar plots depicted in Extended Data Fig. 1e, as this was the comparison that resulted in the highest amount of DEGs.
Differential gene expression in sorted colonic CD4+ T cells
DeSeq2 (ref. 58) was used to obtain DEGs for the uninfected Prdm1fl/flMaffl/flCd4Cre and each of the four H. hepaticus-infected groups: Prdm1fl/flMaffl/fl, Prdm1fl/flCd4Cre, Maffl/flCd4Cre and Prdm1fl/flMaffl/flCd4Cre against the uninfected Prdm1fl/flMaffl/fl control (Extended Data Fig. 6b). A gene was considered to be a statistically differentially expressed if the fold change was ≥1.5 and the BH-adjusted P value was <0.05.
ATAC-seq data processing and analysis
Paired-end ATAC-seq reads from sorted CD4+ T cells were quality controlled and adaptors were trimmed using Skewer software version 0.2.2 (ref. 54) with the following parameters: '-m pe -q 26 -Q 30 -e -l 30 -L 50', specifying 'CTGTCTCTTATACAC' as reference adaptor sequence to remove. The reads were then aligned to the mm10 genome using BWA-MEM60, duplicate reads were removed with Picard61, and SAMtools 1.3.1 (ref. 62) was used to discard discordant alignments and/or low mapping qualities (mapQ < 30). To account for transposase insertion, reads were shifted +4 bp in the forward and −5 bp in the reverse strand; moreover, read-pairs that spanned >99 bp were excluded from further analyses as they would span nucleosomes53. MACS2 (version 2.1.1) was used to identify ATAC-seq peaks using the following parameters: 'parameters–keep-dup all–nomodel–shift -100–extsize 200; q-value < 0.01', to identify enrichment of Tn5 insertion sites63. DiffBind software version 2.0.2 (ref. 64) was used to generate raw counts underlying each ATAC-seq peak. Furthermore, batch correction was performed on raw counts using the RUVSeq R package65 to remove batch effects that resulted from independent experiments. BeCorrect software66 was used to generate batch-corrected bigwig files, using the outputs from RUVseq software. The resulting batch-corrected and normalized counts were used for visualization. The R package ggbio was used to plot the genome browser tracks67. To identify differentially accessible sites of interest for each genotype, differentially accessible sites were subjected to k-means clustering using k = 7; the normalized read counts for the differentially accessible sites were standardized into z-scores and visualized in a heatmap.
ChIP-seq data processing and analysis
Publicly available c-Maf ChIP-seq raw fastq files were obtained from GSE40918 (ref. 16) and Blimp-1 ChIP-seq raw fastq files were obtained from GSE79339 (ref. 68). Trimmomatic (version 0.36) was used for quality control and to trim adaptor sequences using the following parameters: 'HEADCROP:2 TRAILING:25 MINLEN:26' (ref. 69). Trimmed reads were aligned to the mouse genome mm10 with Bowtie version 1.1.2 (ref. 70), with the parameters: 'y -m2–best–strata -S'. MACS2 (version 2.1.1) was used with default parameters to identify ChIP-seq peaks, and peaks with a q-value of <0.01 were defined as statistically significant binding sites. 'bamCoverage' from DeepTools (version 2.4.2) was used to normalize ChIP-seq data to RPKMs, and the R package ggbio was used to visualize the genome browser tracks67 together with the ATAC-seq data.
IPA pathways
TH1 and TH17 pathways were constructed in and obtained from the IPA signaling pathways library. Log2(fold changes) from the differential expression analyses outlined above were overlaid on the TH1 and TH17 pathways, all with a fixed scale of −5 (blue) to 3.5 (red).
scRNA-seq data processing and analysis
Fastq files were aligned to the mm10 transcriptome, and count matrices were generated, filtering for GEM cell barcodes (excluding GEMs with free-floating mRNA from lysed or dead cells) using Cell Ranger (version 6.1.2). Count matrices were imported into R and processed using the Seurat library (version 4.0) following the standard pipeline71. Low-quality cells were removed, with cells kept for further analysis if they met the following criteria: the mitochondrial content was within three standard deviations from the median, more than 500 genes were detected and more than 1,000 RNA molecules were detected. DoubletFinder was used to identify doublets, assuming a theoretical doublet rate of 7.5%72. All samples were integrated using the CCA method, implemented by Seurat’s functions FindIntegrationAnchors() and IntegrateData(), using the top 10,000 variable features and the first 50 principal components. A total of 23 clusters were identified from the integrated dataset and were annotated with the scMCA R library (version 0.2.0) using the single-cell Mouse Cell Atlas as a ref. 73 and the clustifyr R library using the Immgen reference dataset (version 1.5.1). A final manually curated annotation was assigned to clusters based on scMCA and clustifyr results, and this resulted in the annotation of 17 distinct cell clusters. Marker genes for these cell clusters were identified using a Wilcoxon rank-sum test, comparing each cluster to all other clusters, and statistically significant genes (adjusted P < 0.05 and log2(fold change) > 0) were kept for further analysis.
CellChat analysis
Cell-to-cell crosstalk was inferred using the R library CellChat (version 1.1.3)74 and the CellChat mouse database. The CellChat analysis was performed as outlined in the CellChat software manual, with the 'population.size' parameter set to TRUE when computing the communication probability between clusters.
Human IBD RNA expression data analysis
Publicly available human IBD RNA expression datasets were obtained from GSE193677 (adult38) and GSE126124 (paediatric75) and were downloaded and RMA-normalized using the limma package (version 3.50.0). From both datasets, only colon biopsies from healthy controls and colon biopsies from untreated patients were used for further analysis. Normalized log2 expression values of the top 10,000 genes based on variances per dataset were used as input to WGNA (version 1.72.1)76. Gene set modules were detected using a minimum module size of 30, and a deep.split of 2 for both datasets. This resulted in 12 modules for GSE193677 and 18 modules for GSE126124. Gene Ontology biological processes enriched in the modules were annotated using clusterProfiler (version 4.0.5). Using clusterProfiler results and manual curation, a final annotation for some key modules was assigned. Furthermore, modules were tested with Qusage (version 2.26.0) using normalized log2 expression values as input for reciprocal datasets; statistically significant modules (adjusted P < 0.05) were plotted using the ggcorrplot function in R. Genes within the modules derived from WGCNA were converted to mouse gene symbols using the bioMart (version 2.56.1) R library, and genes not expressed in our mouse scRNA-seq dataset generated herein were filtered out. The remaining WGNA module genes were scored in our mouse scRNA-seq dataset using the AddModuleScore() function implemented in the Seurat R library.
Reporting summary
Further information on research design is available in the Nature Portfolio Reporting Summary linked to this article.
Data availability
The materials, data and any associated protocols that support the findings of this study are available from the corresponding author upon request. The RNA-seq datasets have been deposited in the NCBI GEO database under primary accession number GSE240422. Publicly available datasets used in this study include GSE40918 (c-Maf ChIP-seq), GSE79339 (Blimp-1 ChIP-seq), GSE193677 (adult IBD) and GSE126124 (pediatric IBD).
References
Fang, D. & Zhu, J. Molecular switches for regulating the differentiation of inflammatory and IL-10-producing anti-inflammatory T-helper cells. Cell. Mol. Life Sci. 77, 289–303 (2019).
Izcue, A., Coombes, J. L. & Powrie, F. Regulatory lymphocytes and intestinal inflammation. Annu Rev. Immunol. 27, 313–338 (2009).
Neumann, C., Scheffold, A. & Rutz, S. Functions and regulation of T cell-derived interleukin-10. Semin. Immunol. 44, 101344 (2019).
Ouyang, W. & O’Garra, A. IL-10 family cytokines IL-10 and IL-22: from basic xcience to clinical translation. Immunity 50, 871–891 (2019).
Saraiva, M., Vieira, P. & O’Garra, A. Biology and therapeutic potential of interleukin-10. J. Exp. Med. 217, e20190418 (2020).
Kuhn, R., Lohler, J., Rennick, D., Rajewsky, K. & Muller, W. Interleukin-10-deficient mice develop chronic enterocolitis. Cell 75, 263–274 (1993).
Sellon, R. K. et al. Resident enteric bacteria are necessary for development of spontaneous colitis and immune system activation in interleukin-10-deficient mice. Infect. Immun. 66, 5224–5231 (1998).
Kullberg, M. C. et al. Helicobacter hepaticus triggers colitis in specific-pathogen-free interleukin-10 (IL-10)-deficient mice through an IL-12- and gamma interferon-dependent mechanism. Infect. Immun. 66, 5157–5166 (1998).
Roers, A. et al. T cell-specific inactivation of the interleukin 10 gene in mice results in enhanced T cell responses but normal innate responses to lipopolysaccharide or skin irritation. J. Exp. Med. 200, 1289–1297 (2004).
Engelhardt, K. R. & Grimbacher, B. IL-10 in humans: lessons from the gut, IL-10/IL-10 receptor deficiencies, and IL-10 polymorphisms. Curr. Top. Microbiol. Immunol. 380, 1–18 (2014).
Uhlig, H. H. & Powrie, F. Translating immunology into therapeutic concepts for inflammatory bowel disease. Annu. Rev. Immunol. 36, 755–781 (2018).
Ellinghaus, D. et al. Association between variants of PRDM1 and NDP52 and Crohn’s disease, based on exome sequencing and functional studies. Gastroenterology 145, 339–347 (2013).
Gabrysova, L. et al. c-Maf controls immune responses by regulating disease-specific gene networks and repressing IL-2 in CD4+ T cells. Nat. Immunol. 19, 497–507 (2018).
Zhang, H. et al. An IL-27-driven transcriptional network identifies regulators of IL-10 expression across T helper cell subsets. Cell Rep. 33, 108433 (2020).
Cox, L. S. et al. Blimp-1 and c-Maf regulate Il10 and negatively regulate common and unique proinflammatory gene networks in IL-12 plus IL-27-driven T helper-1 cells. Wellcome Open Res. 8, 403 (2023).
Ciofani, M. et al. A validated regulatory network for Th17 cell specification. Cell 151, 289–303 (2012).
Neumann, C. et al. c-Maf-dependent Treg cell control of intestinal TH17 cells and IgA establishes host–microbiota homeostasis. Nat. Immunol. 20, 471–481 (2019).
Xu, M. et al. c-MAF-dependent regulatory T cells mediate immunological tolerance to a gut pathobiont. Nature 554, 373–377 (2018).
Imbratta, C. et al. Maf deficiency in T cells dysregulates Treg–TH17 balance leading to spontaneous colitis. Sci. Rep. 9, 6135 (2019).
Cimmino, L. et al. Blimp-1 attenuates Th1 differentiation by repression of ifng, tbx21, and bcl6 gene expression. J. Immunol. 181, 2338–2347 (2008).
Kallies, A. et al. Transcriptional repressor Blimp-1 is essential for T cell homeostasis and self-tolerance. Nat. Immunol. 7, 466–474 (2006).
Martins, G. A., Cimmino, L., Liao, J., Magnusdottir, E. & Calame, K. Blimp-1 directly represses Il2 and the Il2 activator Fos, attenuating T cell proliferation and survival. J. Exp. Med. 205, 1959–1965 (2008).
Salehi, S. et al. Blimp-1 contributes to intestinal mucosa homeostasis by limiting the number of IL17-producing CD4+ T cells. J. Immunol. 189, 5682–5693 (2012).
Heinemann, C. et al. IL-27 and IL-12 oppose pro-inflammatory IL-23 in CD4+ T cells by inducing Blimp1. Nat. Commun. 5, 3770 (2014).
Ogawa, C. et al. Blimp-1 functions as a molecular switch to prevent inflammatory activity in Foxp3+RORγt+ regulatory T cells. Cell Rep. 25, 19–28.e5 (2018).
Bankoti, R. et al. Differential regulation of effector and regulatory T cell function by Blimp1. Sci. Rep. 7, 12078 (2017).
Xu, J. et al. c-Maf regulates IL-10 expression during Th17 polarization. J. Immunol. 182, 6226–6236 (2009).
Aschenbrenner, D. et al. Deconvolution of monocyte responses in inflammatory bowel disease reveals an IL-1 cytokine network that regulates IL-23 in genetic and acquired IL-10 resistance. Gut 70, 1023–1036 (2021).
Friedrich, M. et al. IL-1-driven stromal–neutrophil interactions define a subset of patients with inflammatory bowel disease that does not respond to therapies. Nat. Med. 27, 1970–1981 (2021).
Mills, E. L. et al. Itaconate is an anti-inflammatory metabolite that activates Nrf2 via alkylation of KEAP1. Nature 556, 113–117 (2018).
Cretney, E. et al. The transcription factors Blimp-1 and IRF4 jointly control the differentiation and function of effector regulatory T cells. Nat. Immunol. 12, 304 (2011).
Gaboriau-Routhiau, V. et al. The key role of segmented filamentous bacteria in the coordinated maturation of gut helper T cell responses. Immunity 31, 677–689 (2009).
Ivanov, I. I. et al. Induction of intestinal Th17 cells by segmented filamentous bacteria. Cell 139, 485–498 (2009).
Gu, Y. et al. Intestinal lamina propria supports acquired eTreg suppressor function. Preprint at https://doi.org/10.1101/2022.08.26.505428 (2023).
Kullberg, M. C. et al. IL-23 plays a key role in Helicobacter hepaticus-induced T cell-dependent colitis. J. Exp. Med. 203, 2485–2494 (2006).
Maloy, K. J. et al. CD4+CD25+ TR cells suppress innate immune pathology through cytokine-dependent mechanisms. J. Exp. Med. 197, 111–119 (2003).
Neumann, C. et al. Role of Blimp-1 in programing Th effector cells into IL-10 producers. J. Exp. Med. 211, 1807–1819 (2014).
Argmann, C. et al. Biopsy and blood-based molecular biomarker of inflammation in IBD. Gut 72, 1271–1287 (2023).
Graham, D. B. & Xavier, R. J. Pathway paradigms revealed from the genetics of inflammatory bowel disease. Nature 578, 527–539 (2020).
Ahlers, J. et al. A Notch/STAT3-driven Blimp-1/c-Maf-dependent molecular switch induces IL-10 expression in human CD4+ T cells and is defective in Crohn’s disease patients. Mucosal Immunol. 15, 480–490 (2022).
Powrie, F. et al. Inhibition of Th1 responses prevents inflammatory bowel disease in scid mice reconstituted with CD45RBhi CD4+ T cells. Immunity 1, 553–562 (1994).
Griseri, T. et al. Granulocyte macrophage colony-stimulating factor-activated eosinophils promote Interleukin-23 driven chronic colitis. Immunity 43, 187–199 (2015).
McGeachy, M. J. & Cua, D. J. The link between IL-23 and Th17 cell-mediated immune pathologies. Semin. Immunol. 19, 372–376 (2007).
Oppmann, B. et al. Novel p19 protein engages IL-12p40 to form a cytokine, IL-23, with biological activities similar as well as distinct from IL-12. Immunity 13, 715–725 (2000).
Rutz, S. et al. Transcription factor c-Maf mediates the TGF-β-dependent suppression of IL-22 production in TH17 cells. Nat. Immunol. 12, 1238 (2011).
West, N. R. et al. Oncostatin M drives intestinal inflammation and predicts response to tumor necrosis factor-neutralizing therapy in patients with inflammatory bowel disease. Nat. Med. 23, 579–589 (2017).
Harrington, L. E. et al. Interleukin 17-producing CD4+ effector T cells develop via a lineage distinct from the T helper type 1 and 2 lineages. Nat. Immunol. 6, 1123–1132 (2005).
Roncarolo, M. G., Gregori, S., Bacchetta, R., Battaglia, M. & Gagliani, N. The biology of T regulatory type 1 cells and their therapeutic application in immune-mediated diseases. Immunity 49, 1004–1019 (2018).
Gagliani, N. et al. Th17 cells transdifferentiate into regulatory T cells during resolution of inflammation. Nature 523, 221–225 (2015).
van der Veeken, J. et al. Genetic tracing reveals transcription factor Foxp3-dependent and Foxp3-independent functionality of peripherally induced Treg cells. Immunity 55, 1173–1184.e7 (2022).
Singhania, A. et al. Transcriptional profiling unveils type I and II interferon networks in blood and tissues across diseases. Nat. Commun. 10, 2887 (2019).
Wende, H. et al. The transcription factor c-Maf controls touch receptor development and function. Science 335, 1373–1376 (2012).
Buenrostro, J. D., Giresi, P. G., Zaba, L. C., Chang, H. Y. & Greenleaf, W. J. Transposition of native chromatin for fast and sensitive epigenomic profiling of open chromatin, DNA-binding proteins and nucleosome position. Nat. Methods 10, 1213–1218 (2013).
Jiang, H., Lei, R., Ding, S.-W. & Zhu, S. Skewer: a fast and accurate adapter trimmer for next-generation sequencing paired-end reads. BMC Bioinf. 15, 182 (2014).
Dodt, M., Roehr, J. T., Ahmed, R. & Dieterich, C. FLEXBAR—flexible barcode and adapter processing for next-generation sequencing platforms. Biology 1, 895–905 (2012).
Dobin, A. et al. STAR: ultrafast universal RNA-seq aligner. Bioinformatics 29, 15–21 (2013).
Hartley, S. W. & Mullikin, J. C. QoRTs: a comprehensive toolset for quality control and data processing of RNA-seq experiments. BMC Bioinf. 16, 224 (2015).
Love, M. I., Huber, W. & Anders, S. Moderated estimation of fold change and dispersion for RNA-seq data with DESeq2. Genome Biol. 15, 550 (2014).
Alexa, A. & Rahnenfuhrer, J. topGO: enrichment analysis for gene ontology https://bioconductor.org/packages/topGO (2010).
Li, H. Aligning sequence reads, clone sequences and assembly contigs with BWA-MEM. Preprint at https://doi.org/10.48550/arXiv.1303.3997 (2013).
Picard toolkit (Broad Institute, 2018); http://broadinstitute.github.io/picard
Li, H. et al. The sequence alignment/map format and SAMtools. Bioinformatics 25, 2078–2079 (2009).
Zhang, Y. et al. Model-based analysis of ChIP-Seq (MACS). Genome Biol. 9, R137 (2008).
Stark, R. & Brown, G. DiffBind: differential binding analysis of ChIP-seq peak data (Bioconductor, 2011); http://bioconductor.org/packages/release/bioc/vignettes/DiffBind/inst/doc/DiffBind.pdf
Risso, D., Ngai, J., Speed, T. P. & Dudoit, S. Normalization of RNA-seq data using factor analysis of control genes or samples. Nat. Biotechnol. 32, 896–902 (2014).
Gontarz, P. et al. Comparison of differential accessibility analysis strategies for ATAC-seq data. Sci. Rep. 10, 10150 (2020).
Yin, T., Cook, D. & Lawrence, M. ggbio: an R package for extending the grammar of graphics for genomic data. Genome Biol. 13, R77 (2012).
Mackay, L. K. et al. Hobit and Blimp1 instruct a universal transcriptional program of tissue residency in lymphocytes. Science 352, 459–463 (2016).
Bolger, A. M., Lohse, M. & Usadel, B. Trimmomatic: a flexible trimmer for Illumina sequence data. Bioinformatics 30, 2114–2120 (2014).
Langmead, B., Trapnell, C., Pop, M. & Salzberg, S. L. Ultrafast and memory-efficient alignment of short DNA sequences to the human genome. Genome Biol. 10, R25 (2009).
Hao, Y. et al. Integrated analysis of multimodal single-cell data. Cell 184, 3573–3587.e29 (2021).
McGinnis, C. S., Murrow, L. M. & Gartner, Z. J. DoubletFinder: doublet detection in single-cell RNA sequencing data using artificial nearest neighbors. Cell Syst. 8, 329–337.e4 (2019).
Han, X. et al. Mapping the mouse cell atlas by Microwell-seq. Cell 172, 1091–1107.e17 (2018).
Jin, S. et al. Inference and analysis of cell–cell communication using CellChat. Nat. Commun. 12, 1088 (2021).
Palmer, N. P. et al. Concordance between gene expression in peripheral whole blood and colonic tissue in children with inflammatory bowel disease. PLoS One 14, e0222952 (2019).
Langfelder, P. & Horvath, S. WGCNA: an R package for weighted correlation network analysis. BMC Bioinf. 9, 559 (2008).
Acknowledgements
We thank The Francis Crick Institute: C. Graham (ex-A.O.G. lab member) for training L.S.C. in RNA library prep for RNA-seq; V. Metzis for advice on ATAC-seq; V. Stavropoulos for lab support; L. Moreira-Teixeira for scientific input and help setting up and conducting in vivo experiments; Biological Services for breeding and maintenance of the mice used for experiments leading up to the current study, specifically, A. Sullivan and team (breeding); Experimental CL2 facility, J. Bee and team and J. Murphy and P. Owers for oral gavage; A. J. Kennedy for helping the take-down of one in vivo experiment performed at the Kennedy Institute with L.S.C. and C.P.; Advanced Sequencing Facility, R. Goldstone and M. Rodriguez for excellent project management of sequencing and D. Jackson and L. Cubitt for support of sequencing; O. O’Neill, Equipment Park for QC; and Experimental Histopathology, E. Nye, M. Green, A. Mikolajczak and team for their excellent work on multiplex immunofluorescent staining of colon sections and for their excellent support in preparing colon sections for histological analyses and E. Herbert for training of A.O.G. lab members; Flow Cytometry members, including A. Riddell, P. Hobson and S. Purewal and team. We thank H. Painter (from the A.O.G. lab, now at London School of Hygiene & Tropical Medicine) for input on the manuscript, including downloading of human datasets from the GEO, careful review of all figures and suggestions for an improved publication, as well as K. Tian for her input into and careful reading of the manuscript. At The Kennedy Institute, we wish to thank the Powrie lab and Kennedy Institute BRF; and A. Janney and E. Mann, who helped with the experimental dissection of H. hepaticus-infected mice; we also thank M. Pohin for her invaluable feedback on the manuscript and signatures. A.O.G. thanks T. Kapellos, H. Zentrum München-Deutsches Forschungszentrum für Gesundheit und Umwelt, for excellent input to approaches to scRNA-seq on neutrophils and bioinformatic analysis options; and M. Lücken (Helmholtz Institute, Germany) for deep discussion and advice on bioinformatic analysis programs for scRNA-seq analyses for interrogating cell–cell interactions.
This study was funded by The Francis Crick Institute, which receives its core funding from Cancer Research UK (FC001126), the UK Medical Research Council (FC001126) and the Wellcome Trust (FC001126), and before that by the UK Medical Research Council (MRC U117565642). A.O.G., L.S.C., M.A.M., V.A.S., X.W. and L.G. were supported by The Francis Crick Institute; S.L.P. and A.S.-B. were funded by the Royal Veterinary College and The Francis Crick Institute. W.J.B. was supported by the A.O.G. Wellcome Investigator Award. C.F.P. and F.P. were supported by a Wellcome Investigator Award to F.P.
Funding
Open Access funding provided by The Francis Crick Institute.
Author information
Authors and Affiliations
Contributions
A.O.G., L.S.C., W.J.B. and M.A.M. co-designed the study, interpreted and analyzed the data. A.O.G. and M.A.M. co-wrote the paper with input from F.P. and W.J.B. C.F.P. and W.J.B. contributed equally to the manuscript and study. All co-authors read and provided feedback for the paper. M.A.M., L.S.C., V.A.S. and W.J.B. conducted in vivo experiments with support from X.W. and A.A.D. at The Crick; L.S.C. and C.F.P. conducted the experiments at The Kennedy Institute; M.A.M., W.J.B., L.S.C. and V.A.S. analyzed the data and interpreted together with A.O.G.; M.A.M. analyzed the ATAC-seq, ChIP-seq, RNA-seq and scRNA-seq data; P.C. analyzed the scRNA-seq and human transcriptomic data obtained from GEO; H.S. performed the 10× Genomics reactions and libraries for the scRNA-seq; X.W. executed the genetics for obtaining and crossing all our T cell-specific transcription-deficient mice and controls, designed and performed all screening and quality control as well as providing input throughout to the study; J.B. provided expert advice and input on the ATAC-seq analysis and on the design of RNA-seq and ATAC-seq experiments and gave feedback on the study and the paper; S.L.P. and A.S.B. conducted all the colon pathology analyses on mice and provided all scoring and expert advice on the pathology data; A.A.D. performed imaging, interpretation and analysis of the immunostained gut sections. A.M. developed, optimized and performed all the immunofluorescent staining for the gut sections and provided advice to A.A.D. L.G. contributed to the original concept of the manuscript and helped review the study and the manuscript.
Corresponding author
Ethics declarations
Competing interests
F.P. received grant funding or consultancy fees from Roche, Genentech, GSK, Janssen, Novartis and T Cypher. The other authors declare no competing interests.
Peer review
Peer review information
Nature Immunology thanks the anonymous reviewers for their contribution to the peer review of this work. Primary Handling Editor: N. Bernard, in collaboration with the Nature Immunology team.
Additional information
Publisher’s note Springer Nature remains neutral with regard to jurisdictional claims in published maps and institutional affiliations.
Extended data
Extended Data Fig. 1 Changes in gene expression regulated by Blimp-1 and c-Maf.
a) Representative H&E colon sections from steady state mice aged to 24-30 weeks, scale bar = 100μm. Data representative of multiple female and male mice: Prdm1fl/fl (n = 8), Prdm1fl/flCd4Cre (n = 19), Maffl/fl (n = 10), Maffl/flCd4Cre (n = 22), Prdm1fl/flMaffl/fl (n = 36), Prdm1fl/flMaffl/flCd4Cre (n = 38) b) Schematic of experimental method used to infect mice with H. hepaticus by oral gavage and treatment with anti-IL-10R blocking antibody. Representative H&E colon sections (scale bar = 100μm) from each genotype following infection with H. hepaticus and treatment with anti-IL-10R antibody and harvested on Day 14 with the corresponding colon histopathology scores (bottom panels). Each dot within the barplots represents an individual mouse analyzed. Graph shows mean ±s.d., analyzed by one-way ANOVA followed by Tukey’s post-hoc test (*=p value ≤ 0.05, **=p value ≤ 0.01, ***=p value ≤ 0.001, ****=p value ≤ 0.0001). c) Unsupervised hierarchical clustering of a pair-wise Spearman correlation and d) PCA plots showing on PC1 the separation of floxed control mice (uninfected and infected) versus H. hepaticus-infected mice with Cd4Cre-mediated deletion of Prdm1, Maf, or Prdm1 and Maf. e) Enriched IPA canonical pathways (left) and gene ontology biological processes (right) were obtained for the clusters of differentially expressed genes arising upon infection and Cd4Cre-mediated deletion of either Prdm1, Maf, or both Prdm1 and Maf (related to Fig. 1f). Data from n = 3−5 mice.
Extended Data Fig. 2 Details of colon scRNA-seq changes by Prdm1 and Maf, or both.
a-c) scRNA-seq was performed on total colon LPL isolated from uninfected Prdm1fl/flMaffl/fl and Prdm1fl/flMaffl/flCd4Cre control mice, and H. hepaticus infected Prdm1fl/flMaffl/fl mice and mice with Cd4Cre-mediated deletion of either Prdm1, Maf, or both Prdm1 and Maf. a) UMAP visualization of the integrated scRNA-seq dataset, plotted per condition and colored by assigned cell cluster. b) Total cell number and c) proportion of cells (%) successfully sequenced and passing quality control (Methods section) in each of the cell clusters identified. Data from n = 2-3 mice.
Extended Data Fig. 3 Top genes in colon scRNAseq clusters in infected mice.
a) Heatmap and b) dotplot (of cell clusters not in Fig. 2e) of the top 10 differentially expressed marker genes of the identified cell clusters in our colon LPL scRNA-seq. Colored by the average gene expression across all cell clusters. In the dotplots, the dot size represents the percentage of cells per cell cluster expressing the gene in question.
Extended Data Fig. 4 Flow cytometry and RNAseq analysis of colon in infected mice.
a) Gating strategy for flow cytometry analysis of colon LPLs. b–d) Percentages from live cells of b) total lymphocytes and c-d) total CD4 + T cells (Live CD90.2 + TCR-β + CD4 + CD8-)) producing IFN-γ, GM-CSF, IL-17A and IL-10. Flow plots of CD4 + T-cells for IFN-γ production versus e) IL-10, f) GM-CSF and g) IL-17A. h) Gating of total CD4 + GM-CSF+ lymphocytes with corresponding flow plots of IFN-γ versus IL-17A. i) Gating of total GM-CSF+ lymphocytes with corresponding flow plots of IFN-γ versus IL-17A with bar plots of j) percentages (from live population) of lymphocytes producing GM-CSF alongside IL-17A, IFN-γ, or both. All flow analyses were performed on from H. hepaticus infected mice. k) Gene expression of Il12rb2, Il12rb1, Il23r, Stat4, Il18r1, Cxcr3 and Csf2 in bulk tissue total colon LPL isolated from uninfected and H. hepaticus infected mice. Differentially expressed genes in each condition against uninfected Prdm1fl/flMaffl/fl mice were marked as follows: *=BH adjusted p value ≤ 0.05, **= BH adjusted p value ≤ 0.01, ***= BH adjusted p value ≤ 0.001, ****= BH adjusted p value ≤ 0.0001.
Extended Data Fig. 5 c-Maf regulates colon RORγt+Foxp3+ cells during infection.
a) Boxplots of log2(normalized read counts) of Rorc and Foxp3 in bulk tissue LPL RNA-seq. b) Flow cytometry analysis of RORγt and Foxp3 transcription factor expression with c) percentages (top) and numbers (bottom) of CD4 + T cells producing of RORγt and/or Foxp3. d) Boxplots of log2(normalized read counts) of Rorc and Foxp3 in sorted CD4 + T cells from colon LPL isolated from uninfected and H. hepaticus infected mice. Differentially expressed genes in each condition against uninfected Prdm1fl/flMaffl/fl mice were marked as follows: *=BH adjusted p value ≤ 0.05, **= BH adjusted p value ≤ 0.01, ***= BH adjusted p value ≤ 0.001, ****= BH adjusted p value ≤ 0.0001.
Extended Data Fig. 6 Changes in T-cell gene expression and chromatin accessibility.
a) Unsupervised hierarchical clustering of a pair-wise Spearman correlation of RNA-seq on sorted CD4 + T cells from colon LPL isolated from uninfected Prdm1fl/flMaffl/fl and Prdm1fl/flMaffl/flCd4Cre, and H. hepaticus infected Prdm1fl/flMaffl/fl mice and mice with Cd4Cre-mediated deletion of either Prdm1, Maf, or both Prdm1 and Maf. b) Number of differentially expressed genes identified in H. hepaticus infected mice compared to uninfected Prdm1fl/flMaffl/fl controls (fold change >=1.5 and BH adjusted p value < 0.05). c) Euler diagram of distinct and overlapping differentially expressed genes between transcription factor-deficient T cells from H. hepaticus infected mice. d) Unsupervised hierarchical clustering of a pair-wise Spearman correlation of ATAC-seq on sorted CD4 + T cells from colon LPL isolated from uninfected Prdm1fl/flMaffl/fl and Prdm1fl/flMaffl/flCd4Cre, and H. hepaticus infected Prdm1fl/flMaffl/fl mice and mice with Cd4Cre-mediated deletion of either Prdm1, Maf, or both Prdm1 and Maf. e) Number of differentially accessible sites identified in H. hepaticus infected mice compared to uninfected Prdm1fl/flMaffl/fl controls (fold change >=1.5 and BH adjusted p value < 0.05). f) Euler diagram of distinct and overlapping differentially accessible sites between transcription factor-deficient T cells from H. hepaticus infected mice. g) Heatmap of accessibility values (represented as z-scores) of accessible sites identified in CD4 + T cells from H. hepaticus infected mice compared to uninfected Prdm1fl/flMaffl/fl controls (fold change >=1.5 and BH adjusted p value < 0.05), partitioned into 7 clusters using k-means clustering. Pathology scores associated to each mouse are shown at the top of the heatmap.
Extended Data Fig. 7 Inference of cell-to-cell communication networks in scRNA-seq.
Cell-to-cell communication networks inferred using CellChat software from gene expression of ligands and their receptors in immune, stromal, epithelial and endothelial cell clusters from the colonic LPL scRNA-seq dataset. a) number and b) strength of interaction of cell-to-cell interactions, represented in the edge width, in and H. hepaticus infected Prdm1fl/flMaffl/fl mice and mice with Cd4Cre-mediated deletion of either Prdm1, Maf, or both Prdm1 and Maf. c) Plot of “Outgoing interaction strength“ against “Incoming interaction strength” across all H. hepaticus infected conditions. In a-b) node size is proportional to the number of cells in each experimental group, and the edges are colored based on the cell clusters expressing the outgoing signals.
Extended Data Fig. 8 Prdm1 and Maf control T cell-IFN-γ and M-CSF pathways.
Cell-to-cell communication networks inferred using CellChat software from gene expression of ligands and their receptors in immune cell clusters of interest from the colonic LPL scRNA-seq dataset. a) Number of interactions of cell-to-cell interactions, represented in the edge width, in and H. hepaticus infected Prdm1fl/flMaffl/fl mice and mice with Cd4Cre-mediated deletion of either Prdm1, Maf, or both Prdm1 and Maf. b) Plot of “Outgoing interaction strength“ against “Incoming interaction strength” across all H. hepaticus infected conditions. c-d) Cell-to-cell communication networks underlying the c) Type II IFN (IFN-γ) and d) M-CSF pathways across all H. hepaticus infected Prdm1fl/flMaffl/fl mice and mice with Cd4Cre-mediated deletion of either Prdm1, Maf, or both Prdm1 and Maf. The chord plot has receiver cells at the top (incoming signaling) and transmitter cells (outgoing signaling) the bottom. The edges are colored based on the cell clusters expressing the outgoing signals. In a,c-d) node size is proportional to the number of cells in each experimental group, and the edges are colored based on the cell clusters expressing the outgoing signals.
Extended Data Fig. 9 Co-localization of colon neutrophils and CD4+ cells.
a) Representative images (n = 4-5) of colon sections by immunofluorescence, staining for CD4 + T cells (CD4, white), mononuclear phagocytes (CD68, magenta), neutrophils (MPO, green) and nuclear staining (DAPI, blue) from uninfected Prdm1fl/flMaffl/fl and Prdm1fl/flMaffl/flCd4Cre, and H. hepaticus infected Prdm1fl/flMaffl/fl mice and mice with Cd4Cre-mediated deletion of either Prdm1, Maf, or both Prdm1 and Maf. Yellow arrows with an “M” point to acellular (no DAPI staining) non-specific mucus staining. Top row shows merged channels with a scale bar = 100μm; in the second row DAPI and MPO channels are shown with a scale bar = 40μm; in the third row DAPI and CD4 channels are shown with a scale bar = 40μm; and in the bottom row DAPI and CD68 channels are shown with a scale bar = 40μm. b) Bar graphs showing the median number of CD4 + , CD68+ and MPO+ cells per area (μm2) in gut sections of each H. hepaticus infected Prdm1fl/flMaffl/fl mice and mice with Cd4Cre-mediated deletion of either Prdm1, Maf, or both Prdm1 and Maf. Data from n = 4-5 mice.
Supplementary information
Supplementary Table 1
Supplementary Table 1.
Supplementary Table 2
Supplementary Table 2.
Supplementary Table 3
Supplementary Table 3.
Supplementary Table 4
Supplementary Table 4.
Supplementary Table 5
Supplementary Table 5.
Supplementary Table 6
Supplementary Table 6.
Supplementary Table 7
Supplementary Table 7.
Supplementary Table 8
Supplementary Table 8.
Rights and permissions
Open Access This article is licensed under a Creative Commons Attribution 4.0 International License, which permits use, sharing, adaptation, distribution and reproduction in any medium or format, as long as you give appropriate credit to the original author(s) and the source, provide a link to the Creative Commons licence, and indicate if changes were made. The images or other third party material in this article are included in the article’s Creative Commons licence, unless indicated otherwise in a credit line to the material. If material is not included in the article’s Creative Commons licence and your intended use is not permitted by statutory regulation or exceeds the permitted use, you will need to obtain permission directly from the copyright holder. To view a copy of this licence, visit http://creativecommons.org/licenses/by/4.0/.
About this article

Cite this article
Alvarez-Martinez, M., Cox, L.S., Pearson, C.F. et al. Blimp-1 and c-Maf regulate immune gene networks to protect against distinct pathways of pathobiont-induced colitis. Nat Immunol (2024). https://doi.org/10.1038/s41590-024-01814-z
Received:
Accepted:
Published:
DOI: https://doi.org/10.1038/s41590-024-01814-z
