Profile
The positions in the table below reflect the University of Chinese Academy of Sciences (UCAS)'s position overall, domestically, within their sector, and in various subject areas based on their Share. Each position links to the corresponding table where University of Chinese Academy of Sciences (UCAS) is listed.
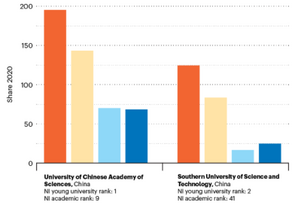
Position by research output Share
Position by research output Share in subject areas
Research
Overall research output
| Count | Share | |
|---|---|---|
| Overall | 3278 | 653.75 |
Overall Count and Share for 'University of Chinese Academy of Sciences (UCAS)' based on the 12-month time frame mentioned above.
Research outputs by subject area
Note: Articles may be assigned to more than one subject area. Hover over the donut graph to view the Share for each subject.
Share output for the past 5 years
Nature Strategy Reports
Identify research insights to guide research strategy and grow your impact with our Nature Strategy reports.
-
Actionable insights into research performance.
-
Detailed analysis of strengths and weaknesses.
-
Covers all major disciplines and regions of the world.
Nature Navigator
Data-driven insights for informed research strategy decisions with AI summarisation technology.
-
Track trends, summarise articles effortlessly.
-
Spark serendipitous discoveries.
-
Uncover collaboration opportunities.
Collaboration
International vs domestic collaboration by Share
| Type | Percentage |
|---|---|
| International (1559 institutions) | 21.8% |
| Domestic (861 institutions) | 78.2% |
Note: Hover over the graph to view the percentage of collaboration.
Top 5 domestic collaborators with University of Chinese Academy of Sciences (UCAS) by Share
Collaborating institutions
Share
Top 5 international collaborators with University of Chinese Academy of Sciences (UCAS) by Share
Collaborating institutions
Share

Latest supplement

Relationships
- University of Chinese Academy of Sciences (UCAS)
- CAS Key Laboratory of Systems Biology, UCAS Hangzhou
- Chongqing General Hospital
- Chongqing Renji Hospital, UCAS
- HuaMei Hospital, UCAS
- Kavli Institute for Theoretical Sciences (KITS), UCAS
- Ningbo No.2 Hospital
- University of Chinese Academy of Sciences (UCAS), Chongqing
- University of Chinese Academy of Sciences (UCAS), Shanghai
- University of Chinese Academy of Sciences Shenzhen Hospital
- Zhejiang Cancer Hospital (ZJCH)
Affiliated joint institutions and consortia
- BESIII Collaboration
- CAS Center for Excellence in Biomacromolecules
- HKU-UCAS Joint Institute of Theoretical and Computational Physics
- Joint Center for Quanta-to-Cosmos Physics
- National Engineering Laboratory for VOCs Pollution Control Material and Technology
- Savaid Medical School, UCAS
- Sino-Danish Centre for Education and Research (SDC)
- UCAS-BGI Education Center
- UCAS-UNESCO International Centre for Theoretical Physics Asia-Pacific (ICTP-AP)
- WIUCAS-FAHWMU Joint Center of Translational Medicine