


 Figure 2
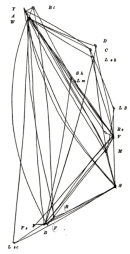


« Prev Next »
Scientists are always searching for the best explanation. In some cases, they will debate conflicting explanations much like politicians debate public policy, with their feet in one camp and with stubborn conviction. However, the primary debate forum for scientists is not the television or newspaper, but rather scholarly peer-reviewed science journals. Thus, in 1919, the pages of the Proceedings of the National Academy of Sciences presented a heated debate between the laboratories of researchers W. E. Castle and T. H. Morgan. Castle argued that Morgan and colleagues' assumptions regarding the organization of genes along a chromosome were "absurd," while Morgan's laboratory suggested that Castle's counterargument could not be "taken seriously." Though both scientists used data to support their views, only one of these men turned out to be correct.
The “Absurd” Assumptions of Morgan and Sturtevant
By the time of the Castle versus Morgan debates in 1919, the chromosome theory of inheritance was generally accepted as a reasonable explanation for how traits are physically transmitted from parent to offspring. The chromosome theory was introduced by W. S. Sutton and confirmed by Nettie Stevens and E. B. Wilson. This theory was then widely advocated and publicized by Wilson in a series of letters to the journal Science. However, Morgan resisted the chromosome theory for many years, and he publicly argued in a series of letters to journals that there were not enough facts to support chromosomes as the sole carriers of heritable traits (Morgan, 1909).
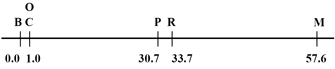
Figure 1: The linear arrangement of the factors.
In Sturtevant’s gene map, six traits are arranged along a linear chromosome according to the relative distance of each from trait B. Trait B is located at the far left of the gene map at position 0.0. Traits C and O are both located 1.0 map unit to the right of trait B. Traits P and R are located in the middle of the gene map, to the right of traits C and O. Trait P is located 30.7 map units away from trait B, and trait R is located 33.7 map units away from trait B. At the far right side of the gene map, trait M is located 57.6 map units away from trait B.
© 1998 Electronic Scholarly Publishing Project Sturtevant, A. H. The linear arrangement of six sex-linked factors in Drosophila, as shown by their mode of association. Journal of Experimental Zoology 14, 43-59 (1913). All rights reserved. 
Ironically, data generated by a student in his own lab finally convinced Morgan to accept the chromosome theory. Soon after, work from Morgan's lab asserted that not only are genes located on chromosomes, but they are also spatially separated from each other by distances calculated from statistical observations of linked traits. Morgan believed that the reason some traits were not independently assorted was due to their close coupling on chromosomes. He predicted that any recombination that occurred during the side-by-side association of homologous pairs would result in the exchange of genetic material, and that genes that were more closely associated were more likely to be exchanged together, thus showing lower crossing-over rates. These ideas connected the concept of recombination with observed crossing-over rates and genetic distance on a chromosome.
A. H. Sturtevant, an undergraduate student working with Morgan, used this idea of linkage to help visualize how a sequence of genes could be arranged along a "linear dimension." While thoroughly examining his recombination data one night, this talented undergraduate realized he could propose a model for how multiple genes could be organized along the length of a chromosome. By the morning, Sturtevant had proposed his first gene map.
Sturtevant’s Ideas
Sturtevant's linear gene map idea could be tested. For example, if genes A, B, and C are located linearly on the same chromosome, then the distance between A and B plus the distance between B and C should equal the distance between A and C. This was a way to link mathematical observations to possible spatial terms.
Sturtevant realized he could test his idea by expanding this analysis to include more than three genes. He thus studied his data from multiple crossing experiments with Drosophila, through which he tracked six different traits. Sturtevant had recorded the number of crossing-over events in each analysis, which was an estimate of how loosely coupled two traits were. The more tightly coupled two traits were, the fewer the number of crossing-over events separating the traits. A statistical distance could be inferred from these measurements, which was a representation of the length between the two traits that took into account how often they were coupled into gametes.
Thus, with the data Sturtevant had about the crossing-over events that separated trait B from other traits, he generated a linear map of five other traits in relation to B (Figure 1). Trait B was set at position zero (0.0), and the distance of the other traits from this location was calculated based on their strength of coupling to B. Then, based on all of his crossing-over data for all six traits in relation to each other, Sturtevant generated a comparison of this prediction with multiple breeding experiments and the proportion of crossing-over events. In particular, he compared the predicted distance between traits, which he called "factors," based on data about the B trait and his observed percent of crossovers (Table 1).
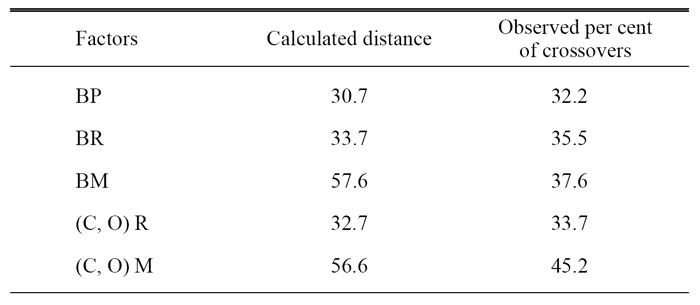
Table 1: Calculated distances and percent crossovers.
© 1998 Electronic Scholarly Publishing Project Sturtevant, A. H. The linear arrangement of six sex-linked factors in Drosophila, as shown by their mode of association. Journal of Experimental Zoology 1, 43–59 (1913). All rights reserved.
Castle’s Counterargument
W. E. Castle found this linear arrangement of traits "doubtful." Indeed, several years after Sturtevant's linear hypothesis was published, Castle presented his doubts in a conference paper, followed by a formal publication in February 1919 (Castle, 1919). Castle actually agreed with the idea that linked traits do not sort as independently as other traits. He also agreed that distances between genes are likely proportional to their crossing-over percentages. However, despite these agreements, Castle wryly pointed to data from both Sturtevant's and Morgan's papers that undermined their own assertions of a strictly linear arrangement.
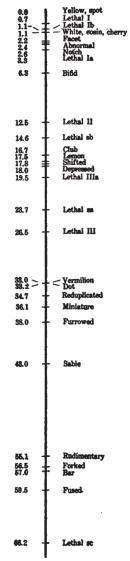
By this point in time, Morgan's lab had generated an extensive map of the Drosophila X chromosome (Figure 2). Castle pointed out two problems with this map. First, five of the genes on the chromosome were more than 50 map units from the end (point 0.0), which Castle said was an impossible measurement. Distance unit measurements above 50 were also present in Sturtevant's comparison table (Table 1). But why would crossing-over percentages greater than 50 spark Castle's doubt and suspicion?Mathematically, a crossover percentage greater than 50% is not possible. Recall that detection of linkage is based on the observed co-occurrence of traits. If traits occur together 50% of the time, then they also occur apart 50% of the time. This means that they do not have a close coupling, and they have a 50-50 chance of sorting together. This is the loosest coupling possible. If traits occur together more often than they do separately, then they show crossing-over events less than 50% of the time, and they are predicted to be more closely associated in space. This crossing-over percentage is therefore a measure of their degree of linkage. Specifically, for genes on the same chromosome, the following statements hold true:
Crossing-over rate < 50% = Linkage
Crossing-over rate = 50% = No linkage
Castle pointed out that crossing-over rates greater than 50% were impossible numbers in Sturtevant's data if these traits were on the same chromosome. He also noted that Morgan's earlier work on sex-linked traits defined these genes as sex-linked and therefore residing on the X chromosome. By this widely accepted definition, these genes were physically linked. Thus, their degree of crossing over must be less than 50%.
With his focus on reconciling mysteriously high crossover rates with a physical model, Castle attempted to explain the spatial relationships with a three-dimensional arrangement. He observed that the calculated distance between A and C was sometimes smaller than AB + BC. This model illustrated genes interconnected by lines based on the same intergene distances predicted by crossing-over rates. Castle also stated that this model didn't necessarily show anything more than a relationship of molecular forces between genes, and it should not be interpreted literally as an organic form (Figure 3). The reason he chose a three-dimensional model was that a wire with A at one end and C at the other had to be bent to represent AC < AB + BC.To further his argument that a linear arrangement was not possible, Castle presented a critical example of mapping distances and locations that did not conform to Sturtevant's linear arrangement hypothesis. In particular, Castle examined the literature and showed that thousands of Drosophila had been screened to determine the distances between the genes corresponding with the traits for bifid (cleft wing), yellow body, and white eyes (Table 2).
Table 2: Distances Between the Genes for Bifid, Yellow Body, and White Eyes, as Summarized by Castle
| Description | Distance | Number of times this distance was observed |
| From bifid gene to yellow-body gene | 5.5 map units | 3,600 observations |
| From bifid gene to white-eye gene | 5.3 map units | 23,595 observations |
| From white-eye gene to yellow-body gene | 1.1 map units | 81,299 observations |
If Morgan and Sturtevant were correct, these measurements mean that the bifid gene would have to be both above and below that for white eyes in order to be arranged linearly. Clearly, this is impossible.
The Counterexample Deflates
Castle's public dispute with the Morgan lab data ignited fervent rebuttal. But with thousands of Drosophila supporting his opinion, how could Castle be wrong? Within several months of Castle's critique, Sturtevant, C. B. Bridges, and Morgan published a response directed toward the bifid evidence Castle described (Sturtevant et al., 1919). The trio pointed out that Castle combined data from independent experiments to show the bifid counterexample. Other investigators had clearly demonstrated that rates of crossover showed variation in different breeding environments, so it was inappropriate to sum data across labs. Sturtevant and his colleagues suggested that the only way to verify the distances between the bifid, yellow-body, and white-eye genes was to follow all three traits in the same experiment. In this single experiment, all conditions would be the same for each trait.
Thus, when comparable data were gathered through a single experiment, the map distances were shown to be considerably different, as outlined in Table 3.
Table 3: Distances Between the Genes for Bifid, Yellow Body, and White Eyes, as Summarized by Sturtevant et al.
| Description | Distance |
| From bifid gene to yellow-body gene | 4.7 map units |
| From bifid gene to white-eye gene | 3.5 map units |
| From white-eye gene to yellow-body gene | 1.2 map units |
These data clearly supported the linear hypothesis, because the distance from the bifid gene to the white-eye gene plus the distance from the white-eye gene to the yellow-body gene was equal to the measured distance between the bifid gene and the yellow-body gene.
But What About Those Mysterious > 50% Crossover Rates?
In their response to Castle, the trio of Sturtevant, Bridges, and Morgan did concede that no one had ever observed crossing over at rates greater than 50%. But, they argued, this was not because such rates did not exist; rather, this was the case because double crossover occurred over these chromosomal distances. Sturtevant et al. asserted that they were actually observing a combination of two different crossing-over events at the same location. In addition, they suggested that Castle had misinterpreted the meaning of calculated distances. According to the trio, distances greater than 50 map units on a chromosome diagram were never "intended to represent observed crossover values greater than 50." Instead, map distances between distant genes merely reflected the sum of distances between intermediate loci. These distances were based on statistical probabilities and should be understood as relative values, rather than concrete lengths of measuring tape (Sturtevant et al., 1919).
Lessons Learned from the Castle and Morgan Debate
In this debate between Castle's and Morgan's labs, there were clearly some misunderstandings about data. However, Castle's criticisms forced Morgan and his colleagues to better describe their data and perform important experiments to clarify their hypothesis. Moreover, their response to Castle's dispute of the linear hypothesis illustrates some fundamental scientific lessons, including the following:
- One should be wary when comparing data from two completely independent experiments. In order to verify the relationship between multiple variables, all variables need to be tested in the same experiment.
- Precise words are key. Linkage was a concept first described by mathematics before physical evidence was ever noted. "Physical linkage" means that genes are located on the same chromosome. But "statistical linkage" means that genes are located close enough together that they are often inherited together, unless crossing over occurs between them. Mathematically, this means that calculating map distances for linked genes would result in a crossing-over percentage less than 50%. However, genes without statistical linkage may still be physically on the same chromosome. Therefore, linkage can be defined by a physical relationship as well as a coactive relationship between traits.
- Deviation from expected results can lead to new discoveries. We often study the simplest examples of biological phenomena, but most often the wider biological world is more complicated. Therefore, a model should continually be reconsidered as new data emerge over time.
Since the 1919 debates, the concept of linear gene arrangement along strands of DNA has held up over other models. Even though chromosomes are highly compacted due to supercoiling, at the level of DNA, genes are arranged linearly. Nearly 100 years after Sturtevant's early work, new techniques in gene mapping have emerged that permit antisense fluorescent tagging at specific gene locations with imaging evidence. These images supplement crossing-over data in the quest to physically map genetic relationships on chromosomes. Though techniques in genetic analysis have advanced in great leaps since the debate between Morgan and Castle, the type of dispute these men had over a biological model is still commonplace within the pages of scientific journals.
References and Recommended Reading
Castle, W. E. Is the arrangement of the genes in the chromosome linear? Proceedings of the National Academy of Sciences 5, 500–506 (1919) (link to article)
Sturtevant, A. H. The linear arrangement of six sex-linked factors in Drosophila, as shown by their mode of association. Science 37, 990–992 (1913) (link to article)
Sturtevant, A. H., et al. The spatial relations of genes. Proceedings of the National Academy of Sciences 5, 168–173 (1919) (link to article)
Morgan, T. H. What are "factors" in Mendelian explanations? American Breeders Association Reports 5, 365–368 (1909) (link to article)
Morgan, T. H., & Bridges, C. B. Sex-Linked Inheritance in Drosophila (Washington, DC, Carnegie Institute of Washington, 1916) (link to article)
Wilson, E. B. The chromosomes in relation to the determination of sex in insects. Science 22, 500–502 (1905) (link to article)


