


« Prev Next »
Karyotyping is the process of pairing and ordering all the chromosomes of an organism, thus providing a genome-wide snapshot of an individual's chromosomes. Karyotypes are prepared using standardized staining procedures that reveal characteristic structural features for each chromosome. Clinical cytogeneticists analyze human karyotypes to detect gross genetic changes—anomalies involving several megabases or more of DNA. Karyotypes can reveal changes in chromosome number associated with aneuploid conditions, such as trisomy 21 (Down syndrome). Careful analysis of karyotypes can also reveal more subtle structural changes, such as chromosomal deletions, duplications, translocations, or inversions. In fact, as medical genetics becomes increasingly integrated with clinical medicine, karyotypes are becoming a source of diagnostic information for specific birth defects, genetic disorders, and even cancers.
Preparing Karyotypes from Mitotic Cells
Karyotypes are prepared from mitotic cells that have been arrested in the metaphase or prometaphase portion of the cell cycle, when chromosomes assume their most condensed conformations. A variety of tissue types can be used as a source of these cells. For cancer diagnoses, typical specimens include tumor biopsies or bone marrow samples. For other diagnoses, karyotypes are often generated from peripheral blood specimens or a skin biopsy. For prenatal diagnosis, amniotic fluid or chorionic villus specimens are used as the source of cells.
The process of generating a karyotype begins with the short-term culture of cells derived from a specimen. After a period of cell growth and multiplication, dividing cells are arrested in metaphase by addition of colchicine, which poisons the mitotic spindle. The cells are next treated with a hypotonic solution that causes their nuclei to swell and the cells to burst. The nuclei are then treated with a chemical fixative, dropped on a glass slide, and treated with various stains that reveal structural features of the chromosomes.
Banding Patterns Reveal the Structural Details of Chromosomes
Without any treatment, structural details of chromosomes are difficult to detect under a light microscope. Thus, to make analysis more effective and efficient, cytologists have developed stains that bind with DNA and generate characteristic banding patterns for different chromosomes. Prior to the development of these banding techniques, distinguishing chromosomes from one another proved very difficult, and chromosomes were simply grouped according to their size and the placement of their centromeres.
This changed in 1970, when Torbjorn Caspersson and his colleagues described the first banding technique, known as Q-banding. Q-banding involves use of the fluorescent dye quinacrine, which alkylates DNA and is subject to quenching over time. Caspersson et al. demonstrated that quinacrine produced characteristic and reproducible banding patterns for individual chromosomes. Since then, researchers have developed a variety of other chromosome banding techniques that have largely supplanted Q-banding in clinical cytogenetics. Today, most karyotypes are stained with Giemsa dye, which offers better resolution of individual bands, produces a more stable preparation, and can be analyzed with ordinary bright-field microscopy.
The molecular causes for staining differences along the length of a chromosome are complex and include the base composition of the DNA and local differences in chromatin structure. In G-banding, the variant of Giemsa staining most commonly used in North America, metaphase chromosomes are first treated briefly with trypsin, an enzyme that degrades proteins, before the chromosomes are stained with Giemsa. Trypsin partially digests some of the chromosomal proteins, thereby relaxing the chromatin structure and allowing the Giemsa dye access to the DNA.
In general, heterochromatic regions, which tend to be AT-rich DNA and relatively gene-poor, stain more darkly in G-banding. In contrast, less condensed chromatin—which tends to be GC-rich and more transcriptionally active—incorporates less Giemsa stain, and these regions appear as light bands in G-banding. Most importantly, G-banding produces reproducible patterns for each chromosome, and these patterns are shared between the individuals of a species. An example of Giemsa-stained human chromosomes, as they would appear under a microscope, is shown in Figure 1a. Typically, Giemsa staining produces between 400 and 800 bands distributed among the 23 pairs of human chromosomes. Measured in DNA terms, a G-band represents several million to 10 million base pairs of DNA, a stretch long enough to contain hundreds of genes.
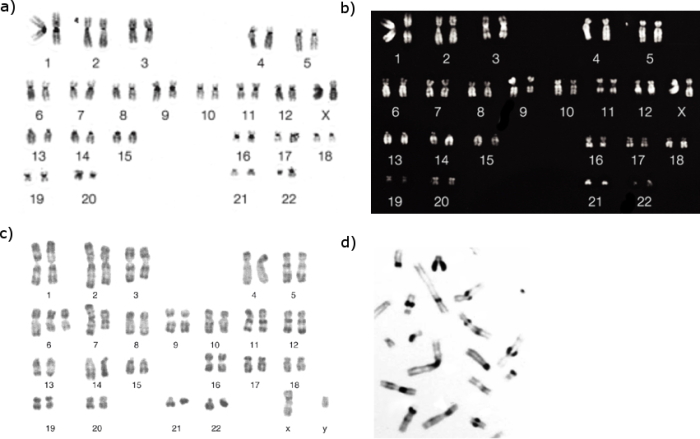
Figure 1: Chromosome banding revealed by different staining techniques.
Different chromosomal staining techniques reveal variations in chromosome structure. Cytogeneticists use these patterns to recognize the differences between chromosomes and enable them to link different disease phenotypes to chromosomal abnormalities. Giemsa banding (a), Q-banding (b), R-banding (c) and C-banding (d) are shown.
© 2001 Nature Publishing Group Rowley, J. Chromosome translocations. Nature Reviews Cancer 1, 246; Stamatoullas, A. et al. Conventional cytogenetics of nodular lymphocyte-predominant Hodgkin's lymphoma. Leukemia 21, 2065; Vega, H. et al. Roberts syndrome is caused by mutations in ESCO2, a human homolog of yeast ECO1 that is essential for the establishment of sister chromatid cohesion. Nature Genetics 35, 469 (2001). All rights reserved. 
G-banding is not the only technique used to stain chromosomes, however. R-banding, which is used in parts of Europe, also involves Giemsa stain, but the procedure generates the reverse pattern from G-banding. In R-banding (Figure 1c), the chromosomes are heated before Giemsa stain is applied. The heat treatment is thought to preferentially melt the DNA helix in the AT-rich regions that usually bind Giemsa stain most strongly, leaving only the comparatively GC-rich regions to take up the stain. R-banding is often used to provide critical details about gene-rich regions that are located near the telomeres.
Yet another method is C-banding (Figure 1d), which can be used to specifically stain constitutive heterochromatin, or genetically inactive DNA, but it is rarely used for diagnostic purposes these days. C-banding is a specialized Giemsa technique that primarily stains chromosomes at the centromeres, which have large amounts of AT-rich satellite DNA.
The first method to be used to identify all 46 human chromosomes was Q-banding (Figure 1b), which is achieved by staining the chromosomes with quinacrine and examining them under UV light. This method is most useful for examining chromosomal translocations, especially ones involving the Y chromosome. Taken together, these banding techniques offer clinical cytogeneticists an arsenal of staining methods for diagnosing chromosomal abnormalities in patients.
Organizing Chromosomes in Karyograms for Review
In order to maximize the diagnostic information obtained from a chromosome preparation, images of the individual chromosomes are arranged into a standardized format known as a karyotype, or more precisely, a karyogram (Figure 1a-c). According to international conventions, human autosomes, or non-sex chromosomes, are numbered from 1 to 22, in descending order by size, with the exceptions of chromosomes 21 and 22, the former actually being the smallest autosome. The sex chromosomes are generally placed at the end of a karyogram.
Within a karyogram, chromosomes are aligned along a horizontal axis shared by their centromeres. Individual chromosomes are always depicted with their short p arms—p for "petite," the French word for "small"—at the top, and their long q arms—q for "queue"—at the bottom. Centromere placement can also be used to identify the gross morphology, or shape, of chromosomes. For example, metacentric chromosomes, such as chromosomes 1, 3, and 16, have p and q arms of nearly equal lengths. Submetacentric chromosomes, such as chromosomes 2, 6, and 10, have centromeres slightly displaced from the center. Acrocentric chromosomes, such as chromosomes 14, 15, and 21, have centromeres located near their ends.
Arranging chromosomes into a karyogram can simplify the identification of any abnormalities. Note that the banding patterns between the two chromosome copies, or homologues, of any autosome are nearly identical. Some subtle differences between the homologues of a given chromosome can be attributed to natural structural variability among individuals. Occasionally, technical artifacts associated with the processing of chromosomes will also generate apparent differences between the two homologues, but these artifacts can be identified by analyzing 15–20 metaphase spreads from one individual. It is highly unlikely that the same technical artifact would occur repeatedly in a given specimen.
Using Karyograms to Detect Chromosomal Abnormalities
Today, G-banded karyograms are routinely used to diagnose a wide range of chromosomal abnormalities in individuals. Although the resolution of chromosomal changes detectable by karyotyping is typically a few megabases, this can be sufficient to diagnose certain categories of abnormalities. For example, aneuploidy, which is often caused by the absence or addition of a chromosome, is simple to detect by karyotype analysis. Cytogeneticists can also frequently detect much more subtle deletions or insertions as deviations from normal banding patterns. Likewise, translocations are often readily apparent on karyotypes.
When regional changes in chromosomes are observed on karyotypes, researchers often are interested in identifying candidate genes within the critical interval whose misexpression may cause symptoms in patients. This search process has been greatly facilitated by the completion of the Human Genome Project, which has correlated cytogenetic bands with DNA sequence information. Consequently, investigators are now able to apply a range of molecular cytogenetic techniques to achieve even higher resolution of genomic changes. Fluorescence in situ hybridization (FISH) and comparative genomic hybridization (CGH) are examples of two approaches that can potentially identify abnormalities at the level of individual genes.
Molecular cytogenetics is a dynamic discipline, and new diagnostic methods continue to be developed. As these new technologies are implemented in the clinic, we can expect that cytogeneticists will be able to make the leap from karyotype to gene with increasing efficiency.
References and Recommended Reading
Caspersson, T., Zech, L., & Johansson, J. Differential banding of alkylating fluorochromes in human chromosomes. Experimental Cell Research 60, 315–319 (1970) doi:10.1016/0014-4827(70)90523-9
Gartler, S. M. The chromosome number in humans: A brief history. Nature Reviews Genetics 7, 655–660 (2006) doi:10.1038/nrg1917 (link to article)
Speicher, M. R., Ballard, S. G., & Ward, D. C. Karyotyping human chromosomes by combinatorial multi-fluor FISH. Nature Genetics 12, 368–375 (1996) (link to article)
Strachan, T., & Read, A. P. Human Molecular Genetics, 2nd ed. (Wiley, New York, 1999)
Tjio, J. H., & Levan, A. The chromosome number of man. Hereditas 42, 1–6 (1956)
Trask, B .J. Human cytogenetics: 46 chromosomes, 46 years and counting. Nature Reviews Genetics 3, 769–778 (2002) doi:10.1038/nrg905 (link to article)


