
Abstract
Predictive maintenance harnesses statistical analysis to preemptively identify equipment and system faults, facilitating cost- effective preventive measures. Machine learning algorithms enable comprehensive analysis of historical data, revealing emerging patterns and accurate predictions of impending system failures. Common hurdles in applying ML algorithms to PdM include data scarcity, data imbalance due to few failure instances, and the temporal dependence nature of PdM data. This study proposes an ML-based approach that adapts to these hurdles through the generation of synthetic data, temporal feature extraction, and the creation of failure horizons. The approach employs Generative Adversarial Networks to generate synthetic data and LSTM layers to extract temporal features. ML algorithms trained on the generated data achieved high accuracies: ANN (88.98%), Random Forest (74.15%), Decision Tree (73.82%), KNN (74.02%), and XGBoost (73.93%).
Introduction
The advent of Industry 4.0, as defined by1,2, has revolutionized traditional manufacturing processes and business models. Industry 4.0 represents the fourth industrial revolution, integrating digital technologies, automation, data exchange, and the Internet of Things (IoT) to transform traditional manufacturing processes into interconnected and intelligent production systems. In the era of Industry 4.0, unplanned downtime’s are of major concern because they are believed to cause high drops in productivity. According to3 unplanned downtime roughly accounts for 5–20% of such drops. A proactive maintenance approach is therefore crucial for minimizing unplanned downtime, making the most out of available resources, and increasing output1. Predictive maintenance(PdM) has proven to be such an approach. It entails the use of statistical analysis of historical data to identify eminent faults in equipment and systems before time. This way, maintenance operations can be carried out in time hence reducing unexpected stops.
The use of machine learning algorithms in data analytics has seen rapid growth over the recent past4. In PdM, such algorithms enable the analysis of past occasions, the identification of emerging patterns, and the accurate prediction of future outcomes based on the acquired insight5,6,7. Such insights simplify maintenance procedures and consequently improve resource utilization8. Moreover, predictive maintenance datasets involve many crucial variables like device importance, accessible resources, and operational limitations9. This makes ML techniques more desirable as they are fast and can seamlessly process vast parameters delivering insights in time, enabling timely preparation for potential breakdowns10. Besides conventional machine learning methods, the application of deep learning (DL) and reinforcement learning (RL) has become a major area of research in PdM11. With reinforcement learning machines perfect maintenance processes, and can perform them autonomously resulting in improved performance and efficiency12.
Two common outcomes of interest in PdM are fault diagnosis and categorization13,14, and Remaining Useful Life (RUL) prediction. In fault diagnosis, algorithms learn the normal patterns from the training data and then flag any observations that significantly deviate from the learned patterns15. Such observations are thought of as indicative of abnormalities in the system and possibly impending failure. For RUL, the algorithms learn to predict the remaining useful life of a component from its performance. With these two maintenance decisions can be made in time, either manually or by a decision-making agent trained through reinforcement.
As academics and practitioners strive to optimize maintenance methods and avoid costly equipment failures by using data and artificial intelligence, various research literature on the application of ML in PdM has emerged16,17. Due to the diversity of machinery in industries and their performance patterns during different faulty conditions, PdM datasets tend to be diverse. Specializations therefore play a significant role in model choice. For instance, Random Forest (RF) algorithms work better with independent observations, while Long Short-Term Memory (LSTM) neural networks have proven effective with sequential data such as time series18,19,20. The numerous literatures test different ML models in numerous business settings to establish their adaptability and efficacy9,18. Researchers have identified common problems while dealing with different case studies. Data scarcity, feature selection from abundant sensor data properties, data imbalance, and temporal relationships in data are among these difficulties21,22,23.
Machine learning approaches, especially deep learning, typically require large datasets to adequately learn failure patterns. The availability of such data can be a challenge, especially for new systems or components where there is insufficient historical data. Several reviewed literature have reported this challenge. For instance, Ganesan et al.24, who employed specialized modeling where different models were developed with data from each component of interest, acknowledge the challenge as a limitation to the approach. Rojek et al.25 encountered challenges related to data availability, reliability, and completeness while applying AI techniques in PdM. Another study26. Attempted to address data scarcity by employing simulation to generate PdM data for automotive engine components. However, they further encountered issues with computational cost and feasibility in real-world applications. Data imbalance is another challenge that arises from the fact that there are typically few failure instances in maintenance datasets. Models trained on such datasets often do not have enough failure cases to learn from. Susto et al.16. Addressed this issue by introducing prediction horizons, where the most recent ’m’ instances in each run are segregated as failures and the preceding ’n-m’ instances as non-failures. The temporal nature of sensor data, where readings are collected over time, also presents complexities due to sequential dependence between readings. This can impact common feature extraction types such as those involving statistical moments. Another study13,27 proposes the use of specialized networks such as GRUs and LSTMs during feature extraction to learn the temporal patterns. Such feature learnings also help avoid feature selection which can degrade data quality. A research gap exists concerning the need for a robust PdM approach that addresses the challenges of data scarcity, temporal dependence in sensor data, data imbalance, and limitations of feature selections. This study proposes a machine learning-based architecture, which adapts to the above problems through:
-
Generation of synthetic data with patterns of relationship similar to those in observed data, but not identical to the observed data, to address the issue of data scarcity28,29,30, using a Generative Adversarial Network(GAN).
-
Creation of failure horizons around failure observations like in16, to solve the issue of data imbalance that arises while using run-to-failure datasets.
-
Deployment of Long Short Term Memory (LSTM) neural networks proposed by18, as an alternative to statistical moments to extract temporal patterns before the application of traditional machine learning models.
-
Integration of AI techniques into maintenance practices, as explored by1, can significantly enhance maintenance strategies. This enhancement leads to improved failure prediction accuracy, reduced costs, and increased operational efficiency.
The remaining part of the paper is organized into the methods section which is the methodology that outlines the proposed architectures. Results section, which reports the results of the implementation. Finally, the conclusion section which presents the research conclusions, which concludes the analysis, limitations, and future research directions are provided.
Methods
Data Collection, cleaning and prepossessing
The study utilizes Production Plant Data for Condition Monitoring retrieved from the Kaggle data repository31. The data is from the IMPROVE project that seeks to monitor production plant conditions for non-woven materials, predicting component conditions through 8 run-to-failure experiments32. Data cleaning and preprocessing included the creation of data labels and one hot encoding of the labels. Sensor readings were normalized with min–max scaling to maintain consistency in scale33. The final data consists of 228,416 observations in the healthy category against 8 failure observations at the end of each run. This indicates a serious data imbalance issue. Overall the data consisted of 0.01% missing cases in each column.
Addressing data scarcity
The application of machine learning in PdM carries over the general limitations associated with ML techniques. One such limitation is the need for large data for the models to learn enough patterns to predict future values correctly23,34,35. With the intensified effort to minimize costs by preventing equipment breakdowns and downtime in Industry 4.0, failure instances are rare, which means longer times are needed to gather enough data to train models. This makes dealing with data scarcity one of the fundamental issues in predictive maintenance36. Generative Adversarial Networks (GANs) have been mentioned in other fields as a feasible solution to data scarcity23. This study proposes the use of GANs to generate synthetic run-to-failure data with runs similar to the collected data to make the data large enough to train ML models.
The Adversarial Networks (GANs) consist of two neural networks: the Generator (G) and the Discriminator (D) which engage in a perpetual adversarial competition, each having a specific role.
-
Generator (G): The generator creates synthetic data. It takes a random noise vector or vector of random values as input and learns to map this input to data points that closely resemble the target dataset. Initially, the generator produces random, nonsensical data. However, it gradually refines its output through iterative training to generate data that becomes progressively more indistinguishable from the training data;
-
Discriminator (D): The discriminator, on the other hand, acts as a binary classifier. It is provided with input data, which can either be real data from the training set or fake data generated by the generator. The discriminator’s task is to distinguish between these two types of data by classifying the input as real or fake. During training, the discriminator learns to become increasingly proficient at this binary classification task, thus becoming more accurate;
The hallmark of GANs is adversarial training. In this process, the generator and discriminator are trained concurrently in a mini-max game. The objective is two-fold, the generator aims to produce synthetic data virtually indistinguishable from real data. In essence, it seeks to deceive the discriminator. The discriminator, conversely, aims at correctly classifying real data as genuine and fake data as counterfeit. The adversarial competition in GAN training results in a dynamic equilibrium where the generator continually refines its ability to produce challenging data for discrimination37. while the discriminator refines the ability to distinguish generated data from real training data. This equilibrium signifies successful GAN training. The trained generator can therefore be used to generate synthetic data to train the ML models38. Figure 1 below visualizes the structure of a typical GANs model. With the GAN-generated data in hand, our methodology diverges into two primary paths: a classification path and a regression path.
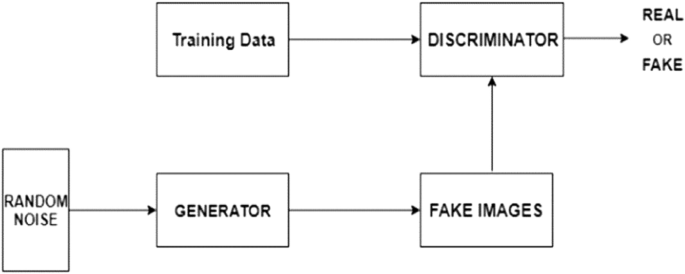
GAN Training Architecture38.
Classification path
The classification path result is the categorization of machinery state into ’healthy’ or ’failure’ classes. The healthy class denotes that the machine is in a healthy working status while failure denotes impending failure.
Addressing data imbalance
With failure conditions being rare in PdM data, owing to proactive maintenance in Industry 4.0, available datasets are highly imbalanced because the components are mostly in a healthy status rather than a failure status. In run-to-failure data, for instance, only the last observation in each run is a failure, which results in the data having many healthy cases against few failure cases. To address this issue, failure horizons were first created as proposed by Susto et al.16, where the component’s last ‘n’ observations before a failure event are labeled as ‘failure’, while the rest are labeled as ‘healthy’. This increases the number of failure observations in each run by ‘n’. Moreover, these horizons represent a temporal window preceding a machine failure where the machine is believed to exhibit failure patterns (signs). Figure 2 below visualizes the process of making the horizons.

A depiction of 4- horizon categorization.
This assures enough cases on the failure group for the models to learn the characteristics of a system descending to failure. The value of ‘n’ is a trainable parameter chosen via hyperparameter tuning.
Addressing temporal dependence and feature selection
In predictive maintenance, data is collected from the same components or system continuously over time to help under- stand the component’s behavior and failure patterns, this way observations collected from the same sensor are temporally dependent39,40. For instance, the scenario where a bolt becomes loose within a machine:
-
Vibration Sensors: Loosening bolts may cause more machine vibrations thereby resulting in severe damage. This way the readings from vibration sensors would show a multiplicative trend where the measurements of vibration increase over time. Thus, the dynamic correlation between vibration and machine health reveals that sensor readings rely on previous data.
-
Temperature Sensors: Similarly, mechanical problems may influence the temperature sensors hence causing temporal dependence of previous readings and influencing the current temperature readings.
Extracting these temporal dependencies is important as it can help predict future failures. On the other hand feature selection entails scanning the entire feature space to identify an optimal feature set that doesn’t contain redundant and irrelevant features41. Major challenges with feature selection is the possibility of ignoring feature dependencies42, getting unstable features43 and also inability to exploit all possible feature when the feature space is large. Employing feature learning approach can help evade most of these selection problems.
Recurrent Neural Networks (RNN) are a family of Artificial Neural Networks specialized for processing sequential data such as temporal dependencies. The network features an internal state that help the model to remember past information while processing the current information44. A major challenge in RNNs is the vanishing gradient problem. The gradients of the loss function concerning the parameters of the network become extremely small as they are back-propagated from the output layer to the earlier layers during training45. Long Short-Term Memory (LSTM) networks are RNNs specialized to handle the vanishing gradient problem by having a complex memory cell instead of simple recurrent connections46. The memory cell features three gates which include; A forget gate that determines what information to forget from the memory cell, an input gate that determines what new information to store in the cell and an output cell that determines what information to output from the cell46. This gating mechanism allows gradients to flow more freely through time enabling the network to capture long-range dependencies in sequential data. The proposed methodology employed Long Short-Term Memory (LSTM) networks to extract temporal patterns from the sensor data, improving our feature set for analysis.
Classification
The temporal features learned by the LSTM were subsequently utilized to train machine learning classifiers. A variety of classification algorithms were employed, including Artificial Neural Networks (ANN), Support Vector Machines (SVM), Decision Trees (DT), K-Nearest Neighbors (KNN), Random Forest (RF), and Extreme Gradient Boosted Classifier (XGBoost). The output of the classifiers is a classification of the component status as ’healthy’ or ’failure’, indicating whether the component is healthy or descending into failure.
Regression path
Other than the classification path, our methodology introduces a regression-oriented approach. In this context, the focus shifts from categorizing runs into ‘healthy’ and ‘failure’ classes to predicting the Remaining Useful Life (RUL) of the machinery. RUL represents the number of useful operational days remaining before a machine is expected to fail. Because RUL is a quantitative variable, the data imbalance issue doesn’t apply.
Addressing temporal dependence and feature selection
The regression path employs the same approach as the classification path to handle temporal dependence. LSTM architecture is utilized to learn temporal features from the GAN-generated data, which are valuable in training ML algorithms to predict the Remaining Useful Life (RUL).
Regression models
The LSTM-extracted features were passed to a suite of regression models. These models are designed to predict the Remaining Useful Life (RUL) of the machinery, providing valuable insights into how many operational days remain before potential failure. The regression models employed include: Artificial Neural Networks (ANN), Support Vector Regressor (SVR), Decision Trees Regressor (DT), K-Nearest Neighbors Regressor (KNN), Random Forest Regressor (RF), and Extreme Gradient Boosted Regressor (XGBoost). These models can quantitatively estimate the RUL of the machinery, providing maintenance personnel with actionable information on when maintenance actions should be taken. Figure 3 below visualizes the steps of the proposed methodology.

Machine learning solution architecture.
Proposed models
Artificial neural networks (ANN)
Artificial Neural Networks are deep learning models capable of learning complex relationships within data. They function through three primary layers: the input layer, hidden layer, and output layer24. The input layer receives data and assigns activation values, while the hidden layer performs core computations and applies an activation function to standardize the output13. Several hidden layers can be stacked together to form a deep neural network. The output layer presents the outcome using a cost function, indicating the network’s proximity to achieving the desired result. The activation value moves from input to output nodes, where weights are adjusted and the cost function measures the difference between actual and projected output, enhancing network performance. Two key processes are introduced to minimize the cost function and enhance the network’s performance;
-
(1)
Back Propagation: This involves neural network training where weights are adjusted to boost model precision and accuracy, minimize error rates, and minimize cost function value.
-
(2)
Forward Propagation: Data enters through the input layer, and moves forward through the network to obtain the output, which is then compared to the anticipated results.
Subsequent steps encompass error computation and backward propagation, which enables weight adjustments. This structured algorithm allows for the concurrent adjustment of weights, thereby helping identify which weights contribute to errors.
K nearest neighbour (KNN)
A KNN model is a supervised learning model that predicts new cases based on the labels of the most similar cases in the training set. The model requires users to choose a parameter K, which represents the number of neighbors to consider. It computes the distance between the new case and all cases in the training set using distance metrics such as Euclidean distance, then determines the K nearest cases to the new case. Subsequently, the new case is labeled with the most common label among the K neighbors in the case of classification47, or with the average of the labels of the K nearest neighbors for regression tasks48.
Decision tree
In classification context DT works through binary splitting to categorize data into multiple outcomes. The process begins with a single node and proceeds to split the training data into subgroups (nodes) according to the feature most correlated with the outcome variable49,50. Each subgroup is then further divided based on the feature most associated with the outcome variable within those subgroups. This process continues until all nodes become pure or are unable to be split further. The primary measures of node impurity/purity are typically Gini and entropy. In regression context, splitting is similar to classification, but the splitting objective is to sum of squared residuals at the leaf node51.
Random forest
Random Forest is an advancement of the decision tree, where instead of building a single decision tree that is prone to over fitting, multiple decision trees are built as ensembles from the training set, resulting in a forest of decision trees. The algorithm first takes n bootstrap samples from the training set and builds a tree on each sample52. To estimate model performance during training, each case is predicted by all the trees it was not involved in building, and then the most predicted class is considered as the predicted value for that case in the classification context. In the regression context, the average of the predicted values is considered as the predicted value. To predict new cases, all trees predict the new case, and then the most predicted class is considered as the prediction for classification contexts53, while the average of the predictions is considered as the prediction for regression cases54.
Extreme gradient boosting
Like Random forests Extreme Gradient Boosting is an advancement of decision trees, which combines multiple-week learners for this case decision trees to come up with a strong predictive model, unlike decision tree where trees are build on independent bootstrap samples, in gradient boosting the trees are build sequentially53, where each subsequent tree is built correct errors of the previous tree the aim is to minimize loss function commonly MSE. The final prediction of the model is usually the sum of predictions from all weak learners.
Support vector machines (SVM)
SVMs are powerful supervised learning techniques for regression, classification, and outlier detection tasks. The models present various advantages such as memory efficiency, high-dimensional effectiveness, and robustness55. In classification, SVMs aim to find a hyperplane or set of hyperplanes that maximize the margin between different classes of data points. These hyperplanes are used to make predictions for new data points, where the side of the hyperplane they fall on determines their class. SVMs support various kernel functions like linear, polynomial, radial basis function (RBF), and sigmoid, allowing them to handle both linearly and non-linearly separable data. The choice of the kernel function and its parameters like C (controls misclassification penalty) and gamma (affects the decision boundary’s flexibility) plays a crucial role in SVM performance and must be carefully selected56,57. Support Vector Regression (SVR) is a regression method that minimizes error between predicted and actual values. It can handle unbalanced datasets, multi-class classification, and probability estimation. However, it requires tuning hyperparameters, data preprocessing, and selecting appropriate kernel functions58. SVR is implemented in popular libraries like scikit-learn libsvm and liblinear for efficient computation.
Results
GAN training
The GAN generator model was specified with a masking layer at the beginning to handle differing run lengths and LSTM layers to handle temporal features; the final layer includes a dense layer to control the output dimension. The discriminator included the same layers but the dense layer was binary to output classification of data as fake or real. The model was trained using a custom training loop, with batches of runs randomly sampled from the padded dataset. The discriminator classifies data as synthetic or real, while the generator aims to produce synthetic lines to deceive the discriminator. Additionally, binary cross-entropy loss functions for both the discriminator and generator were tracked throughout training. The generator minimizes this loss to improve the quality of generated sequences. Binary cross-entropy loss measures the dissimilarity between predicted probabilities and actual binary outcomes (0 or 1). It can be summarized in the formula below:
where L (y, p) is the loss for a single data point, y is the actual binary label (0 or 1), and p is the predicted probability that the data point belongs to class 1. Lower loss values for the discriminator indicate the discriminator’s ability to differentiate between synthetic and real data while for the overall model, it indicates the generator’s ability to fool the discriminator. Figure 4 below report the generator and discriminator.
Structure of generator and discriminator models.
According to the graphs in Fig. 5, the GANs framework shows a dynamic evolution of two critical loss components, that is GAN loss and discriminator loss. The discriminator initially reduces loss when acquiring real data patterns, while gradually understanding fake data characteristics. Besides, the generator loss’s trajectory varies from an upward trend in discriminator training to a descending trend, an indication that it has a growing efficiency in duping the discriminator, with a key point at equilibrium.

Trends in discriminator and generator loss during training.
After training the generator, synthetic data was generated using the median run size, resulting in 20 runs. The data was normalized to match the minimum and maximum values of the collected datasets before inclusion. The study addressed the issue of data imbalance in classification models by segmenting data into healthy segments (N–n readings) and failure segments (n readings), adjusting parameter ’n’ to evaluate model performance and sensitivity to different prediction horizons. Conversely, temporal dependence was addressed by introducing LSTM neural networks where the number of LSTM layers and neurons for each layer was decided through hyperparameter tuning. The network utilized a maximum pooling and dense layer to control output feature dimensionality, while a masking layer at the top handles dataset padding.
Classification feature extraction
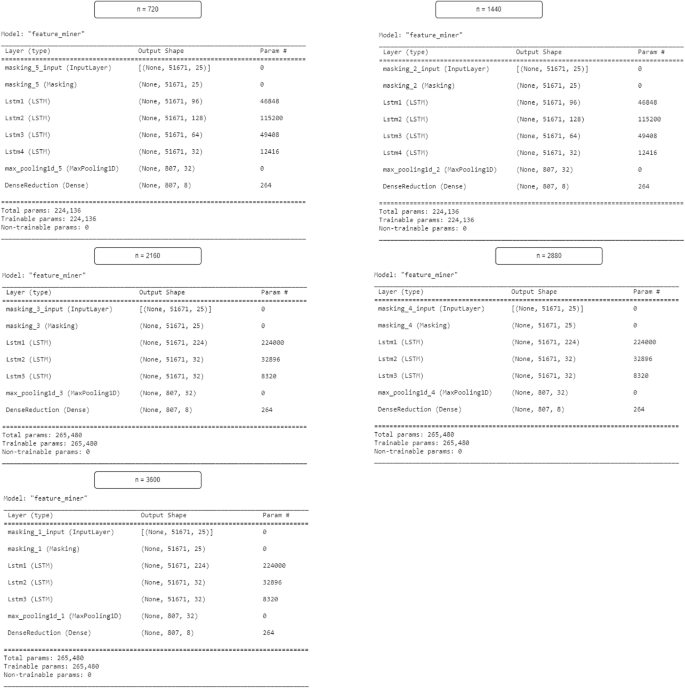
The LSTM feature extractor for the classification path was trained jointly with the ANN classifier to learn the extraction of temporal features which can be used to classify component status. The number of LSTM layers to be used and the number of units for each layer were tuned using a Keras tuner to achieve optimal performance. Moreover, 5 horizon sizes were tried to see which horizon size was most appropriate. Figure 6 below reports optimal model for each widow size.
Trends in LSTM model loss.
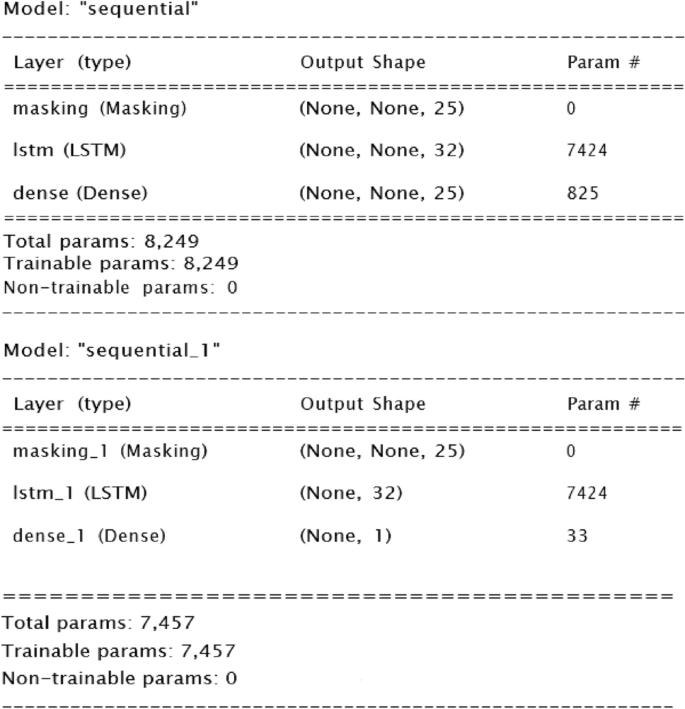
ANN classifier
The ANN layer uses the LSTM extracted features to classify component status with a sigmoid activation and 1 unit output. The system, combined with a binary cross-entropy loss function, quickly learns to predict component health in a few epochs but needs more training epochs for larger n-horizons. Figure 7 visualizes the trend in training and validation loss throughout the training process.

Trends in LSTM model loss.
Table 1 reports the Artificial Neural Network (ANN) classification results for all the chosen n horizons. The model correctly predicted 88.98% of the next downtime across a horizon of 720 observations, with 99.19% of the healthy observations and 88.69% of the failure cases correctly predicted. The model precision is 99.97% which is the proportion of cases predicted as failure cases that are failures. The F1 score is 93.99% indicating that the model performs well in identifying both cases. Generally, the accuracy, sensitivity, specificity, and F1 score decrease as the horizon size increases. This indicates that the model can more accurately detect impending failures that are nearer in time compared to those farther in the future.
Other classifiers
The extracted LSTM features were applied to baseline ML classifiers including Random Forest, XG Boost, Decision Tree, KNN, and SVM. Hyper parameters were tuned for each model using a Keras tuner. Table 2 below reports the optimal parameter setting for each classifier. Generally, model performance decreased with the horizon size, with a failure horizon of 720 observations yielding the best results for all baseline classifiers. Overall, SVM and Random Forest had the highest accuracy (74.15%) and identified failures better (specificity = 49.78%). Extreme boosted decision tree and KNN identified healthy conditions slightly better (specificity = 49.78%), while KNN had the highest precision. Support vector machine and Random Forest had the highest accuracy. Table 2 below reports this information.
Generally, model performance decreased with the horizon size, with a failure horizon of 720 observations yielding the best results for all baseline classifiers. Overall, SVM and Random Forest had the highest accuracy (74.15%) and identified failures better (specificity = 49.78%). Extreme boosted decision tree and KNN identified healthy conditions slightly better (specificity = 49.78%), while KNN had the highest precision. Support vector machine and Random Forest had the highest accuracy. Table 3 below reports this information.
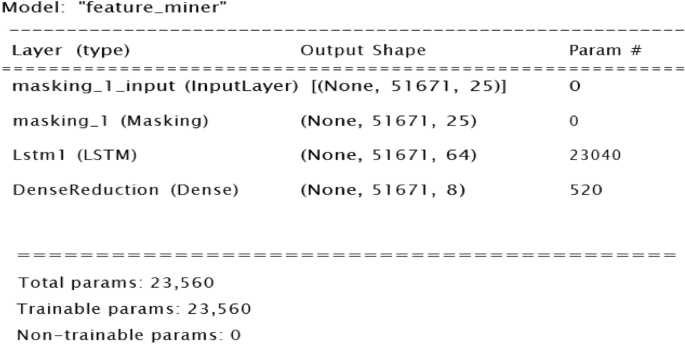
Regression feature extraction
For the regression path, the LSTM feature extractor was trained jointly with the ANN classifier to extract temporal features appropriate for RUL prediction. The number of LSTM layers and units in each layer were tuned to get the optimal feature extractor. Figure 8 visualizes the optimal feature extractor which contains one LSTM layer of 64 units.
optimal feature extractor.
The model was compiled with the mean squared error loss function. Figure 9 visualizes the trend in training and validation loss during training, the two drops gradually to optimal values by the 8th training epoch (Table 4).

Trend in training and validation MSE.
ANN regressor
A fully connected dense layer was connected to the extracted features to predict the RUL in timesteps. The model achieved MAE = 362307520.0, MSE = 1.484075e+17, RMSE = 385236896.0 and R squared − 7.657908. Table 5 compares the performance of this model with other baseline models.
Other regressors
Other regressors, including KNN, Decision Tree, Random Forest, SVR, and XGBoost regression, were fitted on the extracted features. Keras Tuner was used to optimize parameter values. Table 4 below reports the optimal parameter settings for these models. The Decision Tree model achieved the lowest RMSE among the baseline models (12109), which was even lower than the RMSE for the proposed ANN regressor.
Conclusion and recommendations
The study has successfully implemented a machine learning-based architecture that addresses these problems by employing a generative adversarial network to resolve data scarcity, creating failure horizons to address data imbalance, and using LSTM to learn temporal patterns from the PdM dataset. In the provided case study, where data scarcity and data imbalance are evident with only 8 runs and 8 failures against 228,416 healthy observations, and where temporal dependence is present as data is collected from the same components over time, the proposed architecture adapts well to the data. It produces high accuracy even with few runs. Additionally, despite the poorly balanced data, the ANN classification results feature high F1 scores, indicating that the model can sufficiently learn patterns from both categories. Furthermore, the LSTM feature extractor successfully learns temporal patterns to classify cases and predict RUL with precision.
The interpretation of the results underscores the significance of addressing critical gaps in predictive maintenance. Firstly, the limited availability of comprehensive real-world datasets hampers the generalizability of predictive models. This highlights the urgent need for tools to compensate for data scarcity, additionally, our findings emphasize the potential of deep learning models, such as LSTM autoencoders, to capture temporal dependencies within data and enhance equipment condition predictions while avoiding manual selection of features. Lastly, the integration of AI techniques into maintenance practices is explored.
The research, holds promise in enhancing maintenance strategies, resulting in improved failure prediction accuracy, reduced operational costs, and increased operational efficiency. This highlights the significance of adopting AI technologies in Industry 4.0 settings, where optimization in maintenance practices can yield substantial benefits. In summary, our research findings indicate that addressing these gaps through collaborative data efforts, standardized metrics, advanced techniques, and AI integration can lead to more reliable, cost-effective, and efficient maintenance practices across industries.
Limitations and future research
The research findings offer valuable insights into the critical gaps and potential advancements in predictive maintenance. However, it is essential to acknowledge certain limitations that could guide future research. Firstly, the proposed approach is computationally intensive, especially for the ANN classification where every new case has to be padded into a fixed size, before prediction, this is computationally costly for large data. Secondly, the GAN model learns to generate data similar to the provided real data. In the case of diverse Failure modes, the GANs model will not be able to generalize to patterns of failure mode it is not trained on. The study proposes Future research with more robust and diverse datasets, to test the adaptability of the architecture on diverse failure modes.
Data availability
The sensor data used in this study is accessible via the following link to https://www.kaggle.com/datasets/inIT-OWL/production-plant-data-for-condition-monitoring. Data analysis in this study can be provided by the corresponding author upon request.
References
Bach, M. P., Topalovic, A., Krstic, Z. & Ivec, A. Predictive maintenance in industry 4.0 for the SMEs: A decision support system case study using open-source software. Designs 7, 98. https://doi.org/10.3390/designs7040098 (2023).
Suleiman, Z., Shaikholla, S., Dikhanbayeva, D., Shehab, E. & Türkyılmaz, A. Industry 4.0: Clustering of concepts and characteristics. Cogent Eng. https://doi.org/10.1080/23311916.2022.2034264 (2022).
Çakır, M., Güvenç, M. A. & Mıstıkog˘lu, S.,. The experimental application of popular machine learning algorithms on predictive maintenance and the design of IIoT-based condition monitoring system. Comput. Ind. Eng. 151, 106948. https://doi.org/10.1016/j.cie.2020.106948 (2021).
Sarker, I. H. Machine learning: Algorithms, real-world applications and research directions. SN Comput. Sci. https://doi.org/10.1007/s42979-021-00592-x (2021).
Cline, B., Niculescu, R. S., Huffman, D. L. & Deckel, B. Predictive maintenance applications for machine learning. 2017 Annu. Reliab. Maintainability Symp. (RAMS) https://doi.org/10.1109/ram.2017.7889679 (2017).
Carvalho, T. P. et al. A systematic literature review of machine learning methods applied to predictive maintenance. Comput. Ind. Eng. 137, 106024. https://doi.org/10.1016/j.cie.2019.106024 (2019).
Fernandes, M., Corchado, J. M. & Marreiros, G. Machine learning techniques applied to mechanical fault diagnosis and fault prognosis in the context of real industrial manufacturing use-cases: A systematic literature review. Appl. Intell. 52, 14246–14280. https://doi.org/10.1007/s10489-022-03344-3 (2022).
Frankó, A., Hollósi, G., Ficzere, D. & Varga, P. Applied machine learning for IIOT and smart production—Methods to improve production quality, safety and sustainability. Sensors 22, 9148. https://doi.org/10.3390/s22239148 (2022).
Kane, A. P., Kore, A. S., Khandale, A. N., Nigade, S. S. & Joshi, P. P. Predictive maintenance using machine learning. arXiv https://doi.org/10.48550/arxiv.2205.09402 (2022).
Arboretti, R., Ceccato, R., Pegoraro, L. & Salmaso, L. Design of Experiments and machine learning for product innovation: A systematic literature review. Qual. Reliab. Eng. Int. 38, 1131–1156. https://doi.org/10.1002/qre.3025 (2021).
Siraskar, R., Kumar, S., Patil, S., Bongale, A. & Kotecha, K. Reinforcement learning for predictive maintenance: A systematic technical review. Artif. Intell. Rev. 56, 12885–12947. https://doi.org/10.1007/s10462-023-10468-6 (2023).
Ruiz-Rodríguez, M. L. et al. Multi-agent deep reinforcement learning based Predictive Maintenance on parallel machines. Robot. Comput. Manuf. 78, 102406. https://doi.org/10.1016/j.rcim.2022.102406 (2022).
Sisode, M. & Devare, M. A Review on Machine Learning Techniques for Predictive Maintenance in Industry 4.0 (Springer, 2023).
Rafique, F., Fu, L. & Mai, R. End to end machine learning for fault detection and classification in power transmission lines. Electr. Power Syst. Res. 199, 107430. https://doi.org/10.1016/j.epsr.2021.107430 (2021).
Liulys, K. Machine learning application in predictive maintenance, in 2019 Open Conference of Electrical, Electronic and Information Sciences (eStream). https://doi.org/10.1109/estream.2019.8732146 (2019).
Susto, G. A., Schirru, A., Pampuri, S., McLoone, S. & Beghi, A. Machine Learning for predictive maintenance: A multiple classifier approach. IEEE Trans. Ind. Inform. 11, 812–820. https://doi.org/10.1109/tii.2014.2349359 (2015).
Sohaib, M., Mushtaq, S. & Uddin, J. Deep Learning for Data-Driven Predictive Maintenance (Springer, 2021).
Bampoula, X., Siaterlis, G., Nikolakis, N. & Alexopoulos, K. A deep learning model for predictive maintenance in Cyber-Physical production systems using LSTM autoencoders. Sensors 21, 972. https://doi.org/10.3390/s21030972 (2021).
Paolanti, M. et al. Machine learning approach for predictive maintenance in industry 4.0, in 2018 14th IEEE/ASME International Conference on Mechatronic and Embedded Systems and Applications (MESA). https://doi.org/10.1109/mesa.2018.8449150 (2018).
Shamayleh, A., Awad, M. & Farhat, J. IoT based predictive maintenance management of medical equipment. J. Med. Syst. https://doi.org/10.1007/s10916-020-1534-8 (2020).
Tessaro, I., Mariani, V. C. & Coelho, L. D. S. Machine learning models applied to predictive maintenance in automotive engine components, in The 1st Int. Electron. Conf. on Actuator Technol. Materials, Devices Appl. https://doi.org/10.3390/iecat2020-08508 (2020).
Vaidyanathan, S., Sivakumar, M. & Kaliamourthy, B. Challenges of Developing AI Applications in the Evolving Digital World and Recommendations to Mitigate Such Challenges (sematicscholar, 2021).
Alzubaidi, L. et al. A survey on deep learning tools dealing with data scarcity: Definitions, challenges, solutions, tips, and applications. J. Big Data https://doi.org/10.1186/s40537-023-00727-2 (2023).
Ganesan, V. et al. Predictive maintenance in healthcare IoT: A machine learning-based approach. Eur. Chem. Bull. https://doi.org/10.48047/ecb/2023.12.si4.1420 (2023).
Rojek, I., Jasiulewicz-Kaczmarek, M., Piechowski, M. & Mikołajewski, D. An artificial intelligence approach for improving maintenance to supervise machine failures and support their repair. Appl. Sci. 13, 4971. https://doi.org/10.3390/app13084971 (2023).
Voronov, S. Machine Learning Models for Predictive Maintenance (sematicscholar, 2020).
De Aguiar Vallim Filho, A. R., Moraes, D. F., De Aguiar Vallim, M. V. B., Da Silva, L. S. & Da Silva, L. A. A machine learning modeling framework for predictive maintenance based on equipment load cycle: An application in a real world case. Energies 15, 3724. https://doi.org/10.3390/en15103724 (2022).
Pacheco, F. A. L. et al. Generation of synthetic data for the analysis of the physical stability of tailing dams through artificial intelligence. Mathematics 10, 4396. https://doi.org/10.3390/math10234396 (2022).
Figueira, A. & Vaz, B. Survey on synthetic data generation, evaluation methods and GANs. Mathematics 10, 2733. https://doi.org/10.3390/math10152733 (2022).
Vega-Márquez, B., Rubio-Escudero, C., Riquelme, J. C. & Nepomuceno-Chamorro, I. A. Creation of Synthetic Data with Conditional Generative Adversarial Networks (Springer, 2019).
https://www.kaggle.com/datasets/inIT-OWL/production-plant-data-for-condition-monitoring
Von Birgelen, A., Buratti, D., Mager, J. & Niggemann, O. Self-organizing maps for anomaly localization and predictive maintenance in cyber-physical production systems. Procedia CIRP 72, 480–485. https://doi.org/10.1016/j.procir.2018.03.150 (2018).
Zheng, S. Diffusion models for missing value imputation in tabular data. arXiv preprint arXiv:2210.17128 (2022).
Xu, P., Ji, X., Li, M. & Lü, W. Small data machine learning in materials science. npj Comput. Mater. https://doi.org/10.1038/s41524-023-01000-z (2023).
Carbone, M. R. When not to use machine learning: A perspective on potential and limitations. Mrs Bull. 47, 968–974. https://doi.org/10.1557/s43577-022-00417-z (2022).
Sadiq, S. et al. Discrepancy detection between actual user reviews and numeric ratings of Google App store using deep learning. Expert. Syst. Appl. 181, 115111. https://doi.org/10.1016/j.eswa.2021.115111 (2021).
Shaheen, E. et al. A novel deep learning system for multi-class tooth segmentation and classification on cone beam computed tomography. A validation study. J. Dent. 115, 103865. https://doi.org/10.1016/j.jdent.2021.103865 (2021).
Atul, K. An Introduction to Generative Adversarial Networks (GANs) (2019).
Aboshosha, A., Haggag, A., George, N. & Hamad, H. IoT-based data-driven predictive maintenance relying on fuzzy system and artificial neural networks. Sci. Rep.s https://doi.org/10.1038/s41598-023-38887-z (2023).
Cao, W., Liu, C. & Han, Y. Temporal Dependency Mining from Multi-sensor Event Sequences for Predictive Maintenance (Springer, 2019).
Buyukkececi, M. & Okur, M. C. A comprehensive review of feature selection and feature selection stability in machine learning. Gazi Univ. J. Sci. 36, 1506–1520. https://doi.org/10.35378/gujs.993763 (2023).
Kuzudisli, C., Bakır-Güngör, B., Bulut, N., Qaqish, B. F. & Yousef, M. Review of feature selection approaches based on grouping of features. PeerJ 11, e15666. https://doi.org/10.7717/peerj.15666 (2023).
Alsaeedi, A. H. et al. Fractal feature selection model for enhancing high-dimensional biological problems. BMC Bioinform. https://doi.org/10.1186/s12859-023-05619-z (2024).
Dvornek, N. C. & Li, X. Deep Learning with Connectomes (Academic Press, 2023).
Yılmaz, A. & Poli, R. Successfully and efficiently training deep multi-layer perceptrons with logistic activation function simply requires initializing the weights with an appropriate negative mean. Neural Netw. 153, 87–103. https://doi.org/10.1016/j.neunet.2022.05.030 (2022).
Crooks, J. Long short-term memory networks: Overcoming vanishing gradient problem in recurrent neural networks. www.hilarispublisher.com. https://doi.org/10.37421/2090-4886.2023.12.212 (2023).
Uddin, S., Haque, I., Lu, H., Moni, M. A. & Gide, E. Comparative performance analysis of K-nearest neighbour (KNN) algorithm and its different variants for disease prediction. Sci. Rep. https://doi.org/10.1038/s41598-022-10358-x (2022).
Boateng, E. Y., Otoo, J. A. & Abaye, D. A. Basic tenets of classification algorithms K-nearest-neighbor, support vector machine, random forest and neural network: A review. J. Data Anal. Inf. Process. 08, 341–357. https://doi.org/10.4236/jdaip.2020.84020 (2020).
Shaikhina, T. et al. Decision tree and random forest models for outcome prediction in antibody incompatible kidney transplantation. Biomed. Signal Process. Control. 52, 456–462. https://doi.org/10.1016/j.bspc.2017.01.012 (2019).
Lin, C. & Fan, C.-L. Evaluation of CART, CHAID, and QUEST algorithms: A case study of construction defects in Taiwan. J. Asian Archit. Build. Eng. 18, 539–553. https://doi.org/10.1080/13467581.2019.1696203 (2019).
Chilezie Njoku, O. Decision trees and their application for classification and regression problems.
Kumar, A. C., John, J. A., Raja, M. & Vijaya, P. Genetic Factor Analysis for an Early Diagnosis of Autism Through Machine Learning (Academic Press, 2023).
Jafarzadeh, H., Mahdianpari, M., Gill, E. W., Mohammadimanesh, F. & Homayouni, S. Bagging and boosting ensemble classifiers for classification of multispectral, hyperspectral and PolSAR data: A comparative evaluation. Remote Sens. 13, 4405. https://doi.org/10.3390/rs13214405 (2021).
Borup, D., Christensen, B. J., Mühlbach, N. S. & Nielsen, M. S. Targeting predictors in random forest regression. Int. J. Forecast. 39, 841–868. https://doi.org/10.1016/j.ijforecast.2022.02.010 (2023).
Cervantes, J., García-Lamont, F., Rodríguez-Mazahua, L. & López, A. A comprehensive survey on support vector machine classification: Applications, challenges and trends. Neurocomputing 408, 189–215. https://doi.org/10.1016/j.neucom.2019.10.118 (2020).
Reynolds, E., Callaghan, B. C. & Banerjee, M. SVM–CART for disease classification. J. Appl. Stat. 46, 2987–3007. https://doi.org/10.1080/02664763.2019.1625876 (2019).
Guido, R., Groccia, M. C. & Conforti, D. A hyper-parameter tuning approach for cost-sensitive support vector machine classifiers. Soft Comput. 27, 12863–12881. https://doi.org/10.1007/s00500-022-06768-8 (2022).
Iranmehr, A., Masnadi-Shirazi, H. & Vasconcelos, N. Cost-sensitive support vector machines. Neurocomputing 343, 50–64. https://doi.org/10.1016/j.neucom.2018.11.099 (2019).
Acknowledgements
The author would like to acknowledge the editor and reviewers for their valuable comments towards the improvement of this paper.
Author information
Authors and Affiliations
Contributions
A.H. conceptualization, A.H. methodology, A.H. data curation, A.H. formal analysis, A.H. writing-review and editing. All authors have read and agreed to the published version of the manuscript.
Corresponding author
Ethics declarations
Competing interests
The author declares no competing interests.
Additional information
Publisher's note
Springer Nature remains neutral with regard to jurisdictional claims in published maps and institutional affiliations.
Rights and permissions
Open Access This article is licensed under a Creative Commons Attribution 4.0 International License, which permits use, sharing, adaptation, distribution and reproduction in any medium or format, as long as you give appropriate credit to the original author(s) and the source, provide a link to the Creative Commons licence, and indicate if changes were made. The images or other third party material in this article are included in the article's Creative Commons licence, unless indicated otherwise in a credit line to the material. If material is not included in the article's Creative Commons licence and your intended use is not permitted by statutory regulation or exceeds the permitted use, you will need to obtain permission directly from the copyright holder. To view a copy of this licence, visit http://creativecommons.org/licenses/by/4.0/.
About this article

Cite this article
Hakami, A. Strategies for overcoming data scarcity, imbalance, and feature selection challenges in machine learning models for predictive maintenance. Sci Rep 14, 9645 (2024). https://doi.org/10.1038/s41598-024-59958-9
Received:
Accepted:
Published:
DOI: https://doi.org/10.1038/s41598-024-59958-9
Comments
By submitting a comment you agree to abide by our Terms and Community Guidelines. If you find something abusive or that does not comply with our terms or guidelines please flag it as inappropriate.
