
Abstract
Genome-wide association studies (GWAS) have dissected numerous genetic factors underlying refractive errors (RE) such as myopia. Despite significant insights into understanding the genetic architecture of RE, few studies have validated and explored the functional role of candidate genes within these loci. To functionally follow-up on GWAS and characterize the potential role of candidate genes on the development of RE, we prioritized nine genes (TJP2, PDE11A, SHISA6, LAMA2, LRRC4C, KCNQ5, GNB3, RBFOX1, and GRIA4) based on biological and statistical evidence; and used CRISPR/cas9 to generate knock-out zebrafish mutants. These mutant fish were screened for abnormalities in axial length by spectral-domain optical coherence tomography and refractive status by eccentric photorefraction at the juvenile (2 months) and adult (4 months) developmental stage. We found a significantly increased axial length and myopic shift in refractive status in three of our studied mutants, indicating a potential involvement of the human orthologs (LAMA2, LRRC4C, and KCNQ5) in myopia development. Further, in-situ hybridization studies showed that all three genes are expressed throughout the zebrafish retina. Our zebrafish models provide evidence of a functional role of these three genes in refractive error development and offer opportunities to elucidate pathways driving the retina-to-sclera signaling cascade that leads to myopia.
Introduction
Refractive errors (RE) are the most frequent eye disorders which arise when the optics of the eye are not matched to the biometry of the eye. Especially myopia, or nearsightedness, has shown a rapid increase in prevalence over the last decades. This RE is linked to eye diseases such as myopic macular degeneration, glaucoma, cataract, and retinal detachment and is thereby becoming an increasingly common cause of blindness1,2,3.
In the last decade, genome-wide association studies (GWASs) have focused on dissecting the genetic factors underlying RE. In 2018, Tedja et al., identified 161 loci associated with RE in a large (160,420 participants) GWASs meta-analysis4. This list was extended to 449 loci in 2020 by a GWASs meta-analysis by Hysi et al., encompassing 542,934 participants of mixed ancestries from various studies including UK Biobank, the GERA, 23andMe and the CREAM consortium5. Candidate genes potentially involved in pathways driving the retina-to-sclera signaling cascade underlying RE were annotated to the identified loci, and disease mechanisms such as (cat)ion transport, neurotransmission, neuronal development, cell–cell adhesion, and extracellular matrix remodeling were suggested4,5,6. However, studies exploring the functional roles of these candidates and thereby validating GWAS findings are still scarce. The goal of this functional study is to evaluate the potential of candidate RE genes in controlling refractive error using zebrafish (Danio rerio) as a model. We have previously demonstrated that the zebrafish is an efficient model to study RE7,8, which offers a significant improvement in time and costs compared to the more traditionally used avian or mammalian animal models. Using zebrafish, we have previously shown that depletion of GJD2 (located in one of the genome-wide top-associated signals) leads to the development of RE8.
In this study, we investigated nine additional GWAS candidate genes (TJP2, PDE11A, SHISA6, LAMA2, LRRC4C, KCNQ5, GNB3, RBFOX1, and GRIA4) which were prioritized based on statistical (e.g., effect size of associated single nucleotide polymorphisms (SNPs) in GWAS studies) and biological (e.g., ocular function and expression) evidence for their functional role in RE development. Here, we show that three of these candidate genes have a potential role in the determination of eye size.
Results
Gene prioritization
We prioritized candidate genes within associated loci from recent GWAS meta-analyses4,5. The prioritization was based on both statistical and biological evidence, i.e., (1) effect size (large) and P-value (low) of the associated SNPs; (2) expression in ocular tissues; (3) involvement in pathways described in the literature; (4) the existence of a zebrafish ortholog; and additionally, (5) regional visualization of the locus by assessing the locuszoom plots (i.e., the genomic position of the association signal relative to the candidate genes and the position of genes in the region9). The final selection consisted of nine top candidate genes; TJP2, PDE11A, SHISA6, LAMA2, LRRC4C, KCNQ5, GNB3, RBFOX1, and GRIA4 (see Supplementary Data S1). The cell-specific expression of the nine candidate genes was retrieved from published datasets10,11,12,13, see Methods section. A summary of the ocular distribution of the genes can be found in Fig. 1 and Supplementary Data S1. According to the retrieved data, all nine genes are expressed throughout the neural retina10,11,12,13 while expression of TJP2, PDE11A, SHISA6, LAMA2, KCNQ5, and GNB3 is also found in RPE cells11,14. Moreover, all candidate genes are expressed in cells throughout the choroid in: endothelial cells (TJP2, PDE11A, LAMA2, LRRC4C, GNB3); pericytes (TJP2, LAMA2, GNB3, GRIA4); melanocytes (TJP2, KCNQ5, RBFOX1); fibroblasts (TJP2, PDE11A, SHISA6, LAMA2, LRRC4C, GNB3, RBFOX1, GRIA4); and immunocompetent cells (TJP2, PDE11A, LAMA2, RBFOX1)11,14. TJP2, LAMA2, LRRC4C, KCNQ5, GNB3, RBFOX1, and GRIA4 are additionally expressed in the cornea15.

Ocular expression of the prioritized candidate genes. Schematic overview of the expression of the nine candidate genes throughout the human eye. Data on ocular expression was obtained from five independent single-cell RNA sequencing studies10,11,12,14,15. Additional sources were the Human Protein Atlas13. Further details on the cell-specific expression of the candidate genes in the cell types of the choroid can be found in Supplementary Data S1. RGC: retinal ganglion cell, AC: amacrine cell, BC: bipolar cell, MC: müller cell, HC: horizontal cell, RPE: retinal pigmented epithelium cell.
Expression of candidate genes in the zebrafish eye and generation of mutant zebrafish
Due to a partial genome duplication in teleost fish16, 7 out of 9 candidate genes were represented by two zebrafish orthologs; only SHISA6 and LAMA2 had one ortholog gene in zebrafish. To confirm gene expression in zebrafish ocular tissue, an Reverse Tanscriptase PCR (RT-PCR) was performed on whole zebrafish eyes at the following developmental stages: 4 days post-fertilization (dpf); 1, 2, 3, 6 months post fertilization (mpf); and 1 year. All studied genes were found to be expressed in the zebrafish eye throughout stages (Fig. 2, Supplementary Data S2). The CRISPR-cas9 system was used to generate mutant zebrafish lines for each fish ortholog of the nine (human) candidate genes (Supplementary Data S3). Generated lines were named according to the Zebrafish Information Network (ZFIN) nomenclature. For each line the induced frameshift mutations led to a premature stop codon, predicted to lead to a truncated protein. Single mutants were created for the genes with one zebrafish ortholog (i.e., shisa6 and lama2): shisa6re15 and lama2re16. Generation of gria4a and gria4b lines failed due to inability to introduce mutations and perform genotyping of the target region. Double mutants were generated for the remaining six genes with two orthologs in zebrafish: tjp2ab1367tjp2bb1368, pde11are13pde11a-likere14, lrrc4care17lrrc4cbre18, kcnq5are19kcnq5bre20, gnb3are21gnb3bre22, and rbfox1re23rbfox1-likere24 (see Supplementary Data S3 for details on the induced mutations). The gnb3are21gnb3bre22 and rbfox1re23rbfox1-likere24 mutants appeared non-viable after 14 dpf. Therefore, six candidate genes (shisa6, lama2, tjp2, pde11a, lrrc4c, and kcnq15) were further characterized. Figure 3 shows a graphic overview of the successfully generated mutants, the mutations, and the predicted truncated proteins.
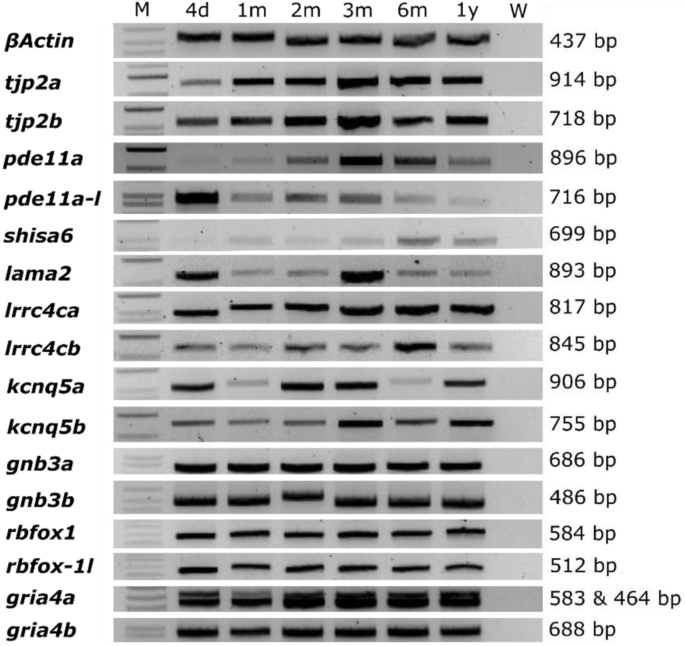
Orthologs of candidate genes are expressed in the zebrafish eye. Agarose gel loaded with RT-PCR product of isolated RNA extracted from zebrafish eyes between 4 days and 1 year post-fertilization. Orthologues genes of human myopia candidate genes showed a continuous expression throughout time. B-actin was used as a positive control. See Supplementary Data S2 for additional information on primers and anticipated product sizes. The figure depicts a grouping of separate gels run for each gene. Full agarose gels are shown in Supplementary Information File 2. M: marker (1 KB + ladder), W: water control, d: days, m: month(s), y: year.

Overview of induced mutations and their predicted effect on protein. Structural representation of the deletions and/or insertions induced by CRISPR-cas9 in the six successfully generated mutant lines. Per gene panel, the dotted lines points to the position of the mutation relative to the gene. Deletions (red) are shown in the WT sequence and insertions (green) in the mutant sequence. A schematic representation of the predicted WT protein (grey) and truncated mutant protein (red) are shown on the right side of the arrow. The region that is predicted to be conserved between the WT and mutant protein is depicted in the WT protein (thin red line). For genes with two orthologues the double mutant generated from crossing the single mutants is depicted on the lower right. WT: wild-type, INX: incross. See Supplementary Data S3 for more detailed information.
SD-OCT assessment showed an increased axial length in three mutant lines
We measured axial length in all six mutant lines using Spectral Domain Optical Coherence Tomography (SD-OCT). To isolate intraocular changes in biometry from potential extraocular changes induced by the generated mutations, we studied mutant fish (n = 20 eyes) with equal body lengths (max variation < 1%) as WT fish (Supplementary Fig. S1).
At 2 mpf, a significant increase in axial length was found for two mutant lines: lrrc4care17lrrc4cbre18 (Effect size = 140.0 µm, p < 0.0001) and kcnq5are19kcnq5bre20 (Effect size = 151.0 µm, p < 0,0001), relative to WT controls (Fig. 4, Supplementary Data S4). At 4 mpf, a relative increase was also found for the lama2re16 (Effect size = 69.00 µm, p = 0.0083) mutant; and the larger axial length persisted for lrrc4care17lrrc4cbre18 (Effect size = 114.0 µm, p < 0.0001) and kcnq5are19kcnq5bre20 (Effect size = 92.00 µm, p = 0.0044) mutants (Fig. 4, Supplementary Data S4). No significant changes in axial length were found for the shisa6re15, tjp2ab1367tjp2bb1368, and pde11are13pde11a-likere14 mutants at either time period.

The lama2re16, lrrc4care17lrrc4cbre18, and kcnq5are19kcnq5bre20 mutants showed an increased axial length. (a) Single B-scan image of a typical 4mpf WT zebrafish eye. The axial length (blue) spans from the apical part of the corneal epithelium to the anterior border of the RPE. The gradient refractive index of the spherical zebrafish lens was used as a correction factor to acquire this image (see “Methods”). Individual compartments: cornea and anterior chamber (red), lens (yellow), vitreous chamber (orange), neural retina (magenta) and RPE (green). (b) Axial length of size-matched 2 and 4mpf zebrafish measured by spectral-domain optical coherence tomography. At 2mpf an increase in axial length was found for lrrc4c mutant (Effect size = 140.0 μm, p < 0.0001) and kcnq5 mutant (Effect size = 151.0 μm, p < 0,0001) relative to WT fish. At 4mpf a relative increase was found for lama2 mutant (Effect size = 69.00 μm, p = 0.0083), lrrc4c mutant (Effect size = 114.0 μm, p < 0.0001), and kcnq5 mutant (Effect size = 92.00 μm, p = 0.0044). See Supplementary Data S4 for all data. Error bars: SEM. Significance: ns = not significant, *p < 0.05, **p < 0.01, ***p < 0.001. Mpf: months post-fertilization, RPE: retinal pigmented epithelium, WT: wild-type, tjp2 mutant: tjp2ab1367tjp2bb1368, pde11a mutant: pde11are13pde11a-likere14, shisa6 mutant: shisa6re15, lama2 mutant: lama2re16, lrrc4c mutant: lrrc4care17lrrc4cbre18, kcnq5 mutant: kcnq5are19kcnq5bre20, SEM: Standard error of the mean.
Refractive status of the mutant zebrafish lines
To explore whether the changes in axial length resulted in alterations in refractive status, a custom eccentric photorefraction set-up was used as described previously7,8. The WT control fish (n = 20 eyes) showed a positive baseline refractive status (Fig. 5, Supplementary Data S5). This has also been found in previous studies, and has mainly been attributed to the small eye retinoscopic artifact7,8,17,18,19. In agreement with our biometric data, a myopic shift in refractive status was found at 2 mpf for lrrc4care17lrrc4cbre18 (effect size = − 3.4D, p < 0.0001) and for kcnq5are19kcnq5bre20 (effect size = − 2.4D, p = 0.003) relative to WT controls (Fig. 5, Supplementary Data S5). The lama2re16 mutant showed a significant myopic refraction at 2 mpf as well (effect size = − 1.4D, p = 0.018). Likewise, a myopic shift was also detected at 4 mpf for lrrc4care17lrrc4cbre18-/- (effect size = − 1.2D, p = 0.003), kcnq5are19kcnq5bre20 (effect size = − 2.6D, p < 0.0001) and lama2re16 (effect size = − 2.0D, p < 0.0001) (Fig. 5, Supplementary Data S5).

Mutants with increased axial length show a myopic shift in refractive status. Refractive status measured by eccentric photorefraction. The lama2, lrrc4c, kcnq5 mutants showed a myopic shift in refractive status at 2mpf (lama2 mutant: effect size = − 1.4D, p = 0.018; lrrc4c mutant: effect size = − 3.4D, p < 0.0001; kcnq5 mutant: effect size = − 2.4D, p = 0.003) and 4mpf (lama2 mutant: effect size = − 2.0D, p < 0.0001; lrrc4c mutant: effect size = − 1.2D, p = 0.003; kcnq5 mutant : effect size = − 2.6D, p < 0.0001), relative to WT (n = 20 eyes per timepoint). The tjp2 mutant showed a hyperopic shift at 4mpf (effect size = + 2.1D, p = 0.001). See Supplementary Data S5 for all data. Error bars: SEM. Significance: ns = not significant, *p < 0.05, **p < 0.01, ***p < 0.001. Mpf: months post-fertilization, WT: wild-type, tjp2 mutant: tjp2ab1367tjp2bb1368, pde11a mutant: pde11are13pde11a-likere14, shisa6 mutant: shisa6re15, lama2 mutant: lama2re16, lrrc4c mutant: lrrc4care17lrrc4cbre18, kcnq5 mutant: kcnq5are19kcnq5bre20, SEM: Standard error of the mean.
No changes in refractive status were found at 2 nor at 4 mpf for the pde11are13pde11a-likere14 and shisa6re15 mutants. However, the tjp2ab1367tjp2bb1368 mutant showed a hyperopic shift in refractive status (effect size = + 2.1D, p = 0.001) at 4 mpf (Fig. 5, Supplementary Data S5). In contrast to the three myopic mutants, the tjp2ab1367tjp2bb1368 mutant did not show significant changes in axial length. In the OCT data, however, we observed an increase in lens diameter of the tjp2ab1367tjp2bb1368 at 4 mpf relative to WT lenses (Δ increase = 26.70 µm, p = 0.035) (Supplementary Data S4). We hypothesized that the measured hyperopic refractive change of the mutants was due to changes in the lenticular shape with, as a consequence, a decreased lens curvature. To assess this hypothesis, we compared 4 mpf isolated ex-vivo lenses (per group n = 10 fish, n = 20 lenses), and found a circularity = 1 for both mutant and WT lenses, which suggests a homogeneous increase in lens diameter and volume in the tjp2ab1367tjp2bb1368 mutant (see Supplementary Fig. S2a, b and Methods). Next, we used the 4 mpf SD-OCT data and measured the changes in curvature of the anterior lenticular hemisphere. Here we found a significant decrease in curvature in the lenses of the tjp2ab1367tjp2bb1368 mutants (Supplementary Fig. S2c). This decreased curvature may contribute to the increased focal length and the detected hyperopic shift in refractive error.
Topographic overview of selected genes leading to a refractive error phenotype
To characterize the retinal role of lama2, lrrc4ca, lrrc4cb, kcnq5a, and kcnq5b, we studied the expression and topographic distribution using in-situ hybridization in one year old WT fish. Expression of lama2 was predominantly found in the inner nuclear layer (INL) and more modest in the outer nuclear layer (ONL) (Fig. 6a). Expression of both lrrc4ca and lrrc4cb was observed in the ONL and INL (Fig. 6b,c). lrrc4ca was also modestly detected in the photoreceptor layer (PL) whereas lrrc4cb was additionally found in the ganglion cell layer (GCL). kcnq5a was expressed in the GCL, INL, ONL, and PL (Fig. 6d) and kcnq5b was limited to the INL and ONL (Fig. 6e). The ISH showed that these myopia candidate genes are all expressed throughout zebrafish retina.

Ocular distribution of lama, lrrc4ca/lrrc4cb and kcnq5a/kcnq5b in zebrafish. In situ hybridization showing the distribution of lama2, lrrc4ca, lrrc4cb, kcnq5a and kcnq5b throughout the 1-year-old WT zebrafish retina. NBT/BCIP, in purple, was used to visualize the probes. Lama2 expression was mainly found in the INL and also modestly in the ONL (a). Lrrc4ca and lrrc4cb expression was found in both ONL and INL (b–c) whilst lrrc4ca expression was also detected in the PL (b) and lrrc4cb expression in the GCL (c). Kcnq5a expression was found in the PL, ONL, INL and GCL (d) whilst kcnq5b expression was found in only the ONL and the INL (e). Scale bars: 10 μm. WT: Wild Type, PL: photoreceptor layer, ONL: outer nuclear layer, OPL: outer plexiform layer, INL: inner nuclear layer, IPL: inner plexiform layer, GCL: ganglion cell layer.
Discussion
Even though GWASs have successfully provided insights into the genetic architecture of complex traits such as refractive error, GWASs do not provide information regarding the causal variant or its functional role. In this study, we present a candidate-gene approach study in which we aim to validate and explore the functional role of RE-candidate genes in the eye using mutant zebrafish models. We prioritized nine candidate genes identified in previous GWASs of RE and used CRISPR/cas9 technology to generate mutant zebrafish. Ocular screening for refractive error was possible in six mutant lines, and in three of those, we observed a myopic phenotype: lama2re16, lrrc4care17lrrc4cbre18, and kcnq5are19kcnq5bre20. In our ISH studies we showed that lama2, lrrc4ca, lrrc4cb, kcnq5a and kcnq5b are expressed throughout the zebrafish retina in accordance with our search in published scRNA-seq databases, and supporting previous notions that suggest that the retina (and its intricate signaling cascades) contributes as a whole in the development of both emmetropia and ametropia. Our study provides new in vivo models that will help dissecting the pathways leading to RE development.
The variant rs12193446, located in intron 58 of the human LAMA2 gene (NM_000426.4), has showed statistically the strongest association with RE, with a P-value of = 9.87 × 10−328 in the largest GWAS meta-analysis4,5. It is unclear if this deep intronic variant is truly causal since its potential functional effect has not been elucidated yet. However, in our candidate-gene approach we found an increase in axial length at 4 mpf in the lama2re16 mutant, whereas a myopic shift in refractive error was detected at both 2 and 4 mpf. The difference in onset of detectable changes by SD-OCT and photorefraction can be due to the sensitivity and methodological differences between these two methods. In our in-situ hybridization study, we observed that zebrafish lama2 was predominately expressed in the INL. Previous studies on avian and rodent tissues also reported expression in the retinal ganglion cells (RGC)20 and vasculature21,22.
In previous zebrafish studies, mutations in lama2 led to severe muscular dystrophy phenotypes and growth abnormalities between 8 and 15 dpf23,24,25. In contrast to these previously generated mutant lines, our lama2re16 mutants showed no swimming abnormalities, macroscopically visible growth deficits or early death, however, a more comprehensive study into the muscle fiber composition would be needed to exclude degeneration of muscle tissue. The lama2re16 mutant used in this study contains a frameshift mutation and predicted stop gain in an early exon (#3), expected to lead to nonsense-mediated decay or at least early termination and a severely truncated Lama2 protein. Whereas the previously reported lama2 models carry mutations located in highly conserved amino acid residues that map to the globular domain of lama2 and that are known to cause muscular dystrophy in humans. Note that the absence of a severe early onset muscular dystrophy phenotype in the lama2re16, created the possibility to focus on the intraocular consequences of the mutation, i.e., RE development. In humans, mutations in LAMA2 as well as mutations in the two related genes: DAG1 and ITGA7, both encoding LAMA2 receptors, are known to cause muscular dystrophy22,26,27,28,29. All three genes were significantly associated with RE in previous GWAS meta-analyses5. The relationship between the common variants in LAMA2, DAG1 and ITGA7 that are associated with myopia and the mutations in these same genes causing muscular dystrophy is not clear. Studies have shown a role of laminins, including laminin alfa-2 and the integrity of the retinal vascular basement membrane. Furthermore, it is known that patients with bi-allelic pathogenic variants in LAMA1 (causing Poretti–Boltshauser syndrome, OMIM #615960) develop high myopia as one of the symptoms. The myopic phenotype after depletion of lama2 in zebrafish, together with the strong evidence from GWAS studies support the notion that human LAMA2 contributes to myopia.
Rs11602008, an intronic variant in the LRRC4C gene (NM_001258419.2), has consistently been associated with RE in multiple GWAS meta-analyses4,5,30. This variant has been annotated to the LRRC4C gene encoding the netrin-G1 ligand (NGL-1). NGL-1 is a transmembrane protein and together with its presynaptic ligand Netrin-G1 are known to promote neurite outgrowth of developing thalamic neurons31,32. Furthermore, Lrrc4c/NGL-1 deletion in male mice suppresses hippocampal excitatory synapse development and function33. Although the retinal function of LRRC4C/NGL-1 has not been described yet, we observed in the retrieved scRNA-seq databases and our ISH studies that human LRRC4C and zebrafish lrrc4c genes are both expressed throughout the neural retina. Hence, the potential role of LRRC4C in the retina may, similar to the thalamus, also be sought in the direction of axon guidance during development, serving a role in controlling retinal wiring. In zebrafish, we showed that a potential loss of lrrc4c leads to axial elongation and a myopic shift in refractive status. Defects in retinal signaling induced by the loss of zebrafish lrrc4c/Ngl-1 and potentially the retinal wiring in the developing mutant zebrafish may disturb the emmetropization process. The precise mechanism in which an alteration in the retina-to-sclera signaling cascade, due to potential lack of lrrc4c, may lead to axial elongation remains to be elucidated. Studies exploring the transcriptomic changes downstream lrrc4c will provide more insights into this process.
The rs7744813 SNP in intron 1 of KCNQ5 (NM_019842.4) has been associated with myopia by multiple independent GWAS meta-analyses4,5,30. Moreover, rs7744813 and four other KCNQ5 polymorphisms have also been associated with high myopia34. In this study, we described that human KCNQ5 and zebrafish kcnq5a/kcnq5b are widely expressed throughout the retina and that the potential loss of kcnq5 leads to myopia in zebrafish. KCNQ5 encodes a voltage-gated potassium channel named Kv7.5. It has been shown that KCNQ5/kv7.5 is mediating M-type current in the brain35,36, retinal pigmented epithelium (RPE) and neural retina37,38. Yang et al. 2021 showed a potential relation between KCNQ5 and myopia development in form-deprived guinea pigs. The authors reported that retinal KCNQ5 was significantly downregulated, and proposed that this was the result of increasing potassium concentrations or decreasing M-type potassium current densities in the RPE cells of form-deprived guinea pig eyes39. In our study, however, the ocular axial elongation and corresponding (myopic) shift in refractive error is observed as result of the potential lack of kcnq5 in zebrafish. The order of events in the guinea pig model may therefore have been: form-deprivation myopia; followed by downregulation and impairment of the M-type potassium current; leading to axial ocular growth. Another study proposed that changes in expression patterns or the function of KCNQ5 affects the timing of retinal bipolar cell signals generated in response to photoreceptor light-evoked responses40. These altered bipolar cell responses may enhance the susceptibility to myopia. Our findings in zebrafish support the findings reported in other animal models, which show evidence for a relationship between kcnq5 and myopia. Future studies using KCNQ5 (Kv7.5)-selective potassium channel openers or inhibitors may lead to the discovery of new myopia treatments.
Besides the myopic phenotype observed in the lama2re16, lrrc4care17lrrc4cbre18, and kcnq5are19kcnq5bre20 mutants, we found that the tjp2ab1367tjp2bb1368 mutants showed a hyperopic shift in refractive status at 4 mpf, however, without a corresponding decrease in axial elongation. This may be a direct effect of the potential loss of tight junctions in lens tissue as tjp2a and tjp2b seem to be moderately expressed in the lenses of larval zebrafish41,42. Zebrafish cannot accommodate due to a vestibular retractor lentis43,44,45, also, the zebrafish cornea does not contribute to the optical power in water46,47,48. The refractive error is, therefore, most likely induced by an increased focal length, i.e., the increased lens diameter and decrease in curvature/sphericity. To assess our hypothesis, we studied the relative differences between WT and tjp2ab1367tjp2bb1368 mutant lenses; which brings limitations, as we did not perform absolute calculations of the optical power. Ideally, the front and back of the lens should both be measured, however in the SD-OCT scans, the back of the lens is deformed due to the lens effect, leading to image deformation. Nevertheless, the front and back of the lens are assumed to be equally shaped due to the perfect sphericity we measured ex-vivo. A final limitation of our lens assessment is that we only considered changes in the outer cortical region and epithelium and not the potential changes in the optical properties of deeper cortical and nuclear layers. In this study, we identified a potential lenticular function of tjp2a and tjp2b, however, future studies are needed for an in-depth characterization of both the molecular and optical changes in the tjp2ab1367tjp2bb1368 mutant lens.
In our screening, we did not observe an ocular phenotype in the pde11are13pde11a-likere14 and shisa6re15 mutants. However, a limitation of this study is the lack of antibodies specific to the studied zebrafish proteins, which limited our opportunity to confirm by western blot or immunohistochemistry the effect of the generated mutant alleles at the protein level. Therefore, based on these results, we cannot exclude these genes as potentially involved in regulating eye size.
Interpreting GWAS findings is challenging and requires not only the identification of the causal variant but also the identification of the molecular effect of the variant, the role of the implicated genes, and the relevant cell types and pathways. In this study, we present a candidate-gene approach in response to the lack of functional studies exploring the potential role of candidate genes on refractive error development. We prioritized nine candidate genes, screened six mutant zebrafish models, and found a myopic phenotype in three mutant lines (lama2re16, lrrc4care17lrrc4cbre18−/−, and kcnq5are19kcnq5bre20). The myopic phenotype was characterized by an increase in axial length and negative shift in refractive status. These findings indicate that myopic refractive errors can be induced by depletion of individual strongly associated candidate genes selected from GWAS. These single candidate genes, when depleted, leading to significant changes in refractive status is interesting, considering the consensus that complex myopia is induced by an epistasis of SNPs and genes. Our findings show that these three candidate genes, when depleted, independently contribute to axial length determination. The myopic lama2re16, lrrc4care17lrrc4cbre18-/-, and kcnq5are19kcnq5bre20 mutants can be used to further study the signaling cascade underlying myopic axial elongation and the development of myopia interventions.
Methods
Lookup of candidate genes in published transcriptomic datasets
Retinal expression of the candidate genes was assessed using three independently published single-cell RNA sequencing (scRNA-seq) datasets of the adult human retina10,11,12 and the Human Protein Atlas13. Outside the neural retina we retrieved scRNA-seq data from the retinal pigmented epithelium (RPE) and choroid14, and cornea15. Single cell expression studies on human scleral and lens tissue have not yet been published; therefore, these tissues were not considered in this assessment.
Fish lines and housing
The mutant lines were generated using CRIPSR-cas9 in WT-AB zebrafish. Single guide RNAs (sgRNA) were designed (Supplementary Data S3) and synthesized according to the CRISPRscan protocol (http://www.crisprscan.org)49. The oligo for sgRNA synsthesis included respectively a: 5′ T7 promotor sequence (aattaatacgactcactata), target site sequence, and a loop sequence (gttttagagctagaaatagc). This oligo was combined with a complementary loop oligo (AAAAGCACCGACTCGGTGCCACTTTTTCAAGTTGATAACGGACTAGCCTTATTTTAACTTGCTATTTCTAGCTCTAAAAC) that includes the RNA loop for Cas9 recognition. PCR was performed to generate the DNA guide oligo's followed by transcription of the sgRNAs by the T7 megascript kit (ThermoFisher). sgRNAs and Cas9 protein were combined, and 1 nl was injected (final concentration of 1500 pg/nl) into WT AB eggs at the one-cell stage49,50,51. Further details of the protocol can be found in Vejnar et al. 2017. Induced mutations were validated by Sanger sequencing, and founders were crossed to generate homozygous knock-out fish. Double knock-outs were generated for the genes with multiple orthologs in zebrafish (Supplementary Data S3). The tjp2ab1367 and tjp2bb1368 lines were generated previously at the University of Oregon50. These lines were crossed to generate the tjp2ab1367tjp2bb1368 line used in this study. Fish lines were raised in tanks with matched population sizes. For spectral domain optical coherence tomography (SD-OCT) and photorefraction zebrafish were anesthetized using a 0.016% tricaine methane sulfonate solution (MS222, Sigma Aldrich), buffered to pH = 7. All animals were treated in accordance with the Dutch animal welfare legislation and the guidelines from the experimental animal health care center (EDC: Experimenteel Dier Centrum) of the Erasmus Medical Center Rotterdam, The Netherlands, and in accordance with the European Commission Council Directive 2010/63/EU (CCD approval, license AVD 1010020186907). In this study we have followed the reporting recommendations described in the ARRIVE guidelines. All zebrafish were exposed to a 14-h light: 10-h dark cycle at 28.5 °C.
RNA isolation from zebrafish eyes and expression analysis
Enucleated eyes were collected from 4 dpf (n = 20 heads), 1 mpf (n = 8 eyes), 2 mpf (n = 6 eyes), 3 mpf (n = 5 eyes), and 12 mpf (n = 4 eyes) WT zebrafish. Lenses were removed under a stereomicroscope (Leica m80), and tissue was collected and frozen in liquid nitrogen. 500 µl of Trizol reagent (Ambion) was used to extract RNA, followed by homogenization using a handheld homogenizer (Pro 200, Pro scientific Inc.) for 2 × 5 s. The homogenate was left at room temperature (RT) for 5 min, and 200 µl of chloroform (Sigma Aldrich, ≥ 99%) was added. The samples were incubated at RT for 15 min and centrifuged at maximum RPM for 15 min at 4 °C. Next, the upper fraction was collected, and RNA was extracted using the RNeasy Mini Kit (Qiagen). The extracted RNA was quantified using a Nanodrop (DS-11 Series Spectrophotometer/fluorometer, DeNovix) and used to synthesize cDNA by the iScript cDNA Synthesis kit (BioRad). The cDNA transcripts were confirmed by PCR and agarose gel electrophoresis, using the primer sets shown in Supplementary Data S2.
Spectral domain optical coherence tomography (SD-OCT)
SD-OCT measurements and analysis were performed as previously described by Quint et al.8. 10 fish (20 eyes) of each genotype were measured at 2 and 4 mpf. Mutant fish included in the study all had < 1% body length variation relative to WT fish (Supplementary Fig. S1), ruling out variability in ocular metrics due to significant changes in body size. A 900 nm SD-OCT Ganymede system (Thorlabs) was used. The field of view was set to 1.7 × 1.7 × 2.2 mm with a pixel depth of 2 µm in the Z-direction. Custom MATLAB software was used for the analysis of the ocular metrics, as described previously8, and the dimensions of the ocular components were corrected using the specific refractive index of each eye component; the cornea 1.3346,47,48, the lens (gradient refractive index) 1.446,47,48,52,53,54, the anterior and vitreous chamber 1.34, and the retina 1.3848,55,56.
Eccentric photorefraction
The refractive status of the zebrafish eyes was determined by eccentric infrared photorefraction. Further details of this protocol can be found elsewhere8. The analysis was done by custom C + + software. Mutant and control lines were measured at 2 and 4 mpf. The slope of the brightness gradient was determined by 100 independent measurements and averaged. This value was converted into refractive error in Diopter by calibration with ophthalmic lenses8.
Lens sphericality and curvature measurements
Lenticular biometry was performed in ex-vivo isolated lenses from 4 mpf WT and tjp2ab1367tjp2bb1368 mutant fish (n = 10 fish, n = 20 lenses). We hypothesized that the measured hyperopic refractive change of the tjp2ab1367tjp2bb1368 mutant was due to changes in the lenticular shape with, as a consequence, a decreased lens curvature. This hypothesis is based on the fact that in zebrafish: (1) the rigid lens cannot accommodate due to a vestigial retractor lentis43,44,45, (2) the full optical power comes from the spherical lens as the contribution of the cornea is negligible in water (refractive index: 1.33)46,47,48, and (3) we observed an increased lens diameter in the tjp2ab1367tjp2bb1368 mutant. However, changes in sphericity cannot be directly determined from the SD-OCT data due to the blockage of infrared light by the iris pigment. To overcome this limitation, we assessed the lens sphericity indirectly by comparing 4 mpf isolated ex-vivo lenses. Lenses were positioned under a light microscope (Olympus DP72) and photographed (Olympus U-TV0.63XC) from 3 different angles. We used the circularity of the great circle (mid-plane), measured from three different angles, as a proxy for the sphericity of each lens (circularity was measured in Fiji (ImageJ)). We observed that the circularity from all three positions was equal to 1 for both the mutant and WT lenses (Supplementary Fig. S2b). This conservation of the circularity/sphericity means that the increase in lens diameter in the tjp2ab1367tjp2bb1368 mutants was equally distributed in all axial directions. This type of homogeneous increase in lens diameter and volume, i.e., when the sphericity stays equal to the WT lenses, leads to a decrease in lens curvature. To confirm this finding, we also directly measured the changes in curvature of the anterior lenticular hemisphere in the 4 mpf SD-OCT data of 4 mpf WT and tjp2ab1367tjp2bb1368 mutants (n = 10 fish, n = 20 lenses). Analysis was done in Fiji (ImageJ) using the Kappa plugin for curvature measurements.
In situ hybridization
Dissected eyes of one-year-old WT zebrafish were stored in 4% Paraformaldehyde (PFA) for two days, fixated using an EFTP tissue processor (Intelsint), and embedded in paraffin prior to sectioning. Embedded eyes were sectioned following standard protocols using a microtome (Microm HM 335 E). Paraffin sections (6 µm) were transferred to Superfrost slides (VWR) and dried at 37 °C. Sections were deparaffinized in xylene for 5 min and 10 min, 100% ethanol for 5 min, 70% ethanol for 10 min, and PBST (1 × Phosphate buffered saline with 0.1% Tween-20) for 5 min. Sections were fixed in 4% PFA for 20 min and washed in PBST for 5 min before pre-hybridization in preheated HYB + buffer (50% Formamide, 5 × SSC (Saline-sodium citrate), 50 µg/ml Heparin, 500 µg/ml tRNA, 0.1% Tween-20, and aqua dest) at 68 °C for 1 h. Sense and anti-sense probes (see Supplementary Data S2) were diluted in HYB + , heated at 95 °C for 2 min, and chilled on ice until needed. Sections were hybridized with the probes overnight at 68 °C in a humidified chamber. Sections were washed in preheated wash-buffer (50/50 HYB- (50% Formamide, 5 × SSC, 0.1% Tween-20, and aqua dest)/0.2 × SSC) at 68 °C for 15 min and in preheated 0.2 × SSC at 68 °C for two times 30 min. Next, sections were washed in respectively 75%; 50%; 25%; 0% 0.2 × SSC in PBST for 15 min, at RT. Sections were blocked for one hour at RT with blocking solution (2% sheep serum, 2 mg/ml Bovine Serum Albumin (Sigma Aldrich) in PBST) followed by incubation with antiDIG-AP antibody (Anti-Digoxigenin-AP, Fab fragments, 1:2000, Roche) diluted in blocking solution (Overnight, 4 °C). Sections were washed in PBST for 3 times 15 min and in Staining buffer NTMT (1 M Tris (pH 9.5), 1 M MgCl2, 5 M NaCl, 10% Tween-20) for 2 times 5 min. Staining solution (12 µl NBT/BCIP (Roche) per 1 ml Staining buffer) was applied to the sections and were incubated in the dark at RT. Incubation time was variable dependent on the probe set, ranging from 1 hour up to 2 days. Sections were respectively washed in PBST for 3 times, 15 min, rinsed in distilled water, hydrated in respectively 95% and 100% ethanol for 1 min each, and finally exposed to xylene for 2 times, 2 min. Slides were mounted with Entellan (Sigma Aldrich) and dried overnight at 37 °C. Imaging was performed on an Olympus DX40 microscope with an Olympus DP73 camera. Olympus cellSens software was used for image processing.
Statistical analysis and sample size estimation
We analyzed the SD-OCT and photorefraction by fitting a mixed model as implemented in GraphPad Prism 8.0. This mixed model uses a compound symmetry covariance matrix, and is fitted using Restricted Maximum Likelihood (REML). With this model both eyes of the same fish are treated as repeated measures. Outliers were detected by Grubbs’ test (p < 0.01) and excluded from the analysis. The body length measurements were analyzed with Welch’s ANOVA, also in GraphPad Prism 8.0.
To estimate the sample size for the SD-OCT and photorefraction assessment, we used the GLIMMPSE software57 for repeated measures. Estimated effect sizes (i.e., approximately 4% change in axial length and approximately 6% change in photorefraction) were based on a previous study8, alpha-error was set to 0.05 and power to 0.95. Based on these parameters, a minimum size of 20 eyes (10 fish) per group was required (power = 0.953).
Data availability
All data generated or analyzed during this study are included in this published article and its supplementary information files. Any additional (raw) data is available from the corresponding author on request.
References
Haarman, A. E. G. et al. The complications of myopia: A review and meta-analysis. Invest. Ophthalmol. Vis. Sci. 61, 49 (2020).
Flitcroft, D. I. The complex interactions of retinal, optical and environmental factors in myopia aetiology. Prog. Retin. Eye Res. 31, 622–660 (2012).
Holden, B. A. et al. Global prevalence of myopia and high myopia and temporal trends from 2000 through 2050. Ophthalmology 123, 1036–1042 (2016).
Tedja, M. S. et al. Genome-wide association meta-analysis highlights light-induced signaling as a driver for refractive error. Nat. Genet. 50, 834–848 (2018).
Hysi, P. G. et al. Meta-analysis of 542,934 subjects of European ancestry identifies new genes and mechanisms predisposing to refractive error and myopia. Nat. Genet. 52, 401–407 (2020).
Kiefer, A. K. et al. Genome-wide analysis points to roles for extracellular matrix remodeling, the visual cycle, and neuronal development in myopia. PLoS Genet. 9, e1003299 (2013).
Quint, W. H. et al. Zebrafish: An in vivo screening model to study ocular phenotypes. Transl. Vis. Sci. Technol. 11, 17 (2022).
Quint, W. H. et al. Loss of Gap Junction Delta-2 (GJD2) gene orthologs leads to refractive error in zebrafish. Commun. Biol. 4, 1–14 (2021).
Pruim, R. J. et al. LocusZoom: Regional visualization of genome-wide association scan results. Bioinformatics 26, 2336–2337 (2010).
Lukowski, S. W. et al. A single-cell transcriptome atlas of the adult human retina. EMBO J. 38, e100811 (2019).
Cowan, C. S. et al. Cell types of the human retina and its organoids at single-cell resolution. Cell 182, 1623-1640.e34 (2020).
Voigt, A. P. et al. Molecular characterization of foveal versus peripheral human retina by single-cell RNA sequencing. Exp. Eye Res. 184, 234–242 (2019).
Thul, P. J. et al. A subcellular map of the human proteome. Science 356, 6340 eaal3321 (2017).
Voigt, et al. Single-cell transcriptomics of the human retinal pigment epithelium and choroid in health and macular degeneration. Proc. Natl. Acad. Sci. U. S. A. 116, 24100–24107 (2019).
Collin, J. et al. A single cell atlas of human cornea that defines its development, limbal progenitor cells and their interactions with the immune cells. Ocul. Surf. 21, 279–298 (2021).
Postlethwait, J., Amores, A., Cresko, W., Singer, A. & Yan, Y.-L. Subfunction partitioning, the teleost radiation and the annotation of the human genome. Trends Genet. 20, 481–490 (2004).
Pardue, M. T. et al. High susceptibility to experimental myopia in a mouse model with a retinal on pathway defect. Invest. Ophthalmol. Vis. Sci. 49, 706–712 (2008).
Glickstein, M. & Millodot, M. Retinoscopy and eye size. Science 168, 605–606 (1970).
Schmucker, C. & Schaeffel, F. A paraxial schematic eye model for the growing C57BL/6 mouse. Vision Res. 44, 1857–1867 (2004).
Morissette, N. & Carbonetto, S. Laminin alpha 2 chain (M chain) is found within the pathway of avian and murine retinal projections. J. Neurosci. 15, 8067–8082 (1995).
Libby, R. T. et al. Laminin expression in adult and developing retinae: Evidence of two novel CNS laminins. J. Neurosci. 20, 6517–6528 (2000).
Toti, P. et al. Localization of laminin chains in the human retina: Possible implications for congenital muscular dystrophy associated with alpha 2-chain of laminin deficiency. Neuromuscul. Disord. 7, 21–25 (1997).
Gupta, V. A. et al. A splice site mutation in laminin-α2 results in a severe muscular dystrophy and growth abnormalities in zebrafish. PLoS ONE 7, e43794 (2012).
Sztal, T. E., Sonntag, C., Hall, T. E. & Currie, P. D. Epistatic dissection of laminin-receptor interactions in dystrophic zebrafish muscle. Hum. Mol. Genet. 21, 4718–4731 (2012).
Fabian, L. & Dowling, J. J. Zebrafish models of LAMA2-related congenital muscular dystrophy (MDC1A). Front. Mol. Neurosci. 13, 122 (2020).
Colognato, H. et al. Identification of dystroglycan as a second laminin receptor in oligodendrocytes, with a role in myelination. Development 134, 1723–1736 (2007).
Burkin, D. J. & Kaufman, S. J. The α7β1 integrin in muscle development and disease. Cell Tissue Res. 296, 183–190 (1999).
Oliveira, J. et al. LAMA2 gene analysis in a cohort of 26 congenital muscular dystrophy patients. Clin. Genet. 74, 502–512 (2008).
Sarkozy, A., Foley, A. R., Zambon, A. A., Bönnemann, C. G. & Muntoni, F. LAMA2-related dystrophies: Clinical phenotypes, disease biomarkers, and clinical trial readiness. Front. Mol. Neurosci. 13, 123 (2020).
Verhoeven, V. J. M. et al. Genome-wide meta-analyses of multiancestry cohorts identify multiple new susceptibility loci for refractive error and myopia. Nat. Genet. 45, 314–318 (2013).
Lin, J. C., Ho, W.-H., Gurney, A. & Rosenthal, A. The netrin-G1 ligand NGL-1 promotes the outgrowth of thalamocortical axons. Nat. Neurosci. 6, 1270–1276 (2003).
Barallobre, M. J., Pascual, M., Del Río, J. A. & Soriano, E. The Netrin family of guidance factors: Emphasis on Netrin-1 signalling. Brain Res. Brain Res. Rev. 49, 22–47 (2005).
Choi, Y. et al. NGL-1/LRRC4C deletion moderately suppresses hippocampal excitatory synapse development and function in an input-independent manner. Front. Mol. Neurosci. 12, 119 (2019).
Liao, X. et al. Genetic association study of KCNQ5 polymorphisms with high myopia. Biomed Res. Int. 2017, 3024156 (2017).
Schroeder, B. C., Hechenberger, M., Weinreich, F., Kubisch, C. & Jentsch, T. J. KCNQ5, a novel potassium channel broadly expressed in brain, mediates M-type currents. J. Biol. Chem. 275, 24089–24095 (2000).
Lehman, A. et al. Loss-of-function and gain-of-function mutations in KCNQ5 cause intellectual disability or epileptic encephalopathy. Am. J. Hum. Genet. 101, 65–74 (2017).
Pattnaik, B. R. & Hughes, B. A. Effects of KCNQ channel modulators on the M-type potassium current in primate retinal pigment epithelium. Am. J. Physiol. Cell Physiol. 302, C821–C833 (2012).
Zhang, X., Yang, D. & Hughes, B. A. KCNQ5/K(v)7.5 potassium channel expression and subcellular localization in primate retinal pigment epithelium and neural retina. Am. J. Physiol. Cell Physiol. 301, C1017–C1026 (2011).
Yang, Q. et al. The changes of KCNQ5 expression and potassium microenvironment in the retina of myopic guinea pigs. Front. Physiol. 12, 790580 (2021).
Xu, Z., Jiang, X., Hammond, C. J., Mahroo, O. A. R. & Hysi, P. G. Associations between myopia risk variants and retinal electrophysiological parameters: A role of KCNQ5 in myopia development. Invest. Ophthalmol. Vis. Sci. 62, 2282–2282 (2021).
Farnsworth, D. R., Saunders, L. M. & Miller, A. C. A single-cell transcriptome atlas for zebrafish development. Dev. Biol. 459, 100–108 (2020).
Farnsworth. UCSC Cell Browser. In A Single-Cell Transcriptome Atlas for Zebrafish Development https://zebrafish-dev.cells.ucsc.edu (2019).
Collery, R. F., Veth, K. N., Dubis, A. M., Carroll, J. & Link, B. A. Rapid, accurate, and non-invasive measurement of zebrafish axial length and other eye dimensions using SD-OCT allows longitudinal analysis of myopia and emmetropization. PLoS ONE 9, e110699 (2014).
Gestri, G., Link, B. A. & Neuhauss, S. C. F. The visual system of zebrafish and its use to model human ocular diseases. Dev. Neurobiol. 72, 302–327 (2012).
Gray, M. P., Smith, R. S., Soules, K. A., John, S. W. M. & Link, B. A. The aqueous humor outflow pathway of zebrafish. Invest. Ophthalmol. Vis. Sci. 50, 1515–1521 (2009).
Greiling, T. M. S. & Clark, J. I. The transparent lens and cornea in the mouse and zebra fish eye. Semin. Cell Dev. Biol. 19, 94–99 (2008).
Verma, Y., Divakar Rao, K. & Gupta, P. K. In-vivo imaging Of adult zebrafish using optical coherence tomography. In 1st Canterbury Workshop on Optical Coherence Tomography and Adaptive Optics (SPIE, 2008). https://doi.org/10.1117/12.814914.
Rao, D., Verma, Y., Patel, H. & Gupta, P. Non-invasive ophthalmic imaging of adult zebrafish eye using optical coherence tomography. Curr. Sci. 90, (2006).
Vejnar, C. E., Moreno-Mateos, M. A., Cifuentes, D., Bazzini, A. A. & Giraldez, A. J. Optimized CRISPR–Cas9 system for genome editing in zebrafish. Cold Spring Harb. Protoc. (2016).
Marsh, A. J., Michel, J. C., Adke, A. P., Heckman, E. L. & Miller, A. C. Asymmetry of an intracellular scaffold at vertebrate electrical synapses. Curr. Biol. 27, 3561-3567.e4. https://doi.org/10.1016/j.cub.2017.10.011 (2017).
Shah, A. N., Moens, C. B. & Miller, A. C. Targeted candidate gene screens using CRISPR/Cas9 technology. Methods Cell Biol. 135, 89–106 (2016).
Hoshino, M. et al. Optical properties of in situ eye lenses measured with X-ray Talbot interferometry: A novel measure of growth processes. PLoS ONE 6, e25140 (2011).
Verma, Y., Rao, K. D., Suresh, M. K., Patel, H. S. & Gupta, P. K. Measurement of gradient refractive index profile of crystalline lens of fisheye in vivo using optical coherence tomography. Appl. Phys. B 87, 607–610 (2007).
Young, L. K., Jarrin, M., Saunter, C. D., Quinlan, R. A. & Girkin, J. M. Non-invasive in vivo quantification of the developing optical properties and graded index of the embryonic eye lens using SPIM. Biomed. Opt. Express 9, 2176–2188 (2018).
Drexler, W. Optical coherence tomography: Technology and applications. In 2013 Conference on Lasers & Electro-Optics Europe & International Quantum Electronics Conference CLEO EUROPE/IQEC (IEEE, 2013). https://doi.org/10.1109/cleoe-iqec.2013.6802013.
Hariri, S. et al. Limiting factors to the OCT axial resolution for in-vivo imaging of human and rodent retina in the 1060 nm wavelength range. Opt. Express 17, 24304–24316 (2009).
Kreidler, S. M. et al. GLIMMPSE: Online power computation for linear models with and without a baseline covariate. J. Stat. Softw. 54, 10 (2013).
Acknowledgements
We would like to thank Beerend Winkelman and Frank Schaeffel for their technical support. Funding for this work was supported by the European Research Council (ERC) under the European Union’s Horizon 2020 Research and Innovation Programme (grant 648268) and the Netherlands Organisation for Scientific Research (NWO, grant 91815655 and VidW.1154.18.046), UitZicht (project 2018-29), and Prof Dr. Henkes Stichting.
Author information
Authors and Affiliations
Contributions
W.H.Q., M.M.S., R.W., C.C.W.K. and A.I.I., contributed to the design of the study. W.H.Q., N.C.C.J.K, and K.C.D.T., performed the experiments and screened the mutants. R.W., C.C.W.K. and A.I.I., supervised the study. W.H.Q. and A.I.I., drafted the manuscript. C.C.W.K., A.M., M.M.S., and R.W., critically reviewed the manuscript. All the authors read and agreed on the final draft of the manuscript. The authors declare no conflict of interest.
Corresponding author
Ethics declarations
Competing interests
The authors declare no competing interests.
Additional information
Publisher's note
Springer Nature remains neutral with regard to jurisdictional claims in published maps and institutional affiliations.
Rights and permissions
Open Access This article is licensed under a Creative Commons Attribution 4.0 International License, which permits use, sharing, adaptation, distribution and reproduction in any medium or format, as long as you give appropriate credit to the original author(s) and the source, provide a link to the Creative Commons licence, and indicate if changes were made. The images or other third party material in this article are included in the article's Creative Commons licence, unless indicated otherwise in a credit line to the material. If material is not included in the article's Creative Commons licence and your intended use is not permitted by statutory regulation or exceeds the permitted use, you will need to obtain permission directly from the copyright holder. To view a copy of this licence, visit http://creativecommons.org/licenses/by/4.0/.
About this article

Cite this article
Quint, W.H., Tadema, K.C.D., Kokke, N.C.C.J. et al. Post-GWAS screening of candidate genes for refractive error in mutant zebrafish models. Sci Rep 13, 2017 (2023). https://doi.org/10.1038/s41598-023-28944-y
Received:
Accepted:
Published:
DOI: https://doi.org/10.1038/s41598-023-28944-y
Comments
By submitting a comment you agree to abide by our Terms and Community Guidelines. If you find something abusive or that does not comply with our terms or guidelines please flag it as inappropriate.
