
Abstract
Chlorella sp. TLD 6B, a microalgae growing in the Taklamakan Desert, Xinjiang of China, is a good model material for studying the physiological and environmental adaptation mechanisms of plants in their arid habitats, as its adaptation to the harsh desert environment has led to its strong resistance. However, when using real-time quantitative polymerase chain reaction (RT-qPCR) to analyze the gene expression of this algae under abiotic stress, it is essential to find the suitable endogenous reference genes so to obtain reliable results. This study assessed the expression stability of 9 endogenous reference genes of Chlorella sp. TLD 6B under four abiotic stresses (drought, salt, cold and heat). These genes were selected based on the analysis results calculated by the three algorithmic procedures of geNorm, NormFinder, and BestKeeper, which were ranked by refinder. Our research showed that 18S and GTP under drought stress, 18S and IDH under salt stress, CYP and 18S under cold stress, GTP and IDH under heat stress were the most stable endogenous reference genes. Moreover, UBC and 18S were the most suitable endogenous reference gene combinations for all samples. In contrast, GAPDH and α-TUB were the two least stable endogenous reference genes in all experimental samples. Additionally, the selected genes have been verified to be durable and reliable by detecting POD and PXG3 genes using above endogenous reference genes. The identification of reliable endogenous reference genes guarantees more accurate RT-qPCR quantification for Chlorella sp. TLD 6B, facilitating functional genomics studies of deserts Chlorella as well as the mining of resistance genes.
Introduction
Algae are widely distributed in freshwater, seawater, humid soil, desert and extreme environments. The order microalgae is widely used and studied in bioenergy, medical treatment, wastewater treatment and food1,2,3. Deserts and arid lands cover one-third of the Earth’s land surface and are biologically challenging ecosystems. Microalgae are a vital component of desert biocrusts in different regions of the world4,5,6,7, and the adaptation of desert microalgae to harsh desert environments has led to a diversity of adaptive mechanisms (including ecological, physiological, morphological structural, genetic, etc.). Desert algae have higher photosynthetic efficiency than freshwater algae and stronger resistance to drought, salt, ultraviolet (UV), and temperature extremes8,9,10,11,12. Therefore, desert microalgae are better materials for studying biological and environmental adaptation mechanisms and mining resistance genes. Chlorella sp. TLD 6B is a single celled green alga isolated from biological crusts in Taklimakan Desert13. It has the advantages of high photosynthetic efficiency and stress resistance14. Thus, it is important to elucidate the molecular mechanism of the rapid growth and stress adaptation of chlorella for its utilization and protection of soil desertification. Based on the above reasons, our group generated a full-length transcriptome database of Chlorella sp. TLD 6B using a combination of single-molecule real-time (SMRT) sequencing (unpublished) and Illumina sequencing15.
Currently, gene expression studies have become an important tool for revealing gene functions and plant stress resistance molecular mechanisms. Real-time quantitative polymerase chain reaction (RT-qPCR) has turned into a standard method for studying gene expression due to its high sensitivity, reproducibility, specificity, and high throughput16,17,18,19. To effectively control the differences between the initial templates of each sample and ensure the reliability of RT-qPCR results, using endogenous reference genes for standardized analysis20,21,22,23 is a must. It has been found that some reference genes are stably expressed in different tissues and at different developmental stages, however, their expression stability can be altered to varying degrees upon treatment with some abiotic stresses24,25,26. Currently, there are still no endogenous reference genes that can be applied to more than one species, and even for the same species, hardly any reference genes are universal to examine multiple abiotic stress treatments. To this end, it is necessary to screen for stable endogenous reference genes in specific species. To date, many researches have been reported to differentiate this kind of genes in various species, such as Schima superba27, Isodon rubescens28, Miscanthus sacchariflorus29, Suaeda glauca30, Taxus spp31, Glehnia littoralis32. Although some papers33,34,35,36,37,38 have also studied on those reference genes in algae, given to the differences among microalgae species, these genes cannot be directly used as the reference genes of desert Chlorella to study its gene expression. Therefore, stable endogenous reference genes in desert Chlorella have to be screened for further studies.
The genomic information of desert microalgae is unknown, which hinders the further study of its gene function. In this paper, based on transcriptome data15 of Chlorella sp. TLD 6B and reported reference genes in other species, we selected 18S rRNA (18S), Cyclophilin (CYP), Elongation factor 1α (EF-1α), Glyceraldehyde-3-phosphate Dehydrogenase (GAPDH), GTP binding protein (GTP), NADP-isocitrate dehydrogenase (IDH), Ubiquitin-conjugating enzyme (UBC), tubulin alpha chain (α-TUB), and tubulin beta chain (β-TUB) as endogenous reference genes39,40,41,42. Peroxidase (POD)43 and Peroxygenase 3 (PXG3)44 stress inducible genes were used to verify the stability of the above genes under different stress conditions. For Chlorella sp. TLD 6B after drought, salt, cold, heat treatment, we used GeNorm45, NormFinder46, bestkeeper47 and RefFind48 software to analyze the stability of endogenous reference genes (Fig. 1). Reliable endogenous reference genes were selected to ensure more accurate RT-qPCR quantification of Chlorella TLD 6B. This study not only promoted the functional genomics of Chlorella desert, but also laid a foundation for the exploration of resistance genes and the molecular mechanism of Chlorella sp.TLD 6B adaptation to extreme desert environment.
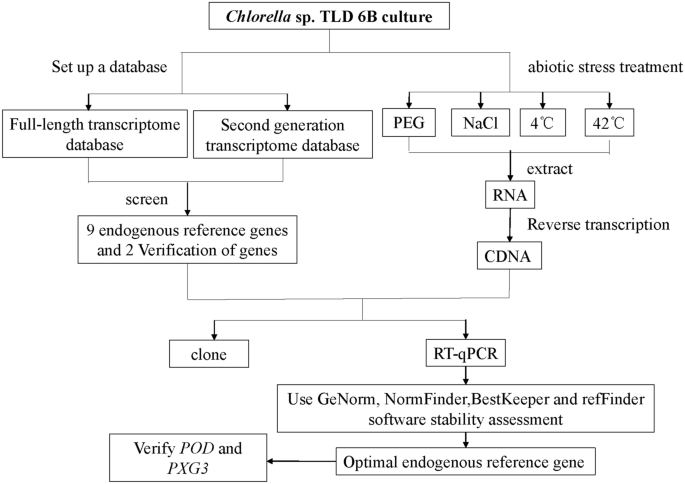
Experimental framework.
Results
Primer design
After the comparison and validation of POD, PXG3 and the 9 endogenous reference genes in NCBI, primers were designed with Primer Premier 5 according to the principle of RT-qPCR primer design (Table 1). The PCR products of nine candidate reference genes were detected by agarose gel electrophoresis, and each gene obtained a single specific desired size band (Supplementary Fig. S1).
Expression levels and variation of the endogenous reference genes
RT-qPCR was performed to detect the expression levels of nine genes. The results showed that the Ct values of all endogenous reference genes under different treatments ranged from 10.9 ~ 32.5 (Fig. 2), among which the average Ct value of 18S was 13.4, with the highest expression and the lowest variation range (10.9 ~ 16.2) among the endogenous reference genes. Still, the highest coefficient of variation was 9.7%. α-TUB, CYP, and the mean Ct values of α-TUB, CYP, and GAPDH were 28.6, 28.8 and 28.4, respectively, with the lowest expression and coefficients of variation of 6.3, 5.8 and 5.7%, respectively, with GAPDH having the smallest coefficient of variation among all samples. The mean Ct values of EF1α, UBC, β-TUB, and IDH were 19.1, 24.9, 22.9, and 23.8 respectively.

Ct value of endogenous reference genes across all treatments under four abiotic stresses. The line on each box represents the median. The little box represents the mean. The lower and upper edges of boxes show the 25th and 75th percentiles, respectively, and the circles represent outliers.
Stability assessment of endogenous reference genes using GeNorm software
GeNorm program was used to calculate the stability value (M value) of gene expression of nine endogenous reference genes, and these genes were ranked. M < 1.5 was used as the threshold for excluding stable genes, and the lower the M value, the higher the stability. According to this criterion, UBC and 18S were the most stable endogenous reference genes in the PEG and NaCl treatment, GTP and IDH were the most stable endogenous reference genes in the 4 °C treatment and all samples, CYP and IDH were the most stable endogenous reference genes in the 42 °C treatment (Fig. 3). α-TUB and GAPDH were the least stable endogenous reference genes in NaCl, 42 °C and Total, β-TUB and EF1α were the least stable endogenous reference genes in the 4 °C treatment, and GAPDH and CYP were the least stable endogenous reference genes in PEG. The geNorm programme calculates the gene expression stability value (M value) and ranks the reference Genes.
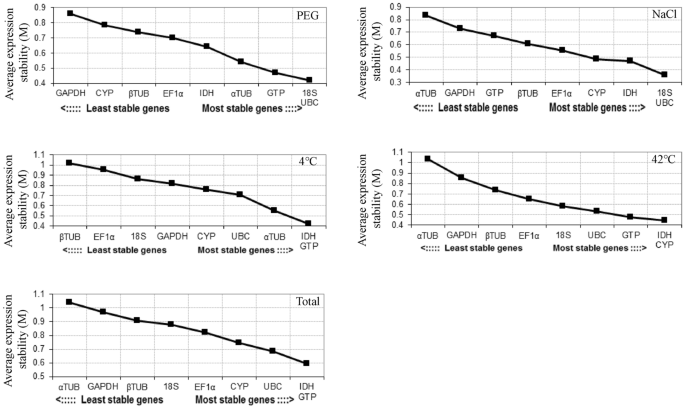
The expression stability values (M) of nine endogenous reference genes were determined by GeNorm software. The most stable and least stable genes are on the right and left. PEG PEG-6000 drought treatment, NaCl 200 mM NaCl salt treatment, 42 °C 42 °C high temperature treatment, 4 °C 4 °C cold treatment, Total Pooled samples from all treatments.
Pairwise variation (Vn/Vn+1) values were calculated using the GeNorm software program to determine the optimal number of endogenous reference genes required for qRT-PCR to normalize target gene expression levels. Small variations between Vn/Vn+1 and Vn+1/Vn+2 indicated that the addition of another endogenous reference gene had no significant effect on normalization. The Vn/Vn+1 value of 0.15 was considered to be the threshold for deciding whether to add an endogenous reference gene was considered as the threshold value. The results showed (Fig. 4) V2/3 values below 0.15 for PEG (0.149) and 42 °C (0.148), indicating that only two suitable endogenous reference genes are required in PEG and 42 °C stress. V3/4 values below 0.15 for NaCl (0.106) and three endogenous reference genes are needed in NaCl stress. However, a threshold of 0.15 should not be considered a strict criterion, and some reports found higher threshold values for Vn/Vn+143,44,45. The data showed a slight variation between V2/3 (0.193) and V3/4 (0.201) in the 4 °C samples, suggesting that three endogenous genes are required in 4 °C stress. There was a slight variation in the total samples between V3/4 (0.176) and V4/5 (0.167), indicating the need for 4 endogenous reference genes in all samples.

Pairwise variation (V) of endogenous reference genes, as calculated by GeNorm software. Vn/Vn+1 values were used to determine the optimal number of endogenous reference genes. A cut-off of 0.15 (Vn value) is usually applied. PEG PEG-6000 drought treatment, NaCl 200 mM NaCl salt treatment, 42 °C 42 °C high temperature treatment, 4 °C 4 °C cold treatment, Total pooled samples from all treatments.
Stability assessment of endogenous reference genes using NormFinder software
The stability values of the nine endogenous reference genes were calculated using the NormFinder software program, with lower values representing higher stability. GTP was most stable in PEG (0.222) and 42 °C (0.165); IDH was most stable in NaCl (0.140); CYP was most stable at 4 °C (0.217); and UBC was most stable in all samples (Total. 0.347) were the most stable (Table 2). The stability levels of the endogenous reference genes generated using NormFinder were slightly different from those generated using GeNorm. The endogenous reference genes that were the most stable in NormFinder analysis in PEG, NaCl, 4 °C, 42 °C and Total (GTP, IDH, CYP, GTP and UBC) had their stability as third (GTP, IDH), fifth (CYP) and third (GTP, UBC) in GeNorm analysis, respectively.
Stability evaluation of the endogenous reference genes using BestKeeper software
The Ct values were calculated using BestKeeper software to evaluate the expression stability of the nine endogenous reference genes. The principle of determination was that the greater the correlation coefficient, the smaller the standard deviation and the coefficient of variation, the better the stability of the endogenous reference genes, and vice versa, the worse the stability. In PEG β-TUB (4.66 ± 1.08) was the most stable endogenous reference gene; in NaCl and in CYP (2.97 ± 0.84) was the most stable endogenous reference gene; in 4 °C β-TUB (3.84 ± 0.91) was the most stable endogenous reference gene; in 42 °C and Total 18S (6.82 ± 0.86, 7.79 ± 1.04) was the most stable endogenous reference gene (Table 3). 18S was ranked first in all treatments and was a relatively stable endogenous reference gene, while α-TUB was ranked second in all treatments and was a relatively unstable endogenous reference gene. For various stresses, the stability ranking of the endogenous reference genes generated by BestKeeper was different from that of GeNorm and NormFinder.
Ranking of endogenous reference genes using RefFinder software
The RefFinder software program is used to determine the overall ranking of endogenous reference genes. The program integrates GeNorm, NormFinder, BestKeeper and △Ct methods. The ranking order under PEG treatment is: 18S > GTP > UBC > IDH > β-TUB > EF1α > CYP > α-TUB > GAPDH. Under NaCl treatment is: 18S > IDH > UBC > CYP > GTP > EF1α > β-TUB > GAPDH > α-TUB. Under 4 °C treatment is CYP > 18S > UBC > GTP > IDH > β-TUB > α-TUB > EF1α > GAPDH. At 42 °C, the sorting order was: GTP > IDH > 18S > CYP > UBC > EF1α > β-TUB > GAPDH > α-TUB. At all treatments, the sorting order was: UBC > 18S > CYP > GTP > EF1α > IDH > β-TUB > GADPH > α-TUB (Table 4). 18S was most stable in PEG and NaCl; CYP was most stable in 4 °C; GTP was most stable in 42 °C; UBC was most stable in all samples. The α-TUB and GAPDH were unstable in all stress treatments.
Target gene expression and endogenous reference gene validation
To verify the reliability of the endogenous reference genes obtained in the above analysis, the expression patterns of the target genes POD and PXG3 were analyzed in PEG, NaCl, 4 °C, and 42 °C stress treatments (Figs. 5, 6).The top two stable endogenous reference genes (18S, GTP), the combination of endogenous reference genes (18S + GTP), and the least stable endogenous reference gene (GAPDH) in PEG stress were used for normalization analysis, respectively. The expression trends of the target genes POD and PXG3 were consistent, with the highest expression at 24 h. The expression of the POD gene was significantly different at 12 h and 24 h when GAPDH was used with 18S + GTP and 18S, GTP, respectively, as the endogenous reference genes. The most stable endogenous reference gene (18S, IDH), the combination of endogenous reference genes (18S + IDH), and the least stable endogenous reference gene (α-TUB) were used for normalization analysis in NaCl stress, respectively. The expression of the target genes POD and PXG3 showed consistent trends and no significant differences in expression when the endogenous reference genes were 18S, IDH, and 18S + IDH (except PXG3 at 24 h). However, the expression trends of POD and PXG3 were inconsistent when α-TUB was used as an endogenous reference gene with 18S, IDH, and 18S + IDH, respectively, and the expressions were significantly different at 6 h, 12 h and 24 h. The endogenous reference genes with the highest stability ranking (CYP, 18S), the combination of endogenous reference genes (CYP + 18S), and the least stable endogenous reference gene (GAPDH) were used for normalization analysis in cold stress at 4 °C, respectively. The target gene POD expression trends were inconsistent except at 12 h. The expression trends of target genes POD and PXG3 were consistent at other time points; meanwhile, the expression of POD and PXG3 were significantly different when GAPDH was used as an endogenous reference gene with 18S, IDH, and 18S + IDH, respectively. The endogenous reference genes ranked first in stability (GTP, IDH), the combination of endogenous reference genes (GTP + IDH) and the least stable endogenous reference gene (α-TUB) were used for normalization analysis in heat stress at 42 °C, respectively; The target gene POD expression trends were inconsistent at 6 h, 12 h and 24 h. And the expression trend of PXG3 was consistent. With 18S, IDH, and 18S + IDH, the expression trends of target genes POD and PXG3 were consistent, and there was no significant difference in expression (except for POD at 12 h). In addition, the expression of POD and PXG3 were significantly different when α-TUB was used as an endogenous reference gene with GTP, IDH, and GTP + IDH, respectively.
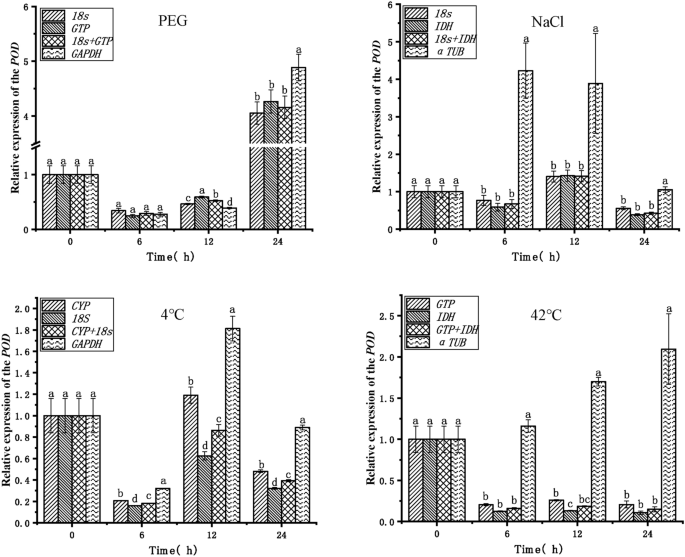
Relative expression of the POD target gene for validation of selected endogenous reference genes. PEG PEG-6000 drought treatment, NaCl 200 mM NaCl salt treatment, 4 °C 4 °C cold treatment, 42 °C 42 °C high temperature treatment. Different lowercase letters represent statistically significant differences as determined by one-way ANOVA (P < 0.05, Duncan’s multiple range tests).
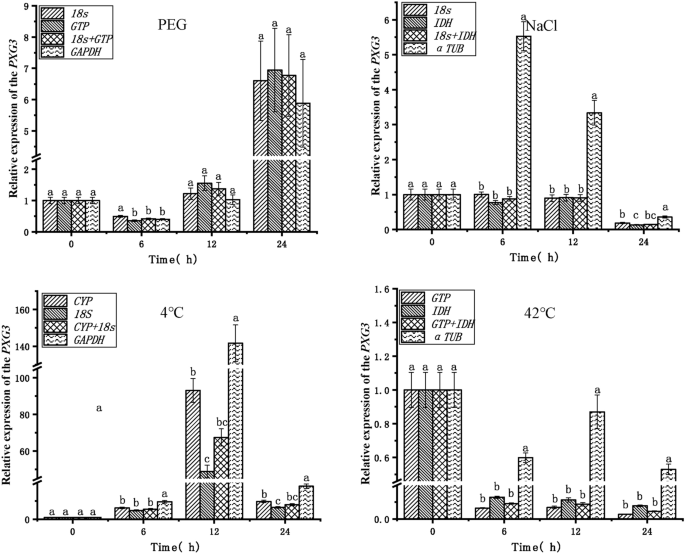
Relative expression of the PXG3 target gene for validation of selected endogenous reference genes. PEG PEG-6000 drought treatment, NaCl 200 mM NaCl salt treatment, 4 °C 4 °C cold treatment, 42 °C 42 °C high temperature treatment. Different lowercase letters represent statistically significant differences as determined by one-way ANOVA (P < 0.05, Duncan’s multiple range tests).
Discussion
Using stable endogenous reference genes under different stress conditions is essential for the correct analysis, presentation, and interpretation of gene expression. We here analyzed the stability of genes using the commonly used endogenous reference gene screening software geNorm, NormFinder, Bestkeeper, and RefFinder software to determine the best endogenous reference genes for Chlorella sp. TLD 6B under different stress conditions. The results showed that the stability of these genes differed in different software evaluations.
The analysis with geNorm, NormFinder, and Bestkeeper under water, salt, low temperature, and high-temperature stresses, respectively, revealed that the ranking of GTP and β-TUB were very different, especially the scale of Bestkeeper with geNorm and NormFinder. This difference is mainly caused by these three methods45,46,47. We also found that most of the genes were ranked almost the same in geNorm and NormFinder, mainly due to the similar operating principles of GeNorm and NormFinder45,46. In this regard, the data from GeNorm, NormFinder and BestKeeper were evaluated comprehensively with RefFinder software to filter stable ones or genomic collaborations as endogenous reference gene24,49. In addition, GeNorm determines the number of required optimal genes based on Vn/Vn+1 values50,51,52. This feature of GeNorm has been utilized in most studies to identify the optimum number of endogenous reference gene. In this experiment, it was considered that two genes were required in drought and 42 °C treatment, while three endogenous reference genes were required in NaCl and 4 °C treatment.
These endogenous reference genes in this experiment showed different expression stability under various stress treatments. Among them, 18S, GTP, IDH and CYP and their combinations were the most stable endogenous reference genes (Table 4). Several genes have been shown to be good stable samples, including 18S53,54, IDH55,56, and CYP57,58. In addition, the experimental results showed that GTP can be used as a stable results which is contrary to Zhao’s results41; GAPDH and α-TUB were the least stable genes under various stresses in the present experimental catch, but were the most stable reference in some reported endogenous reference gene studies59,60,61, which is an indication that differences in species or experimental conditions lead to uniqueness of genes, therefore, the selection of suitable samples under different stress conditions is necessary to achieve reliable experimental results. The significant difference in GAPDH proteins under drought stress found in our previous study illustrates the instability of GAPDH genes in Chlorella sp. TLD 6B under abiotic stresses62.
The reliability of the stability of the endogenous reference genes was further verified by determining the expression patterns of the target genes POD and PXG3 under drought, salt, and low and high-temperature stresses. The results showed that the expression patterns of target genes POD and PXG3 under various stresses had obvious patterns of change when the most stable genes or combinations of endogenous reference genes were selected as controls according to different stress conditions. However, the expression patterns of the target genes POD and PXG3 were significantly different or even showed different expression patterns between the most unstable endogenous reference gene, GAPDH, as the endogenous reference gene under drought and cold stress and α-TUB as the endogenous reference gene under salt and high temperature stress when the most stable endogenous reference gene or endogenous reference gene combination was selected (Fig. 4). This suggests that GAPDH is an unreliable endogenous reference gene in Chlorella sp. TLD 6B under drought and cold stress, and α-TUB is an unreliable endogenous reference gene under salt and high temperature stress. Similarly, it has been reported that the use of unstable endogenous reference genes as endogenous reference gene for RT-qPCR analysis detected significant differences in the expression levels of the target genes, leading to misinterpretation of the experimental results52,63. Therefore, selecting a suitable endogenous reference gene is important to normalize the target gene expression data generated by RT-qPCR.
Conclusion
In summary, we evaluated the expression stability of nine endogenous reference genes in Chlorella sp. TLD 6B under four different abiotic stresses using RT-qPCR and four analytical software. We recommend using different endogenous reference genes when stress treatments are applied to Chlorella sp. TLD 6B. The 18S and GTP are suitable for gene expression analysis under drought stress, while 18S and IDH are the most stable genes in salt stress. CYP and 18S maintain regular expression in low temperature stress, and the combination of GTP and IDH can be used as stable genes under high temperature stress. The results of this study will help to improve the accuracy of quantitative expression of target genes analyzed by RT-qPCR in Chlorella TLD6B under four common abiotic stresses, which not only promotes the functional genomics research of Chlorella desert, but also reveals the molecular mechanism of Chlorella TLD6B's rapid growth and adaptation to extreme desert environments, and is of great significance for its utilization and protection of soil desertification.
Methods
Experimental materials and treatment
The laboratory preserved Chlorella sp. TLD 6B was inoculated in BBM liquid medium for expansion. The expanded algae were re-inoculated into 200 mL triangular flasks in a 10:1 ratio and treated with abiotic stress after growth to the logarithmic growth phase (OD680 = 0.8). Among them, BBM medium with 15% PEG-6000 was used to simulate drought stress; BBM medium with 200 mM NaCl was used to simulate salt stress; and cold and heat stresses were carried out in artificial climate incubators at 4 °C and 42 °C, respectively. The Chlorella was collected at 0 h (ck), 6 h, 12 h and 24 h for each treatment, immediately snap-frozen in liquid nitrogen, and stored at − 80 °C. Three biological replicates were used for each stress treatment.
Endogenous reference gene selection and primer design
According to the published Chlorella sp.TLD 6B transcriptome sequencing data (NCBI GEO: GSE162916), 9 endogenous reference genes (based on their FPKM and fold change values) were selected24. Chlorella sp. TLD 6B was evaluated by full-length transcriptome sequencing using PacBio instrument. Will get to the transcription of this sequence with TransDecoder after redundancy (https://github.com/TransDecoder/TransDecoder/Releases) to identify transcription candidate in this sequence coding region, Chlorella sp. TLD 6B CDS library is obtained. BLAST software (version 2.2.26) was used to compare the obtained non-redundant transcript sequences with NCBI non-redundant protein (NR), Swissprot (http://www.expasy.org/sprot/), GO (http://www.geneontology.org), COG(http://www.ncbi.nlm.nih.gov/COG/), Pfam (http://pfam.xfam.org/), KOG and KEGG databases (http://www.genome.jp/kegg) to obtain the annotation information of CDS database64. Primers for a total of nine genes, 18S, CYP, EF-1α, GAPDH, GTP, IDH, UBC, α-TUB, and β-TUB were designed using Primer Premier 5(Premier, Canada) software according to Information about the CDS library and RT-qPCR primer design principles, and Sangon Biotech (Shanghai, China) synthesized the corresponding primers (Table 1).
Total RNA isolation, cDNA synthesis, endogenous reference genes cloning, and RT-qPCR
The total RNA for each sample of Chlorella sp. TLD 6B was extracted with the RNAprep Pure Plant Kit (Tiangen Biotech, Beijing, China) according to the manufacturer’s protocol. RNA integrity was determined by 1.5% agarose gel electrophoresis, and RNA concentration and quality were determined by Nanodrop-2000. The cDNA was synthesized according to The cDNA was synthesized from 500 ng RNA according to the instructions of HiScriptIIl 1st Strand cDNA Synthesis Kit (Novozymes, Nanjing, China), with oligo (dT) primers in a final volume of 20 μL,and stored in the refrigerator at – 20 °C.
To test the specificity of each pair of primers, we first performed RT-PCR in a 50 μL system using a PCR instrument (Eppendorf AG, Hamburg, Germany), including cDNA 4 μL synthetic CDNA (100 ng), 2xPCR Mix 25 μL(Tiangen), 2 μL each of forward and reverse primer (10 μM), and ddH2O 17 μL. The amplification procedure consisted of an initial denaturation of 95 °C for 4 min, followed by denaturation at 95 °C for 30 s; annealing at 60 °C for 30 s; extension at 72 °C for 30 s in 30 cycles. The final extension at 72 °C for 5 min. The PCR products were detected by 2.0% agarose gel electrophoresis. They were recovered by agarose gel DNA recovery kit (Tiangen), and sequenced to verify the primers’ specificity. The RT-qPCR was performed using SYBR Green PCR Master Mix System (Novozymes) on an Applied Biosystems 7500/7500 Fast Real-Time PCR System (ABI, Foster City, CA, USA). In the reaction system of 20 μL: qPCR Master Mix (SYBR Green I) 10 μL, cDNA 1 μL (150 ng), forward primers and reverse primers 0.4 μL (10 μM) each, ddH2O 8.2 μL. Reaction conditions: initial denaturation.
95 °C for 3 min; denaturation at 95 °C for 10 s; annealing at 60 °C for 30 s; extension at 72 °C for 20 s in 40 cycles. The final extension at 72 °C for 5 min. Three biological and technical replicates for the sample of each treatment and tissue were used in the experiments.
Stability assessment of endogenous reference gene expression
The stability of the endogenous reference gene was evaluated using GeNorm46, NormFinder45, BestKeeper47, and RefFinder24 software for the nine endogenous reference genes. For GeNorm and NormFinder software analysis65, the raw Ct values need to be converted into relative quantities according to the formula 2−∆Ct (∆Ct = each corresponding Ct value—lowest Ct value). GeNorm was used to filter out the more stable endogenous reference genes by calculating the M value of stability of each gene. The criterion was that the smaller the M value, the better the stability of the gene. This program also evaluates the comparing pairwise variation (Vn/Vn+1) to determine the optimal number of genes required to normalize RT-qPCR data accurately. The Vn/Vn+1 threshold is generally considered 0.15, and if Vn/Vn+1 is less than 0.15, then the optimal number of endogenous reference genes is “n”65. The NormFinder program uses a model-based variance to calculate the stability value45, taking into account intra- and inter-group variations of the samples. A lowest value indicates the high expression stability of this gene35. For the BestKeeper program, the raw Ct values are used to calculate the coefficient of variation and standard deviation27. The principle of determination is that the greater the correlation coefficient, the smaller the standard deviation (SD) and the coefficient of variation (CV), and the better the stability of the endogenous reference gene. RefFinder program integrates the results of GeNorm, NormFinder, BestKeeper, generating a comprehensive endogenous reference gene stability ranking.
Validtion of endogenous reference gene stability
It has been shown that POD and PXG3 respond to abiotic stresses. To verify the reliability of the endogenous reference genes, POD and PXG3 primers (Table1) were designed and further analyzed according to the RT-qPCR reaction system. The most stable and least stable endogenous reference genes were identified by RefFinder software, and the relative expression profiles of POD and PXG3 in Chlorella sp. TLD 6B under abiotic stress were analyzed. Relative expression data were calculated for three biological replicates. Relative gene expression levels were calculated using the 2−△△Ct method66.
Statistical analysis
Statistical significance analysis of POD and PXG3 was performed using IBM SPSS statistics 19.0 (https://www.ibm.com/products/spss-statistics) based on one-way ANOVA and further evaluated using Duncan’s multiple comparison (P < 0.05)24.
Data availability
All data relevant to the study are included in the article or uploaded as supplementary file. In addition, the datasets used and/or analyzed during the current study are available from the corresponding author on reasonable request.
References
Roy, A., Gogoi, N., Yasmin, F. & Farooq, M. The use of algae for environmental sustainability: Trends and future prospects. Environ. Sci. Pollut. Res. Int. 29, 40373–40383 (2022).
Li, Y. et al. Brown algae carbohydrates: Structures, pharmaceutical properties, and research challenges. Mar. Drugs 19(11), 620. https://doi.org/10.3390/md19110620 (2021).
Li, S., Show, P. L., Ngo, H. H. & Ho, S. H. Algae-mediated antibiotic wastewater treatment: A critical review. Environ. Sci. Ecotechnol. 9, 100145 (2022).
Johansen, J. R. Cryptogamic crusts of semiarid and arid lands of North America. J. Phycol. 29, 140–147 (1993).
Büdel, B. et al. Southern African biological soil crusts are ubiquitous and highly diverse in drylands, being restricted by rainfall frequency. Microb. Ecol. 57, 229–247 (2009).
Flechtner, et al. Algal composition of microbiotic crusts from the Central Desert of Baja California, Mexico. Great Basin Natural. 58, 295–311 (1998).
Hallenbeck, P. C. Desert Crusts (Modern Topics in the Phototrophic Prokaryotes, 2017).
Donner, A., Ryšánek, D., Mikhailyuk, T. & Karsten, U. Ecophysiological traits of various genotypes of a green key alga in biological soil crusts from the semi-arid Colorado Plateau, USA. J. Appl. Phycol. 29, 2911–2923 (2017).
Haim, T. et al. A newly isolated Chlorella sp. from desert sand crusts exhibits a unique resistance to excess light intensity. Fems Microbiol. Ecol. 86, 373–380 (2013).
Chen, L., Deng, S., Philippis, R. D., Tian, W. & Wang, J. UV-B resistance as a criterion for the selection of desert microalgae to be utilized for inoculating desert soils. J. Appl. Phycol. 25, 1009–1015 (2013).
Gray, D. W., Lewis, L. A. & Cardon, Z. G. Photosynthetic recovery following desiccation of desert green algae (Chlorophyta) and their aquatic relatives. Plant Cell Environ. 30, 1240–1255 (2007).
Shetty, P., Gitau, M. M. & Maróti, G. Salinity stress responses and adaptation mechanisms in eukaryotic green microalgae. Cells 8, 1657 (2019).
Wang, D. et al. Phylogenetic analyses on the biological crusts of several algae in the Taklimakan Desert. Acta Pratacul. Sin. 23, 97–103 (2014).
Jianfeng, M. Y. W. W. L. H. Y. G. W. H. G. Effects of PEG6000 on growth and lipid accumulation of desert chlorella. China Oils Fats 41, 58–61 (2016).
Li, H., Tan, J., Mu, Y. & Gao, J. Lipid accumulation of Chlorella sp. TLD6B from the Taklimakan desert under salt stress. PeerJ 9, e11525 (2021).
Gachon, C., Mingam, A. & Charrier, B. Real-time PCR: What relevance to plant studies?. J. Exp. Bot. 55, 1445–1454 (2004).
Bustin, S. A. Quantification of mRNA using real-time reverse transcription PCR (RT-PCR): Trends and problems. J. Mol. Endocrinol. 29, 23–39 (2002).
Bustin, S. A., Benes, V., Nolan, T. & Pfaffl, M. W. Quantitative real-time RT-PCR–a perspective. J. Mol. Endocrinol. 34, 597–601 (2005).
Huggett, J., Dheda, K., Bustin, S. & Zumla, A. Real-time RT-PCR normalisation; strategies and considerations. Genes Immun. 6, 279–284 (2005).
Die, J. V. & Román, B. RNA quality assessment: A view from plant qPCR studies. J. Exp. Bot. 63, 6069–6077 (2012).
Jensen, E. C. Real-time reverse transcription polymerase chain reaction to measure mRNA: Use, limitations, and presentation of results. Anat. Rec. 295, 1–3 (2011).
Brunner, A. M., Yakovlev, I. A. & Strauss, S. H. Validating internal controls for quantitative plant gene expression studies. BMC Plant Biol. 4, 14 (2004).
Udvardi, M. K., Czechowski, T. & Scheible, W. R. Eleven golden rules of quantitative RT-PCR. Plant Cell 20, 1736–1737 (2008).
Jin, Y., Liu, F., Huang, W., Sun, Q. & Huang, X. Identification of reliable reference genes for qRT-PCR in the ephemeral plant Arabidopsis pumila based on full-length transcriptome data. Sci. Rep. 9, 8408 (2019).
Mao, M. et al. Validation of reference genes for quantitative real-time PCR normalization in Ananas comosus var. bracteatus during chimeric leaf development and response to hormone stimuli. Front. Genet. 12, 716137 (2021).
Zhang, K. et al. Selection and validation of reference genes for target gene analysis with quantitative real-time PCR in the leaves and roots of Carex rigescens under abiotic stress. Ecotoxicol. Environ. Saf. 168, 127–137 (2019).
Yao, J. et al. Reference gene selection for qPCR analysis in Schima superba under abiotic stress. Genes (Basel) 13(10), 1887 (2022).
Lian, C. et al. Validation of suitable reference genes by various algorithms for gene expression analysis in Isodon rubescens under different abiotic stresses. Sci. Rep. 12, 19599 (2022).
Zong, J. et al. Reference gene selection for quantitative RT-PCR in Miscanthus sacchariflorus under abiotic stress conditions. Mol. Biol. Rep. 49, 907–915 (2022).
Wang, M., Ren, T., Marowa, P., Du, H. & Xu, Z. Identification and selection of reference genes for gene expression analysis by quantitative real-time PCR in Suaeda glauca’s response to salinity. Nat. Publ. Group 11, 8569 (2021).
Zhang, K. et al. Selection and validation of reference genes for quantitative gene expression normalization in Taxus spp. Sci. Rep. 10, 22205 (2020).
Li, L., Li, N., Fang, H., Qi, X. & Zhou, Y. Selection and validation of reference genes for normalisation of gene expression in Glehnia littoralis. Sci. Rep. 10, 7374 (2020).
Kowalczyk, N., Rousvoal, S., Herve, C., Boyen, C. & Collen, J. RT-qPCR normalization genes in the red alga Chondrus crispus. PLoS ONE 9, e86574 (2014).
Le Bail, A. et al. Normalisation genes for expression analyses in the brown alga model Ectocarpus siliculosus. BMC Mol. Biol. 9, 75 (2008).
Linardic, M. & Braybrook, S. A. Identification and selection of optimal reference genes for qPCR-based gene expression analysis in Fucus distichus under various abiotic stresses. PLoS ONE 16, e0233249 (2021).
Ji, N., Li, L., Lin, L. & Lin, S. Screening for suitable reference genes for quantitative real-time PCR in Heterosigma akashiwo (Raphidophyceae). PLoS ONE 10, e0132183 (2015).
Rosic, N. N., Pernice, M. & Hoegh-Guldberg, R. L. Validation of housekeeping genes for gene expression studies in symbiodinium exposed to thermal and light stress. Mar. Biotechnol. 13, 355–365 (2011).
Torres, S., Lama, C., Mantecon, L., Flemetakis, E. & Infante, C. Selection and validation of reference genes for quantitative real-time PCR in the green microalgae Tetraselmis chui. PLoS ONE 16, e0245495 (2021).
Hong, S. M., Bahn, S. C., Lyu, A., Jung, H. S. & Ahn, J. H. Identification and testing of superior reference genes for a starting pool of transcript normalization in arabidopsis. Plant Cell Physiol. 51, 1694–1706 (2010).
Jain, M., Nijhawan, A., Tyagi, A. K. & Khurana, J. P. Validation of housekeeping genes as internal control for studying gene expression in rice by quantitative real-time PCR. Biochem. Biophys. Res. Commun. 345, 646–651 (2006).
Xu, Z. et al. Reference gene selection for quantitative real-time PCR of mycelia from Lentinula edodes under high-temperature stress. Biomed. Res. Int. 2018, 1670328 (2018).
de Almeida, M. R. et al. Reference gene selection for quantitative reverse transcription-polymerase chain reaction normalization during in vitro adventitious rooting in Eucalyptus globulus Labill. BMC Mol. Biol. 11, 73 (2010).
Wan, D. et al. Selection of reference genes for qRT-PCR analysis of gene expression in Stipa grandis during environmental stresses. PLoS ONE 12, e0169465 (2017).
Ma, L., Wu, J., Qi, W., Coulter, J. A. & Sun, W. Screening and verification of reference genes for analysis of gene expression in winter rapeseed (Brassica rapa L.) under abiotic stress. PLoS ONE 15, e0236577 (2020).
Andersen, C. L., Jensen, J. L. & Ørntoft, T. F. Normalization of real time quantitative reverse transcription PCR data a model based variance estimation approach. Cancer Res. 64, 5245–5250 (2004).
Vandesompele, J. et al. Accurate normalization of real-time quantitative RT-PCR data by geometric averaging of multiple internal control genes. Genome Biol. 3, research0034 (2002).
Pfaffl, M. W. A new mathematical model for relative quantification in real-time RT–PCR. Nucleic Acids Res. 29, e45 (2001).
Xie, F., Xiao, P., Chen, D., Xu, L. & Zhang, B. miRDeepFinder: A miRNA analysis tool for deep sequencing of plant small RNAs. Plant Mol. Biol. 80, 75–84 (2012).
Niu, K., Shi, Y. & Ma, H. Selection of candidate reference genes for gene expression analysis in Kentucky bluegrass (Poa pratensis L.) under abiotic stress. Front. Plant Sci. 8, 193 (2017).
Yang, Z., Chen, Y., Hu, B., Tan, Z. & Huang, B. Identification and validation of reference genes for quantification of target gene expression with quantitative real-time PCR for tall fescue under four abiotic stresses. PLoS ONE 10, e0119569 (2015).
Silveira, E. D., Alves-Ferreira, M., Guimarães, L. A., Silva, F. R. D. & Carneiro, V. T. D. C. Selection of reference genes for quantitative real-time PCR expression studies in the apomictic and sexual grass Brachiaria brizantha. BMC Plant Biol. 9, 84 (2009).
Chen, Y. et al. Selection and validation of reference genes for target gene analysis with quantitative RT-PCR in leaves and roots of bermudagrass under four different abiotic stresses. Physiol. Plant. 155, 138–148 (2015).
Kundu, A., Patel, A. & Pal, A. Defining reference genes for qPCR normalization to study biotic and abiotic stress responses in Vigna mungo. Plant Cell Rep. 32, 1647–1658 (2013).
Niu, X., Qi, J., Chen, M., Zhang, G. & Su, J. Reference genes selection for transcript normalization in kenaf (Hibiscus cannabinus L.) under salinity and drought stress. PeerJ 3, e1347 (2015).
Maldonado-Taipe, N., Patirange, D., Schmckel, S. M., Jung, C. & Emrani, N. Validation of suitable genes for normalization of diurnal gene expression studies in Chenopodium quinoa. PLoS ONE 16, e0233821 (2021).
Araújo, J. C. M. S. M. P., Brito, M. d. S., Souza, U. R., Viana, J. d. O. F. & Mazzafera, P. Validation of reference genes from Eucalyptus spp. under different stress conditions. BMC Res Notes. 5, 634 (2012).
Liu, Q., Wei, C., Zhang, M. F. & Jia, G. X. Evaluation of putative reference genes for quantitative real-time PCR normalization in Lilium regale during development and under stress. PeerJ 4, e1837 (2016).
Sudhakar Reddy, P. et al. Evaluation of sorghum [Sorghum bicolor (L.)] reference genes in various tissues and under abiotic stress conditions for quantitative real-time PCR data normalization. Front. Plant Sci. 7, 529 (2016).
Zhao, X. et al. Reference gene selection for quantitative real-time PCR of mycelia from Lentinula edodes under high-temperature stress. Biomed. Res. Int. 2018, 1670328 (2018).
Oliveira, S. R. L. D. et al. Validation of novel reference genes for reverse transcription quantitative real-time PCR in drought-stressed sugarcane. Sci. World J. 2014, 357052 (2014).
Xiao, X. et al. Validation of suitable reference genes for gene expression analysis in the halophyte Salicornia europaea by real-time quantitative PCR. Front. Plant Sci. 5, 788 (2014).
Jun, T. et al. Proteomic analysis of desert chlorella under drought stress. Biotechnol. Bull. 34, 207–216 (2018).
Wang, H. L. et al. Identification and validation of reference genes for Populus euphratica gene expression analysis during abiotic stresses by quantitative real-time PCR. Physiol. Plant. 152, 529–545 (2014).
Yang, L. et al. Full-length transcriptome sequences of ephemeral plant Arabidopsis pumila provides insight into gene expression dynamics during continuous salt stress. BMC Genom. 19, 717 (2018).
Zhao, J. et al. Selection and validation of reference genes for qRT-PCR Gene expression analysis in Kengyilia melanthera. Genes (Basel) 13, 1445–1457 (2022).
Livak, K. J. & Schmittgen, T. D. Analysis of relative gene expression data using real-time quantitative PCR and the 2(-Delta Delta C(T)) Method. Methods 25, 402–408 (2001).
Acknowledgements
This project is supported by the grants from the National Natural Science Foundation of China (31460276, 31960077). The funders had no role in study design, data collection and analysis, preparation of the manuscript, or decision to publish.
Author information
Authors and Affiliations
Contributions
J.G. and Y.Z. conceived the experiments; Y.Z. and F.M. conducted the experiments, F.C., K.H. and K.Z. analysed the results; J.G. and Y.Z. wrote the manuscript. All authors reviewed the manuscript.
Corresponding authors
Ethics declarations
Competing interests
The authors declare no competing interests.
Additional information
Publisher's note
Springer Nature remains neutral with regard to jurisdictional claims in published maps and institutional affiliations.
Supplementary Information
Rights and permissions
Open Access This article is licensed under a Creative Commons Attribution 4.0 International License, which permits use, sharing, adaptation, distribution and reproduction in any medium or format, as long as you give appropriate credit to the original author(s) and the source, provide a link to the Creative Commons licence, and indicate if changes were made. The images or other third party material in this article are included in the article's Creative Commons licence, unless indicated otherwise in a credit line to the material. If material is not included in the article's Creative Commons licence and your intended use is not permitted by statutory regulation or exceeds the permitted use, you will need to obtain permission directly from the copyright holder. To view a copy of this licence, visit http://creativecommons.org/licenses/by/4.0/.
About this article

Cite this article
Zhou, Y., Meng, F., Han, K. et al. Screening and validating of endogenous reference genes in Chlorella sp. TLD 6B under abiotic stress. Sci Rep 13, 1555 (2023). https://doi.org/10.1038/s41598-023-28311-x
Received:
Accepted:
Published:
DOI: https://doi.org/10.1038/s41598-023-28311-x
Comments
By submitting a comment you agree to abide by our Terms and Community Guidelines. If you find something abusive or that does not comply with our terms or guidelines please flag it as inappropriate.
