Abstract
Host immune dysregulation involves in the initiation and development of osteosarcoma (OS). However, the exact role of immune cells in OS remains unknown. We aimed to distinguish the molecular subtypes and establish a prognostic model in OS patients based on immunocyte infiltration. The gene expression profile and corresponding clinical feature of OS patients were obtained from TARGET and GSE21257 datasets. MCP-counter and univariate Cox regression analyses were applied to identify immune cell infiltration-related molecular subgroups. Functional enrichment analysis and immunocyte infiltration analysis were performed between two subgroups. Furthermore, Cox regression and LASSO analyses were performed to establish the prognostic model for the prediction of prognosis and metastasis in OS patients. The subgroup with low infiltration of monocytic lineage (ML) was related to bad prognosis in OS patients. 435 DEGs were screened between the two subgroups. Functional enrichment analysis revealed these DEGs were involved in immune- and inflammation-related pathways. Three important genes (including TERT, CCDC26, and IL2RA) were identified to establish the prognostic model. The risk model had good prognostic performance for the prediction of metastasis and overall survival in OS patients. A novel stratification system was established based on ML-related signature. The risk model could predict the metastasis and prognosis in OS patients. Our findings offered a novel sight for the prognosis and development of OS.
Introduction
Human osteosarcoma (OS) is an aggressive malignant tumor of bone that occurs mainly in adolescents and young adults1. Recent research shows that 60% of OS patients are young, and it is the leading cause of death in this group2. OS occurs primarily around the growth plates of bones3. The majority of OS patients have metastases to the lungs. Although the progress of clinical therapy in recent years has greatly benefited OS patients, and the 5-year survival rate of patients has significantly improved. However, patients with recurrent or metastatic disease often have a poor prognosis4,5,6. In addition, less than 20% of patients with OS treated with surgery alone survived7. Therefore, identifying novel markers that can predict treatment sensitivity and clinical outcomes in OS patients is imperative to effectively improve the survival rate of OS patients.
Immune cell infiltration involves in the bone homeostasis8. In addition to skeletal stromal cells, the complex skeletal microenvironment, including bone marrow immune cells, can promote or prevent the progression of bone disease9. Host immune dysregulation is related to initiation and progression of OS. T lymphocytes, monocytes, and macrophages are the main subsets of the immune microenvironment of OS10,11. Osteosarcoma cells establish an immune microenvironment conducive to tumor metastasis, drug resistance, and growth by controlling the differentiation and recruitment of immune-infiltrating cells12. In addition, T cell exhaustion contributes to the development and progression of OS13. Immunotherapy is a promising treatment for human malignancies that can improve our understanding of the immune response in OS patients. In recent years, the development of immune-related biomarkers has contributed to a significant increase in the number of patients benefiting from immunotherapy14. Some researchers have identified immune-associated biomarkers and prognostic signature for OS patients15,16. Low immune score is closely related to poor prognosis in OS patients17. Therefore, it is crucial to systematically assess the immunocyte infiltration and determine the function and distribution of immune cells to improve the efficacy of immunotherapy in patients with OS.
We aimed to screen the potential immune cell infiltration-related genes as markers related to risk stratification in OS. We performed the univariate Cox regression analysis to screen prognosis-associated immune cell. Differentially expressed genes (DEGs) were analyzed between the immune cell infiltration-related molecular subtypes. Then, a series of bioinformatics analysis methods, including enrichment analysis and immunocyte infiltration were performed to explore the potential molecular mechanisms involved. Finally, a risk model was established based on immunocyte infiltration-associated genes for the prediction OS prognosis.
Methods
Data collection and preprocessing
We downloaded the transcriptome data and corresponding clinical information of 88 OS samples from the TARGET database (https://ocg.cancer.gov/programs/target) as the discover cohort. The transcriptome data of GSE21257 dataset and clinical data of 53 OS samples were collected from the Gene Expression Omnibus (GEO) database (https://www.ncbi.nlm.nih.gov/geo/), and as the validation cohort. Prior to the data analysis, the probe name was converted into the corresponding gene symbols and performed data batch normalization.
Immunocyte infiltration
Microenvironment Cell Populations-counter (MCP-counter) is a robust algorithm, which accomplishes the quantification of the proportion of stromal and immune cells in heterogeneous tissues based on the gene expression profiling18. The level of immunocyte infiltration in OS samples was quantified through the MCP-counter. In addition, the ESTIMATE score, immune score, stromal score and Tumor purity were analyzed through ESTIMATE algorithm19. We used the Kaplan–Meier survival analysis to estimate the association between overall survival and immune cell infiltration level of OS patients. A p value < 0.05 indicates the significant difference.
DEGs and enrichment analysis
First, we calculated the monocytic lineage score for each OS patient using the MCP-counter algorithm. We divided OS patients into low-monocytic lineage (LML) and high-monocytic lineage (HML) subgroups based on the median value of monocytic lineage score. The “limma” package of R was used to screen DEGs between LML and HML subgroups. The adjusted p < 0.05 and ∣logFC∣ ≥ 1 as the cutoff values to identify the DEGs20. The DEGs results were visualized by using the “heatmap” and “ggplot2” packages. The “clusterProfiler” package of R was used to carry out the Gene ontology (GO) and Kyoto Encyclopedia of Genes and Genomes (KEGG) enrichment analyses of DEGs, the results were visualized by using the “ggplot2” package of R, term with a p < 0.05 was indicated statistical difference.
The prognostic model was constructed based on monocytic lineage-related genes
First, we carried out the univariate Cox analysis to identify the survival-associated genes based on the above DEGs, and p < 0.05 as the cutoff value. The least absolute shrinkage and selection operator (LASSO) Cox regression analysis was carried out by using the “survival” and “glmnet” packages. The multivariate Cox regression analysis was performed to screen independent risk factors related to prognosis. The risk score for each patients was calculated based on the following formula: risk score = coefficient of Gene A × expression of gene A + coefficient of Gene N × expression of gene N21. The performance of the prognostic model was assessed through receiver operating characteristic curve and the Kaplan–Meier survival analysis. Based on the results of COX regression analysis, a nomogram was constructed to predict overall survival in OS patients. Nomogram and calibration curve were generated using the “ggplot2” and “survival R” packages.
GeneMANIA database
GeneMANIA (http://genemania.org) is a versatile and intuitive online platform that facilitates the generation of hypotheses pertaining to gene functionality22. To evaluate the potential functions of signature genes, GENEMANIA was utilized to construct a gene interaction network.
Tumor immune single cell hub (TISCH)
The TISCH database (http://tisch.comp-genomics.org/gallery/) is an extensive compilation of single-cell RNA sequencing data. It offers valuable insights into the diverse nature of the tumor microenvironment. Leveraging this database, we embarked on an exploration of the heterogeneity within the tumor microenvironment across a range of cell types.
Statistical analysis
Univariate and multivariate Cox regression analyses were applied to screen prognostic biomarkers. The comparison between two groups was achieved by Mann–Whitney test. The overall survival between the two groups was analyzed by using Kaplan–Meier analysis. The statistical analysis was performed by using R software (v3.5.3), a p < 0.05 represented statistical difference.
Results
ML was related to the prognosis of OS patients
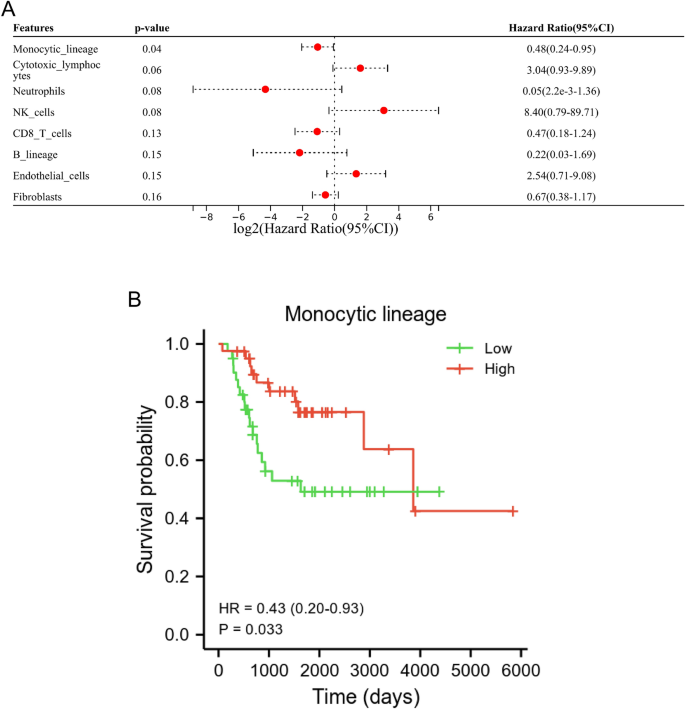
In our study, the MCP-counter algorithm and univariate and univariate Cox regression analysis were performed to identify the survival-associated immune cells. The results of univariate Cox regression analysis showed that ML was a survival-related immune cell for OS patients (Fig. 1A). In addition, Kaplan–Meier analysis indicated that low level of ML was related to a poorer prognosis for OS patients (p = 0.033, Fig. 1B).
Analysis of DEGs and potential signaling pathways between two subgroups
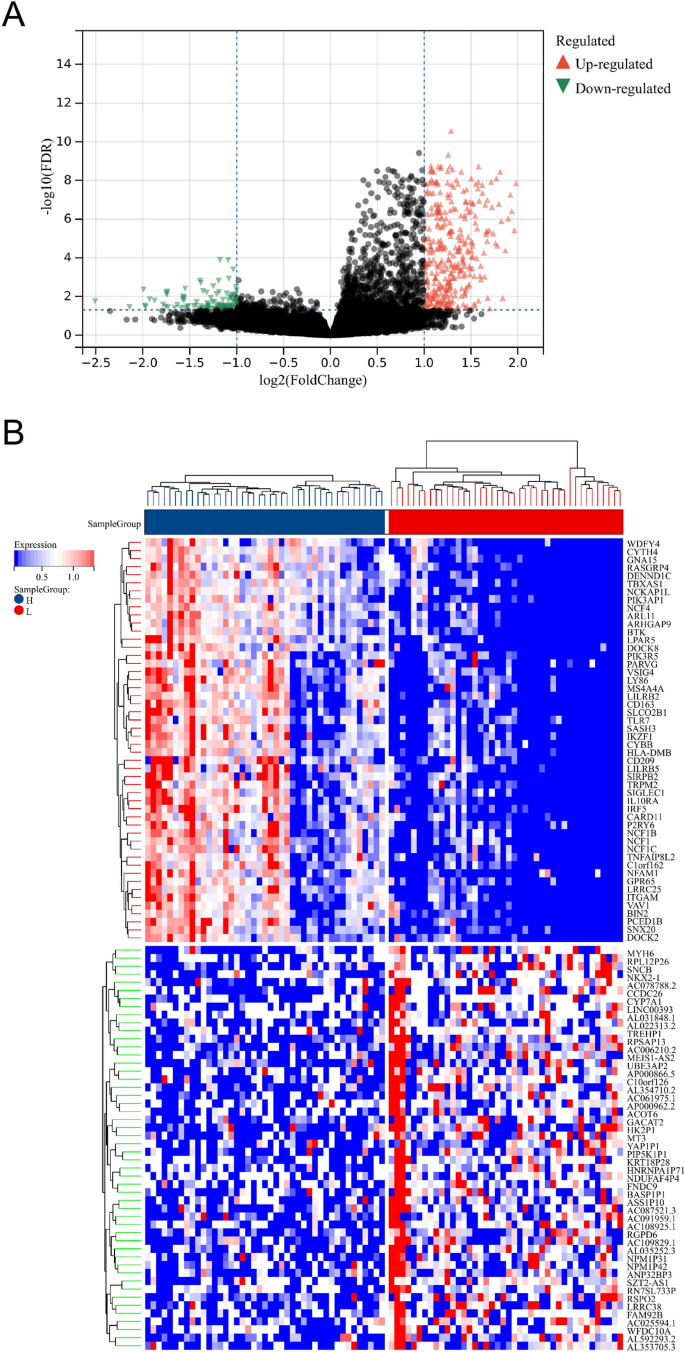
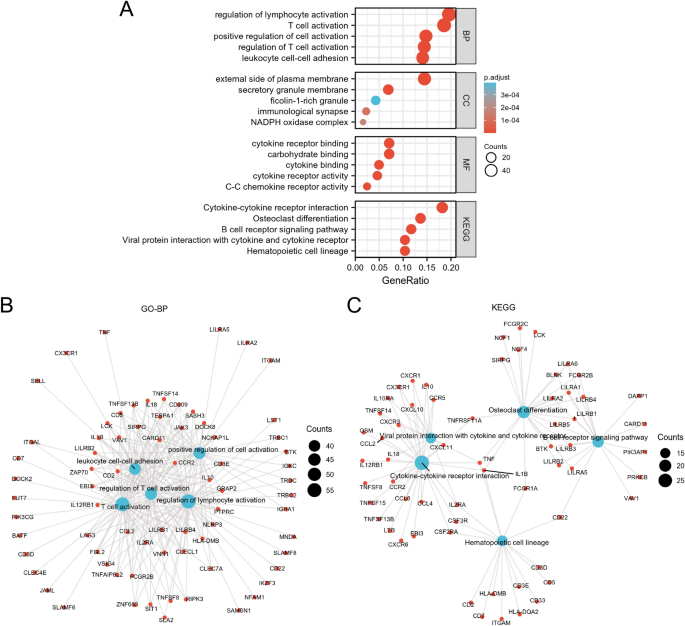
A total of 435 DEGs were identified following DEGs analysis (Fig. 2A,B). Compared with the LML, 101 genes were downregulated and 334 genes were upregulated in the HML group. In the term of biological processes (BP), these DEGs were involved in regulation of lymphocyte activation, T cell activation, positive regulation of cell activation, regulation of T cell activation, leukocyte cell–cell adhesion, etc. In the term of cellular components (CC), DEGs were involved in external side of plasma membrane, secretory granule membrane, ficolin-1-rich granule, immunological synapse, NADPH oxidase complex, etc. In the term of molecular functions (MF), DEGs were significantly enriched in carbohydrate binding, cytokine receptor binding, cytokine binding, cytokine receptor activity, C–C chemokine receptor activity, etc. In the term of KEGG, DEGs were mainly enriched in hematopoietic cell lineage, osteoclast differentiation, cytokine-cytokine receptor interaction, B cell receptor signaling pathway, etc. (Fig. 3).
Identification of DEGs between the LML and HML subgroups. (A) The volcano plot depicted the DEGs between the LML and HML subgroups. The green dots represented down-regulated genes, whereas the red dots represented up-regulated genes. (B) Heatmap plot depicted the top 50 DEGs between the LML and HML subgroups.
Immunocyte infiltration
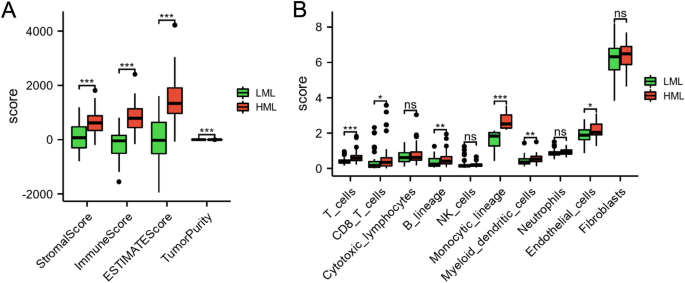
We analyzed the immune status between the LML and HML subgroups to decipher the immune microenvironment in OS. As shown in Fig. 4A, compared to the HML group, the stromal score, immune score, and ESTIMATE score were decreased in the LML group (p < 0.01), while tumor purity was significantly increased in the LML group (p < 0.01). Compared with the HML group, the endothelial cells, myeloid dendritic cells, monocytic lineage, B lineage, T cells, and CD8 T cells levels were significantly decreased in the LML group (p < 0.05) (Fig. 4B).
The landscape of immunocyte infiltration levels in the two subgroups. (A) The comparisons of stromal score, immune score, ESTIMATE score, and tumor purity between the LML and HML subgroups. (B) The comparisons of immunocyte infiltration levels between the LML and HML subgroups. *p < 0.05, **p < 0.01, and ***p < 0.001.
Construction and assessment of the prognostic risk model
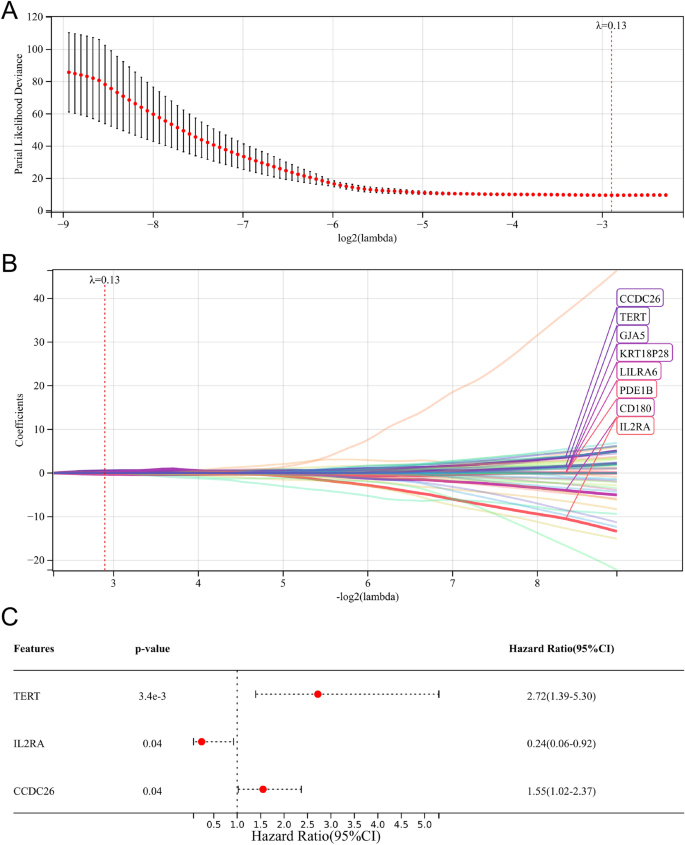
Following the univariate Cox regression analysis, we screened 122 overall survival-related genes (Table S1). Subsequently, the LASSO Cox regression analysis identified eight genes (CCDC26, TERT, GJA5, KRT18P28, LILRA6, PDE1B, CD180, and IL2RA) for the multivariate Cox regression analysis (Fig. 5A,B). Finally, three important overall survival-related genes (TERT, IL2RA, and CCDC26) were screened and used to establish the prognostic model (Fig. 5C).
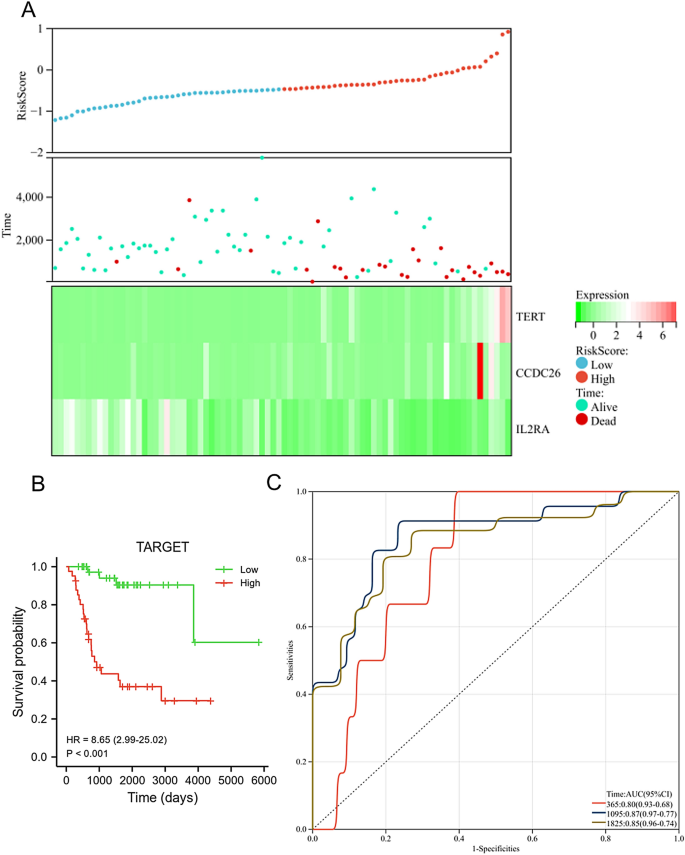
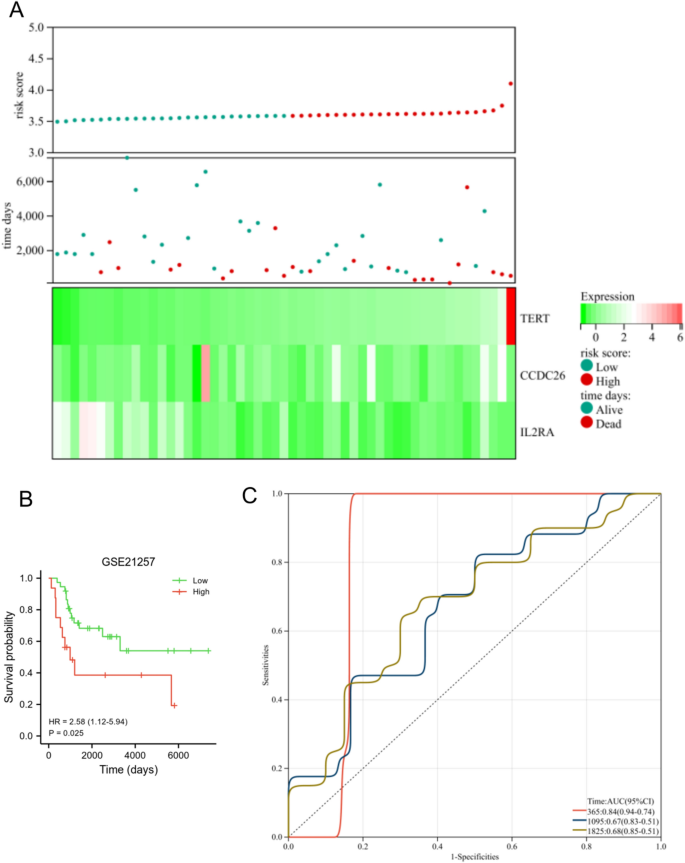
In the TARGET dataset, the expression level of TERT and CCDC26 was down-regulated in the low risk group, while the expression of IL2RA was up-regulated in the low risk group. Moreover, high risk group had a lower proportion of alive (Fig. 6A). OS patients in the low risk group exhibited longer overall survival than those in the high risk group (Fig. 6B, p < 0.001). The AUC for this prognostic model was 0.8 at 1-year, 0.87 at 3-year, and 0.85 at 5-year (Fig. 6C), this result indicated that the prognostic model had good diagnostic performance for OS patients. We also used the GSE21257 dataset to verify the diagnosis and prognostic features of the risk model. As shown in Fig. 7A, the expression level of TERT and CCDC26 was down-regulated in the low-risk group, while the expression of IL2RA was up-regulated in the low-risk group. Moreover, high risk group had a lower proportion of alive. OS patients in the low-risk group exhibited longer overall survival than those in the high-risk group (p = 0.025) (Fig. 7B). The AUC for this prognostic model was 0.84 at 1-year, 0.67 at 3-year, and 0.68 at 5-year (Fig. 7C). These results were consistent with the results in the TARGET dataset.
Assessment of prognostic model in the TARGET database. (A) The expression level of TERT, CCDC26 and IL2RA (below), survival status (middle), and the distribution of risk scores between low and high-risk groups (upper). (B) Survival analysis of showed the difference between low and high-risk groups. (C) Time-dependent ROC curve analyses of the prognostic model.
Validation of prognostic model in the GSE21257 dataset. (A) The expression level of TERT, CCDC26 and IL2RA (below), survival status (middle), and the distribution of risk scores between low and high-risk groups (upper). (B) Survival analysis of showed the difference between low and high-risk groups. (C) Time-dependent ROC curve analyses of the prognostic model.
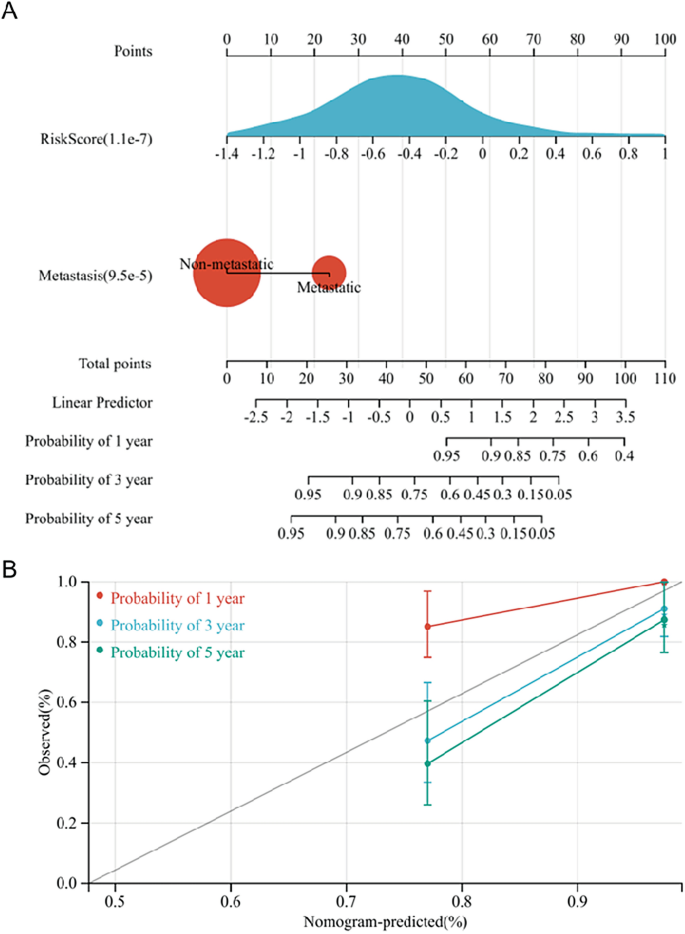
In addition, a nomogram was established to further aid in predicting the prognosis of OS patients (Fig. 8A). The prediction results of the nomogram were highly consistent with the observation of OS patients based on the nomogram calibration curve (Fig. 8B).
Interaction analysis of prognostic genes
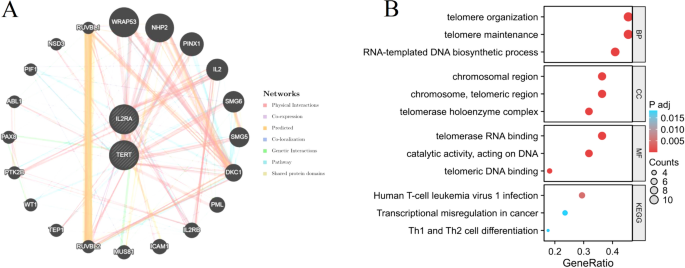
By employing the GeneMANIA database, we successfully built a protein interaction network for the signature genes (TERT and IL2RA). Through this analysis, we discovered a total of 20 genes that engage in interactions with the signature genes (Fig. 9A). Functional enrichment analysis was conducted on these 22 genes. The outcomes obtained from the enrichment analysis demonstrated that these genes are predominantly linked to the telomere organization, telomere maintenance, human T cell leukemia virus 1 infection, Th1 and Th2 cell differentiation, etc. (Fig. 9B).
Association between risk model-related genes and tumor microenvironment (TME)
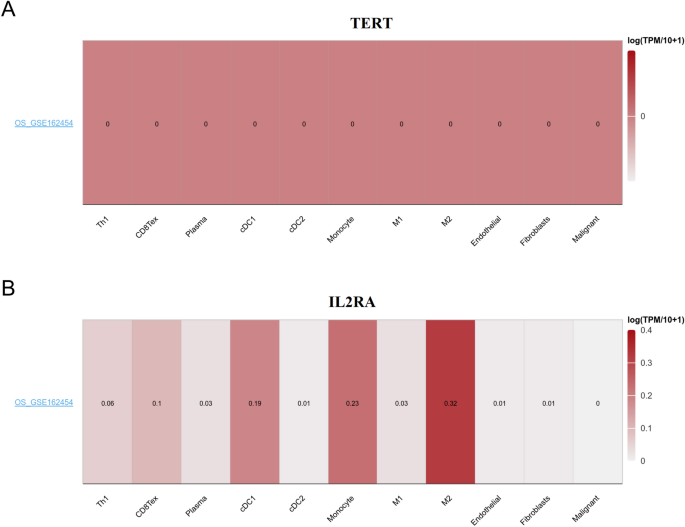
We conducted an analysis on the expression levels of the TERT and IL2RA genes in tumor microenvironment-associated cells within OS, using the TISCH database. Our findings demonstrated that IL2RA displayed a higher level of infiltration in cDC1, monocyte, and M2 cells (Fig. 10).
The prognostic model has the ability to distinguish metastatic OS patients
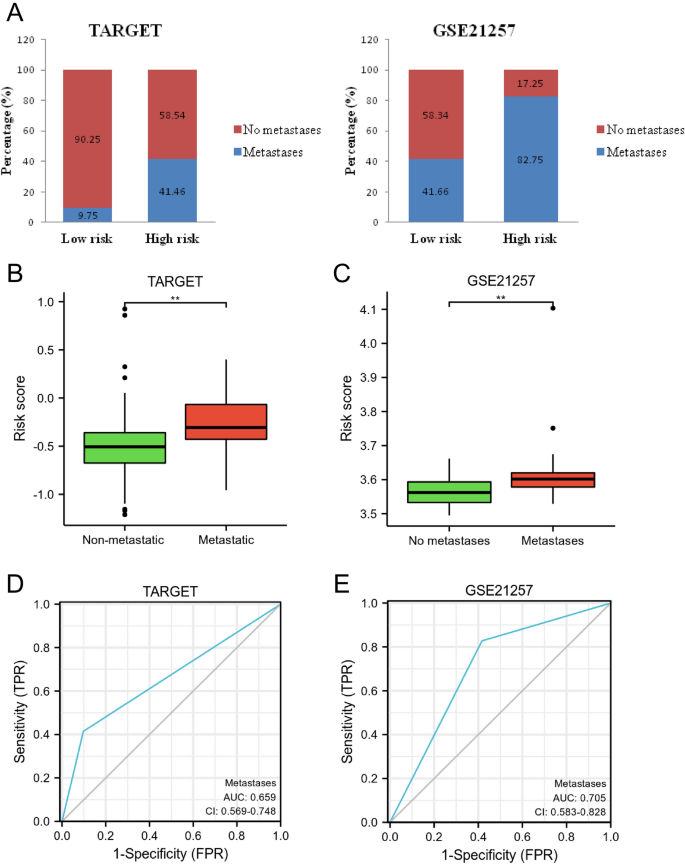
As shown Fig. 11A, compared to the high-risk group (TARGET, 58.54% and GSE21257, 17.25%), more no metastasis cases (TARGET, 90.25% and GSE21257, 58.34%) were observed in the low-risk group. Moreover, compared with the metastatic group, the risk score was lower in the non-metastatic group (p < 0.01, Fig. 11B,C). Furthermore, the results of ROC analysis showed that the diagnostic performance of the prognostic model for the prediction of metastasis were 0.659 and 0.705 in TARGET and GSE21257, respectively (Fig. 11D,E). These findings showed that the risk model could predict metastasis in OS patients.
Assessment of the ability of prognostic model to predict metastasis in patients with OS. (A) The comparisons of metastasis and no metastasis cases in the low and high-risk groups. (B) The comparisons of risk score in the metastatic and non-metastatic groups. (C) ROC analysis for the diagnostic performance in the prediction of OS metastasis.
Discussion
OS is a highly malignant cancer, and 80% of OS patients still died from metastasis5,23,24. Therefore, its treatment still faces great challenges. Recent studies have demonstrated that several diagnostic, management, and prognostic analyzes associated with immune cell populations provided clinical guidance for improving treatment outcomes in patients with OS25,26,27. Furthermore, a bioinformatics-based research method, including sample collection, genomic analysis, and identification of regulatory networks, can promote a better deciphering and understanding of the underlying pathological mechanisms of action of the immune system in OS28,29,30. Thus, identifying genes related to immune cell infiltration is important for improving the treatment and diagnosis of OS patients.
In this study, we conducted a comprehensive analysis to investigate the potential impact of ML-related genes as prognostic indicators. We have successfully uncovered novel insights into the survival-related ML-related genes of OS. Throughout this research, we have made several groundbreaking discoveries. Firstly, we have successfully pinpointed 435 DEGs between ML-related subgroups, with a majority of them being involved in immune- and inflammation-related pathways. Secondly, we have successfully devised a ML-related signature and established a scoring system that exhibits a significant correlation with the overall survival of OS patients. This unique signature has proven to be highly effective in accurately stratifying patients into low- and high-risk groups, while also providing precise predictions for the overall survival of OS patients with sensitivity and specificity. Our findings in the field of OS are consistent with the existing literature31. Previous study has reported similar patterns of gene expression alterations and identified signature genes classifier in OS patients. Our study further supported the notion that the signature genes play crucial roles in OS development and progression. Furthermore, our enrichment analyses results provided additional insights into the potential mechanisms of these signature genes, highlighting their potential as therapeutic targets in OS treatment.
In our research, the immunocyte infiltration level in OS patients was assessed through the MCP-counter. Our results indicated that a low level of monocytic lineage (ML) was related to a bad prognosis in OS patients. Monocytes are important immune cells and important regulators of cancer initiation and progression32. The monocyte-directed adjuvant therapies had the potential value in the treatment of cancer33,34. A recent study showed that increased peripheral blood monocytes counts were associated a poorer prognosis in pancreatic cancer patients35. Immune cell infiltration involves in OS metastasis, and patrolling monocytes suppressed OS metastasis to lungs of mice36. The results mentioned above suggested that the activation of monocytes might play a role in improving the overall survival rate of OS patients. Nonetheless, additional experiments are needed to validate the accuracy of this conclusion.
Another important finding is that we established a prognostic diagnostic model for OS patients. We identified 435 ML-related genes, and three genes (TERT, CCDC26, and IL2RA) were used to construct the prognostic model. Telomerase (TERT) was a catalytic subunit of telomerase, which involves in tumorigenesis37. TERT gene exerted carcinogenic effect, targeting TERT was an effective therapy in the treatment of non-small cell lung cancer38. TERT could potentially function as a valuable genomic indicator for detecting and forecasting various types of cancer, while also holding promise as a potential target for therapeutic interventions in the case of OS39. In addition, TERT was a potential prognostic biomarker in diagnosis and prognosis of cancer, including breast cancer, thyroid cancer, and bladder cancer40,41,42. Moreover, the suppression of TERT expression decreased osteosarcoma cell metastasis, motility, and proliferation39. At present, the role of Coiled-coil domain containing (CCDC26) in cancer prognosis remains unexplored. CCDC26 knockdown could cause imatinib resistance in gastrointestinal stromal tumor cells through decreasing c-KIT expression43. CCDC26 rs4295627 polymorphism was a risk marker for glioma patients44,45. Interleukin 2 receptor subunit alpha (IL2RA) was increased after stimulation in immune cells, such as regulatory T cells46. Recent studies revealed that IL2RA was closely related to the development and progression of tumorigenesis and the prognosis of cancer patients. IL2RA suppressed differentiation and contributed to stem cell-related properties, implying that it was a potential target in acute myeloid leukemia47. In addition, elevated mRNA expression of IL2RA was an adverse prognostic biomarker in acute myeloid leukemia48. Higher expression of IL2RA was related to the poorer prognosis and higher immune infiltration level in pancreatic ductal adenocarcinoma49,50. IL2RA is a molecule that is relatively recent in its discovery, with only limited studies on its involvement in OS currently available. However, it has been found to play a significant part in the development of tumors. Additional investigations are warranted to thoroughly investigate the extent of its impact on OS. In our study, the prognostic model containing TERT, CCDC26, and IL2RA genes, and it showed good prognostic performance, as well as for the prediction of metastasis in OS patients. Therefore, this prognostic risk model is helpful for the diagnosis and treatment of OS patients.
There were several limitations in this study. The study primarily focused on data mining and data analysis, the results was not validated by external experiments. Further research is needed to validate our findings.
Conclusion
In general, two ML-associated molecular subtypes and a ML-related signature (TERT, CCDC26, and IL2RA) were identified for the establishment of the prognostic model. The low infiltration level of ML was related to a bad prognosis and inactivated immune status in OS patients. Moreover, the ML-related prognostic model could predict prognosis and metastasis in OS patients.
Data availability
Any data not included in the article or supplementary data will be made available upon request to the corresponding author. The data used in our study are available from the GSE21257 dataset (https://www.ncbi.nlm.nih.gov/geo/geo2r/?acc=GSE21257), and TARGET database (https://ocg.cancer.gov/programs/target).
References
Haydon, R. C., Luu, H. H. & He, T. C. Osteosarcoma and osteoblastic differentiation: A new perspective on oncogenesis. Clin. Orthop. Relat. Res. 454, 237–246. https://doi.org/10.1097/BLO.0b013e31802b683c (2007).
Vander Griend, R. A. Osteosarcoma and its variants. Orthop. Clin. North Am. 27, 575–581 (1996).
Tang, N., Song, W. X., Luo, J., Haydon, R. C. & He, T. C. Osteosarcoma development and stem cell differentiation. Clin. Orthop. Relat. Res. 466, 2114–2130. https://doi.org/10.1007/s11999-008-0335-z (2008).
Simpson, S. et al. Comparative review of human and canine osteosarcoma: Morphology, epidemiology, prognosis, treatment and genetics. Acta Vet. Scand. 59, 71. https://doi.org/10.1186/s13028-017-0341-9 (2017).
Meazza, C. & Scanagatta, P. Metastatic osteosarcoma: A challenging multidisciplinary treatment. Expert Rev. Anticancer Ther. 16, 543–556. https://doi.org/10.1586/14737140.2016.1168697 (2016).
Tirtei, E. et al. Survival after second and subsequent recurrences in osteosarcoma: A retrospective multicenter analysis. Tumori 104, 202–206. https://doi.org/10.1177/0300891617753257 (2018).
Bernthal, N. M. et al. Long-term results (> 25 years) of a randomized, prospective clinical trial evaluating chemotherapy in patients with high-grade, operable osteosarcoma. Cancer 118, 5888–5893. https://doi.org/10.1002/cncr.27651 (2012).
Hsu, E. & Pacifici, R. From osteoimmunology to osteomicrobiology: How the microbiota and the immune system regulate bone. Calcif. Tissue Int. 102, 512–521. https://doi.org/10.1007/s00223-017-0321-0 (2018).
Alsamraae, M. & Cook, L. M. Emerging roles for myeloid immune cells in bone metastasis. Cancer Metastasis Rev. 40, 413–425. https://doi.org/10.1007/s10555-021-09965-3 (2021).
Liu, Q., Xu, R., Xu, X., Huang, Y. & Ma, Z. Characteristics and significance of T lymphocyte subsets in peripheral blood of osteosarcoma mice. Transl. Cancer Res. 11, 1503–1509. https://doi.org/10.21037/tcr-22-264 (2022).
Kelleher, F. C. & O’Sullivan, H. Monocytes, macrophages, and osteoclasts in osteosarcoma. J. Adolesc. Young Adult Oncol. 6, 396–405. https://doi.org/10.1089/jayao.2016.0078 (2017).
Heymann, M. F., Lézot, F. & Heymann, D. The contribution of immune infiltrates and the local microenvironment in the pathogenesis of osteosarcoma. Cell. Immunol. 343, 103711. https://doi.org/10.1016/j.cellimm.2017.10.011 (2019).
Sun, C. Y. et al. T cell exhaustion drives osteosarcoma pathogenesis. Ann. Transl. Med. 9, 1447. https://doi.org/10.21037/atm-21-3928 (2021).
Chen, C. et al. Immunotherapy for osteosarcoma: Fundamental mechanism, rationale, and recent breakthroughs. Cancer Lett. 500, 1–10. https://doi.org/10.1016/j.canlet.2020.12.024 (2021).
Xiao, B. et al. Identification and verification of immune-related gene prognostic signature based on ssGSEA for osteosarcoma. Front. Oncol. 10, 607622. https://doi.org/10.3389/fonc.2020.607622 (2020).
Liu, W., Xie, X., Qi, Y. & Wu, J. Exploration of immune-related gene expression in osteosarcoma and association with outcomes. JAMA Netw. Open 4, e2119132. https://doi.org/10.1001/jamanetworkopen.2021.19132 (2021).
Zhang, C. et al. Profiles of immune cell infiltration and immune-related genes in the tumor microenvironment of osteosarcoma. Aging 12, 3486–3501. https://doi.org/10.18632/aging.102824 (2020).
Becht, E. et al. Estimating the population abundance of tissue-infiltrating immune and stromal cell populations using gene expression. Genome Biol. 17, 218. https://doi.org/10.1186/s13059-016-1070-5 (2016).
Luo, J. et al. Comprehensive insights on pivotal prognostic signature involved in clear cell renal cell carcinoma microenvironment using the ESTIMATE algorithm. Cancer Med. 9, 4310–4323. https://doi.org/10.1002/cam4.2983 (2020).
Yin, Y., He, M., Huang, Y. & Xie, X. Transcriptomic analysis identifies CYP27A1 as a diagnostic marker for the prognosis and immunity in lung adenocarcinoma. BMC Immunol. 24, 37. https://doi.org/10.1186/s12865-023-00572-1 (2023).
Wang, H., Wu, X. & Chen, Y. Stromal-immune score-based gene signature: A prognosis stratification tool in gastric cancer. Front. Oncol. 9, 1212. https://doi.org/10.3389/fonc.2019.01212 (2019).
Franz, M. et al. GeneMANIA update 2018. Nucleic Acids Res. 46, W60-w64. https://doi.org/10.1093/nar/gky311 (2018).
Yao, Z. et al. Hedgehog signalling in the tumourigenesis and metastasis of osteosarcoma, and its potential value in the clinical therapy of osteosarcoma. Cell Death Dis. 9, 701. https://doi.org/10.1038/s41419-018-0647-1 (2018).
Rejin, K. et al. Intra-abdominal metastasis in osteosarcoma: Survey and literature review. Pediatric Hematol. Oncol. 28, 609–615. https://doi.org/10.3109/08880018.2011.590959 (2011).
Cascini, C. & Chiodoni, C. The immune landscape of osteosarcoma: Implications for prognosis and treatment response. Cells https://doi.org/10.3390/cells10071668 (2021).
Wu, C. C. & Livingston, J. A. Genomics and the immune landscape of osteosarcoma. Adv. Exp. Med. Biol. 1258, 21–36. https://doi.org/10.1007/978-3-030-43085-6_2 (2020).
Wu, C. C. et al. Immuno-genomic landscape of osteosarcoma. Nat. Commun. 11, 1008. https://doi.org/10.1038/s41467-020-14646-w (2020).
Niu, J. et al. Identification of potential therapeutic targets and immune cell infiltration characteristics in osteosarcoma using bioinformatics strategy. Front. Oncol. 10, 1628. https://doi.org/10.3389/fonc.2020.01628 (2020).
Xiao, K. W. et al. Construction and validation of a macrophage-associated risk model for predicting the prognosis of osteosarcoma. J. Oncol. 2021, 9967954. https://doi.org/10.1155/2021/9967954 (2021).
Liang, J. et al. Bioinformatics analysis of the key genes in osteosarcoma metastasis and immune invasion. Transl. Pediatr. 11, 1656–1670. https://doi.org/10.21037/tp-22-402 (2022).
Liu, F., Xing, L., Zhang, X. & Zhang, X. A four-pseudogene classifier identified by machine learning serves as a novel prognostic marker for survival of osteosarcoma. Genes https://doi.org/10.3390/genes10060414 (2019).
Olingy, C. E., Dinh, H. Q. & Hedrick, C. C. Monocyte heterogeneity and functions in cancer. J. Leukoc. Boil. 106, 309–322. https://doi.org/10.1002/jlb.4ri0818-311r (2019).
Conte, E. Targeting monocytes/macrophages in fibrosis and cancer diseases: Therapeutic approaches. Pharmacol. Therap. 234, 108031. https://doi.org/10.1016/j.pharmthera.2021.108031 (2022).
Patysheva, M. et al. Monocyte programming by cancer therapy. Front. Immunol. 13, 994319. https://doi.org/10.3389/fimmu.2022.994319 (2022).
Chen, S. et al. Peripheral blood monocytes predict clinical prognosis and support tumor invasiveness through NF-κB-dependent upregulation of Snail in pancreatic cancer. Transl. Cancer Res. 10, 4773–4785. https://doi.org/10.21037/tcr-21-980 (2021).
Wang, J., Chen, Y., Chen, L., Duan, Y. & Tang, Y. J. T. N. EGCG modulates PKD1 and ferroptosis to promote recovery in ST rats. Transl. Neurosci. 11, 173–181 (2020).
Dratwa, M., Wysoczańska, B., Łacina, P., Kubik, T. & Bogunia-Kubik, K. TERT-regulation and roles in cancer formation. Front. Immunol. 11, 589929. https://doi.org/10.3389/fimmu.2020.589929 (2020).
Yang, L. et al. Tumorigenic effect of TERT and its potential therapeutic target in NSCLC (review). Oncol. Rep. https://doi.org/10.3892/or.2021.8133 (2021).
Xie, L., Yin, W., Tang, F. & He, M. Pan-cancer analysis of TERT and validation in osteosarcoma cell lines. Biochem. Biophys. Res. Commun. 639, 106–116. https://doi.org/10.1016/j.bbrc.2022.11.068 (2023).
Jin, A., Xu, J. & Wang, Y. The role of TERT promoter mutations in postoperative and preoperative diagnosis and prognosis in thyroid cancer. Medicine 97, e11548. https://doi.org/10.1097/md.0000000000011548 (2018).
Gay-Bellile, M. et al. TERT promoter status and gene copy number gains: Effect on TERT expression and association with prognosis in breast cancer. Oncotarget 8, 77540–77551. https://doi.org/10.18632/oncotarget.20560 (2017).
Wan, S. et al. The role of telomerase reverse transcriptase (TERT) promoter mutations in prognosis in bladder cancer. Bioengineered 12, 1495–1504. https://doi.org/10.1080/21655979.2021.1915725 (2021).
Cao, K. et al. CCDC26 knockdown enhances resistance of gastrointestinal stromal tumor cells to imatinib by interacting with c-KIT. Am. J. Transl. Res. 10, 274–282 (2018).
Cui, T. CCDC26 rs4295627 polymorphism and glioma risk: A meta-analysis. Int. J. Clin. Exp. Med. 8, 3862–3868 (2015).
Wang, X. et al. Association of the CCDC26 rs4295627 polymorphism with the risk of glioma: Evidence from 7,290 cases and 11,630 controls. Mol. Clin. Oncol. 4, 878–882. https://doi.org/10.3892/mco.2016.813 (2016).
Dendrou, C. A. et al. Cell-specific protein phenotypes for the autoimmune locus IL2RA using a genotype-selectable human bioresource. Nat. Genet. 41, 1011–1015. https://doi.org/10.1038/ng.434 (2009).
Nguyen, C. H. et al. IL2RA promotes aggressiveness and stem cell-related properties of acute myeloid leukemia. Cancer Res. 80, 4527–4539. https://doi.org/10.1158/0008-5472.can-20-0531 (2020).
Du, W. et al. High IL2RA mRNA expression is an independent adverse prognostic biomarker in core binding factor and intermediate-risk acute myeloid leukemia. J. Transl. Med. 17, 191. https://doi.org/10.1186/s12967-019-1926-z (2019).
Fan, L. et al. IL2RA is a prognostic indicator and correlated with immune characteristics of pancreatic ductal adenocarcinoma. Medicine 101, e30966. https://doi.org/10.1097/md.0000000000030966 (2022).
Zhang, X. et al. Application of weighted gene co-expression network analysis to identify key modules and hub genes in oral squamous cell carcinoma tumorigenesis. OncoTargets Ther. 11, 6001–6021. https://doi.org/10.2147/ott.s171791 (2018).
Author information
Authors and Affiliations
Contributions
L.B. and C.Y.X. conceived the work and designed the experiments. L.B., C.Y.X. and L.X.Y. executed all experiments. L.B. and W.G.P. wrote the manuscript. All authors read and approved the final manuscript.
Corresponding author
Ethics declarations
Competing interests
The authors declare no competing interests.
Additional information
Publisher's note
Springer Nature remains neutral with regard to jurisdictional claims in published maps and institutional affiliations.
Supplementary Information
Rights and permissions
Open Access This article is licensed under a Creative Commons Attribution 4.0 International License, which permits use, sharing, adaptation, distribution and reproduction in any medium or format, as long as you give appropriate credit to the original author(s) and the source, provide a link to the Creative Commons licence, and indicate if changes were made. The images or other third party material in this article are included in the article's Creative Commons licence, unless indicated otherwise in a credit line to the material. If material is not included in the article's Creative Commons licence and your intended use is not permitted by statutory regulation or exceeds the permitted use, you will need to obtain permission directly from the copyright holder. To view a copy of this licence, visit http://creativecommons.org/licenses/by/4.0/.
About this article
Cite this article
Liu, B., Liu, XY., Wang, GP. et al. The immune cell infiltration-associated molecular subtypes and gene signature predict prognosis for osteosarcoma patients. Sci Rep 14, 5184 (2024). https://doi.org/10.1038/s41598-024-55890-0
Received:
Accepted:
Published:
DOI: https://doi.org/10.1038/s41598-024-55890-0
Comments
By submitting a comment you agree to abide by our Terms and Community Guidelines. If you find something abusive or that does not comply with our terms or guidelines please flag it as inappropriate.


