
Abstract
Single-cell RNA-sequencing (scRNA-seq) allows the characterization of cellular composition and interactions in complex tissues. An essential prerequisite for scRNA-seq is the preparation of high-quality single-cell suspensions. So far, no protocols have been described for preparing such suspensions from the placenta, an essential organ for fetal development and a site of maternal–fetal immune interaction. Here we describe a protocol for the preparation of high-quality single-cell suspensions from human placental tissues—namely, the basal plate, placental villi and chorioamniotic membranes. The protocol outlines the collection of tissues from the placenta, tailored dissociation procedures for each tissue, and the cryopreservation of single-cell suspensions for multiplex sequencing library preparation. The protocol can be performed by a qualified investigator with basic working knowledge of placental structure. Moreover, the single-cell suspensions generated by using this protocol are compatible with droplet-based scRNA-seq technology, such as the 10x Genomics Chromium system. This protocol reliably produces single-cell suspensions from the placental tissues with high yield and viability for scRNA-seq. This protocol takes ~6 h to complete from tissue collection to cryopreservation of single-cell suspensions, and an additional 2 h for thawing of cryopreserved single cells.
Introduction
The placenta serves as the lungs, gut, kidneys and liver of the growing fetus1 and acts to shield the fetus against invading microbes2. Therefore, deciphering the processes that take place in the placenta is essential for improving the understanding of fetal development and the mechanisms of obstetrical syndromes. Investigations of the placenta have largely been limited to histological3 and bulk transcriptomic4 studies. However, the complex cellular interactions taking place in the placenta have challenged the field of maternal–fetal medicine to implement single-cell technologies for the deeper characterization of this essential organ. Compared with bulk transcriptomics, single-cell RNA-sequencing (scRNA-seq) provides unbiased evaluation of tissues as heterogeneous composites of multiple cell types with distinct gene expression profiles, rather than a combined pool of transcripts5. Moreover, the ability to evaluate gene expression on a per-cell basis results in greater sequencing throughput compared with traditional methods that require cell sorting of target cell populations for subsequent transcriptomic analysis6, and in this way, the stochasticity of gene expression across different cell types can be accounted for. Another advantage of droplet-based scRNA-seq methods, such as that described in the current protocol, is the unbiased nature of cell selection that requires no operator input and thus provides the best overview of cellular composition (within the technical limits of the chosen single-cell platform). The large datasets resulting from scRNA-seq allow for a wide range of different analytical pipelines that can be used for purposes as simple as identifying cell types of interest, to complex analyses such as trajectory-based differentiation or cell–cell interactions. Recently, we engaged in deciphering the physiologic and pathologic processes in the human placenta at single-cell resolution7. Using our scRNA-seq data of the placenta, we have contributed to the understanding of the maternal–fetal transmission of the coronavirus SARS-CoV-2 (ref. 8), as well as to the investigation of maternal–fetal immune responses triggered by this virus9. Herein, we describe the protocol to prepare single-cell suspensions from the human placenta that was developed in these studies. This protocol provides a valuable technique for advancing future single-cell-based studies of the maternal–fetal dialogue during normal pregnancy and in the context of obstetrical syndromes.
Development of the protocol
We previously developed a method to obtain immune cells by mechanical and enzymatic digestion of human decidual tissues for downstream flow cytometry applications10. Given the focus on immune cells, this earlier protocol did not result in complete dissociation of the placental tissues and included steps to remove nonimmune cells. Furthermore, owing to the focus on isolating immune cells, the protocol did not consider the heterogeneity of the placental compartments. Therefore, to obtain high-quality single-cell suspensions that include immune and nonimmune cells, it was necessary to take into account the specific characteristics of our target tissues. For this reason, we first sought to optimize the current dissociation protocol independently for the placental tissues (basal plate (BP) and placental villi (PV)) and for the chorioamniotic membranes (CAM)7. Owing to the high collagen content of the CAM, we determined that enzymatic dissociation of this tissue, using Collagenase A (together with mechanical mincing), was optimal for obtaining single-cell suspensions. In contrast, the thicker and more complex tissues of the BP and PV required additional optimization. After testing several enzymatic approaches, such as Collagenase A and Accutase, we found that the proprietary enzymatic cocktail provided in the Umbilical Cord Dissociation Kit from Miltenyi Biotec provided the best dissociation outcomes, as demonstrated by a previous single-cell study of the placenta11. By combining both enzymatic approaches, together with refinement of the digestion times, we settled on the optimal procedures for obtaining high-viability single-cell suspensions from the BP + PV and CAM, which could then be successfully utilized for scRNA-seq applications7.
Comparison with other methods
The protocol herein was developed to allow for the isolation of high-quality single-cell suspensions from the human placental tissues, the BP + PV and CAM. While previous studies, which the current protocol builds upon, performed the digestion and isolation of cells from the BP + PV11,12,13,14,15,16,17,18,19, we are not aware of any established protocols for the digestion of CAM for downstream single-cell applications; thus, the inclusion of this distinct tissue represents a novel aspect of the current protocol that may benefit those researchers who are interested solely in the CAM.
This protocol may offer some advantages over methods previously utilized for isolating cells from the placental tissues, in particular for those researchers interested in comprehensively investigating the placenta, decidua and CAM in parallel. One of the earliest single-cell investigations focused on placental cell types utilized the Miltenyi Biotec Umbilical Cord Dissociation Kit to dissociate this tissue11. When developing the current protocol, we compared the Umbilical Cord Dissociation Kit with other commonly utilized enzymatic methods (e.g., Accutase and Collagenase A) and found that the use of this kit allows for the highest cell yields and viability from the combined BP + PV tissue. Another investigation of the first-trimester decidua and placenta implemented specific multistep digestion protocols for each tissue by using collagenase and trypsin13; in contrast, the single-step digestion of the combined BP + PV using the Umbilical Cord Dissociation Kit may not only improve cell yields but may also be more time efficient. It is also worth mentioning that our protocol was designed for the indiscriminate isolation of cell types present in the BP + PV and CAM tissues (see ‘Anticipated results’), which is an important consideration when performing unbiased high-throughput downstream analyses such as scRNA-seq. A number of previous isolation protocols were developed with the aim of separating specific cell types, such as leukocytes17,18, decidual stromal cells15 or trophoblast subsets14, or were targeted toward a specific compartment (e.g., the decidua16,17,18 or the placenta14,19). Therefore, our protocol may be best suited for researchers interested in the complete cellular landscape of the BP + PV and CAM.
Applications of the method
This protocol is designed to yield high-viability (>80%) single-cell suspensions from freshly collected BP + PV and CAM tissues (Fig. 1), which can be used immediately for downstream applications that require dissociated cells, such as flow cytometry, fluorescence-activated cell sorting, magnetic-activated cell sorting (MACS) and microfluidics-based techniques, including scRNA-seq20, or can be successfully cryopreserved for utilization in batches (i.e., multiplexing). This protocol will be useful for high-throughput single-cell methods that require viable single-cell suspensions and facilitate the application of single-cell technology to study the underexplored tissues of the maternal–fetal interface.

a–c, Graphic representation of the anatomy of the human placenta at term. Representative gross images of the placenta with the maternal side facing up show the cotyledons composed of the BP and PV (b) and, with the fetal side facing up, show the umbilical cord and chorionic plate as well as the rupture site of the CAM (c). d, Tissue biopsies of the BP with PV (BP + PV) are collected by cutting an entire piece of cotyledon and rinsing in 1× PBS before mechanical dissociation. e, Tissue biopsies of the CAM are collected by extending the tissue and exposing the rupture site. Sections of the full-thickness CAM (including amnion, chorion and decidua parietalis) are collected, extending from the rupture site to the base of the placenta. The tissues are rinsed in 1× PBS and blood clots are manually removed before mechanical dissociation. Panel a created using BioRender.com.
Experimental design
Immediate access to human placental samples within minutes of delivery is necessary for optimal protocol outcomes. The collection of BP + PV and CAM tissues should be performed within 30 min of delivery of the placenta; however, this time frame may be extended up to 2 h. We recommend rapid and gentle handling of the tissues at all steps to ensure maximum cell viability. Collected tissues should be maintained in 1× phosphate-buffered saline (PBS) until the dissociation protocol is initiated. In the scenario in which processing of the placenta cannot be initiated immediately after collection, we recommend maintaining the tissues at 4 °C; however, we have observed that RNA quality degrades quickly over time after delivery of the placenta.
Given that the BP + PV and CAM samples are collected at the same time, the procedures for isolating single-cell suspensions from the BP + PV and from the CAM can be performed in parallel by those researchers who are interested in studying both compartments. However, we acknowledge that some researchers may be interested in either the BP + PV or the CAM. For this reason, we describe the isolation procedure separately for each of these tissues and specify the estimated times for each step.
Before initiating the protocol, researchers must consider whether freshly isolated single cells will be immediately used for downstream applications or cryopreserved to be multiplexed at a later date, as cryopreservation necessitates additional steps such as dead cell removal before the use of each sample. We have validated the quality of freshly isolated and cryopreserved single-cell suspensions by immunophenotyping of isolated leukocytes with flow cytometry, as discussed in the Supplementary Information. If cryopreservation will not be performed, Steps 43–59 of the procedure can be skipped.
Depending on the downstream applications, researchers may be interested in determining cell-type-specific transcriptomic changes driven by a specific disease or condition. For such comparative studies, it is important to consider the inclusion of samples from appropriate control patients. Potential covariates may include maternal age, gestational age at the time of delivery, body mass index and the presence of inflammation or infection, each of which should be considered when performing analysis of single-cell data.
While the current protocol was designed and validated for placental tissues obtained during the third trimester, we also tested the dissociation protocol by using freshly collected placental tissues from the second trimester (17–26 weeks of gestation) and observed comparable cell yields and viability8. Therefore, we consider that the current protocol can be utilized for placental tissues from a wide range of gestational ages; however, researchers interested in applying this protocol should undertake additional validation by using samples obtained from the target gestational ages.
An important consideration for any investigation of the maternal–fetal interface is the close proximity of cells of maternal or fetal origin. To understand the relative contribution of maternal and fetal cells to the biological processes taking place in these compartments, it is critical to distinguish their origins. Thus, we have applied available tools to develop a strategy for incorporating maternal and fetal genotypes into our single-cell analysis. This information is obtained by extracting maternal DNA (from peripheral blood mononuclear cells or other available tissues) and fetal DNA (from umbilical cord tissues collected from the placenta at delivery) and performing genotyping. The resulting data are then verified and incorporated into the single-cell analysis for demultiplexing of maternal and fetal transcriptomic data. An example of this approach can be found in our previous investigation9.
Expertise needed to implement the protocol
A qualified researcher experienced in molecular biology can carry out the complete protocol successfully. A basic understanding of the structure and anatomy of the human placental tissues is required to ensure that the correct tissues are collected (Fig. 1a). An automated cell counter is required to determine cell concentrations and viability. The use of this protocol for downstream scRNA-seq applications as described herein requires access to a 10x Genomics Chromium system and corresponding reagents. Researchers interested in adapting this protocol for other single-cell platforms should carry out additional validation.
Limitations
Cryopreservation and thawing will typically reduce the quantity of viable cells. The proportion of viable cells can be restored by dead cell removal with the Dead Cell Removal Kit from Miltenyi Biotec (see Reagents) recommended by 10x Genomics; however, the total cell numbers will be reduced. Therefore, it is important to consider the desired final cell counts for the target applications and thereby ensure that the starting cell counts exceed this number. The 10x Genomics Chromium utilized for scRNA-seq as described herein has inherent limitations of the size of cells that can be encapsulated during droplet formation. The upper limit of cell size tested by 10x Genomics is 30 μm (ref. 21), and the theoretical limit of the microfluidics chamber is 50–60 μm. We have found that myometrial smooth muscle cells above this limit could be encapsulated; however, their representation with the total single-cell dataset was unavoidably affected22. Similarly, syncytiotrophoblast cells are also above the size threshold of the 10x Genomics platform, and alternative single-cell approaches (e.g., single-nucleus RNA sequencing) may be more appropriate for researchers interested in this cell type. Thus, size limitations should be considered when planning single-cell experiments. In addition, as described within this protocol, the cryopreservation procedure will disproportionately affect fragile cell types such as neutrophils, and, as a consequence, their subsequent representation within a single-cell dataset will be impacted. Therefore, depending on the research aims, this aspect should be taken into consideration when determining whether or not to utilize cryopreservation. Another point of consideration is that the CAMs are composed of several layers (chorion, amnion and decidua parietalis); however, for our specific research purposes we have found the processing of the entire chorioamniotic membrane to be the most time- and reagent-efficient method. We consider that the protocol could be adapted by those researchers who are studying the chorionic or amnionic layers separately, but this process has not been performed in our laboratory and requires separate validation. Moreover, the individualized processing of the chorion, amnion and placenta would require the preparation of three single-cell libraries, which represents a substantial cost increase.
Materials
Biological materials
Human subjects and tissue samples. This protocol has been successfully utilized for the preparation of single-cell suspensions from freshly collected BP + PV and CAM. Tissues were obtained from women with a normal pregnancy who delivered at term with or without labor. Women were recruited into research protocols of the Perinatology Research Branch, an intramural program of the Eunice Kennedy Shriver National Institute of Child Health and Human Development, National Institutes of Health, US Department of Health and Human Services, Wayne State University (Detroit, MI, USA) and the Detroit Medical Center (Detroit, MI, USA). The collection and use of human materials for research purposes were approved by the institutional review boards of Wayne State University School of Medicine and the Detroit Medical Center. All participating women provided written informed consent before the collection of tissue samples.
Caution
It is essential that patient consent for the use of placental tissues is obtained before initiating this protocol and that all national and institutional guidelines are followed to obtain appropriate approval for studies that utilize this protocol.
Reagents
Critical
All reagents should be prepared and stored according to the manufacturer’s instructions. The use of alternative reagents from other manufacturers may not guarantee the anticipated results.
-
10× PBS, pH 7.4 (Life Technologies, cat. no. 70011-044)
-
10% (wt/vol) bovine serum albumin (BSA) in 1× PBS (Sigma Aldrich, cat. no. SRE0036-1L)
-
18.2 MΩ·cm Type I ultrapure water (Elga PURELAB Classic system, model no. ULXXXGEM2-US)
-
Ammonium–chloride–potassium (ACK) lysing buffer (Fisher Scientific, cat. no. A1049201)
-
Collagenase A from Clostridium histolyticum, 500 mg (Millipore Sigma, cat. no. 10103586001-500MG)
Caution
This lyophilized product is an aspiration hazard that may cause skin, eye or respiratory irritation; it must be reconstituted in a biological safety cabinet (BSC) and handled in a well-ventilated area, and personnel must wear appropriate personal protective equipment (PPE), including lab coat, gloves and safety goggles.
-
Dead Cell Removal Kit (Miltenyi Biotec, cat. no. 130-090-101)
Caution
Dead Cell Removal MicroBeads are susceptible to bacterial contamination; handle under sterile conditions in a BSC.
-
Dimethyl sulfoxide (DMSO; Fisher Scientific, cat. no. BP231-100)
Caution
DMSO is a hygroscopic and combustible liquid that may penetrate skin; use appropriate PPE and ensure adequate ventilation.
-
Dulbecco’s modified eagle’s medium (DMEM), high glucose (Gibco, cat. no. 11-965-118)
-
Fetal bovine serum (FBS), heat inactivated (Gibco, cat. no. 10082147)
-
Umbilical Cord Dissociation Kit, human (Miltenyi Biotec, cat. no. 130-105-737)
Caution
Enzymes A, B, D and P within the dissociation kit may cause skin, eye or respiratory irritation; ensure adequate ventilation and wear appropriate PPE, including lab coat, gloves and safety goggles.
-
ViaStain AOPI staining solution (Nexcelom, cat. no. CS2-0106-25mL)
Caution
AOPI staining solution may cause skin, eye or respiratory irritation. It is also suspected to cause genetic defects; use appropriate PPE and ensure adequate ventilation.
Critical
Protect from light.
Equipment
Lab equipment
-
Analytical balance (Mettler Toledo, model XA105DU)
-
Benchtop centrifuge (with adapters for 15 and 50 mL centrifuge tubes; Sorvall, model LegendRT)
Critical
Use swing-bucket rotors to ensure adequate cell recovery.
-
BSC (Thermo Scientific, Class II, 1300 Series A2, model 1321)
-
Cellometer cell viability counter (Nexcelom, model Auto 2,000)
-
Cellometer counting chambers (Nexcelom, cat. no. CHT4-SD100-002)
-
Circulating water bath (Fisher Scientific, model Isotemp 3016)
-
Conical centrifuge tubes (Fisher Scientific, cat. nos. 14-432-22 (50 mL) and 14-959-49B (15 mL))
-
Cutting board
-
Cryogenic vials, 2 mL (Corning, cat. no. 430661)
-
Dissecting scissors (Fisherbrand, cat. no. 08-951-20)
-
Forceps (Fisherbrand, cat. no. 10-270)
-
Freezing container rack (Nalgene, ‘Mr. Frosty’, cat. no. C6516F-1)
-
GentleMACS C tubes (Miltenyi Biotec, cat. no. 130-096-334)
-
GentleMACS tissue dissociator (Miltenyi Biotec, cat. no. 130-093-235)
-
Heated shaker (Thermo Fisher Scientific, MaxQ 4450, model 4345)
-
MACS MultiStand (Miltenyi Biotec, cat. no. 130-042-303)
-
MACS SmartStrainers (Miltenyi Biotec, cat. nos. 130-098-458 (30 µm) and 130-110-917 (100 µm))
-
Micropipettes (Rainin, Pipet-Lite LTS, cat. nos. 17014388 (L-10XLS+), 17014392 (L-20XLS+), 17014384 (L-100XLS+), 17014391 (L-200XLS+) and 17014382 (L-1,000XLS+))
-
MS columns (Miltenyi Biotec, cat. no. 130-042-201)
-
OctoMACS magnetic separator (Miltenyi Biotec, cat. no. 130-042-109)
-
Parafilm M laboratory wrapping film (Bemis, cat. no. 13-374-12)
-
Petri dishes, 22.0 × 95.6 mm (Fisher Scientific, cat. no. FB012924)
-
Pipet-Aid XP pipette controller (Drummond Scientific, cat. no. 4-000-101)
-
Pipette tips, narrow orifice (Rainin, RT-LTS, cat. nos. 3038926 (20 µL), 30389240 (200 µL) and 30389213 (1,000 µL))
Critical
Use tips with a narrow orifice to dissociate cell aggregates.
-
Pipette tips, wide orifice (Rainin, RT-LTS, cat. nos. 30389218 (200 µL) and 30389241 (1,000 µL))
Critical
Use tips with a wide orifice for gentler handling of the cells.
-
Preseparation filters, 30 µm (Miltenyi Biotec, cat. no. 130-041-407)
-
Serological pipette (McKesson, 177-1761 (10 mL) and 177-1781 (25 mL))
-
Single-edged razor blades (American Safety Razor Co., cat. no. 94-120-71)
-
Transfer pipet (Thermo Fisher Scientific, cat. no. 13-711-23)
-
Vacuum filter (Corning, 0.22 µm cellulose acetate, cat. no. 430517)
-
Water bath (Fisherbrand, model FSGPD05)
Software for data analysis
-
Cell Ranger version 4.0.0 (10x Genomics)
Reagent setup
Critical
The following reagents should be prepared ahead of time (24 h before obtaining placental tissues) unless otherwise stated. Preparation of the working reagents must be done in a BSC to maintain sterility for long-term storage.
1× PBS
Prepare a 1:10 dilution of 10× PBS stock solution using ultrapure water. Filter-sterilize by using a 0.22 µm vacuum filter system. Store at room temperature (20 °C) for up to 6 months.
0.04% (wt/vol) BSA solution
Dilute 10% (wt/vol) BSA in 1× PBS for a final concentration of 0.04% (wt/vol) BSA. Store at 4 °C for up to 1 week.
1× Binding Buffer
Prepare a 1:20 dilution of 20× Binding Buffer stock solution supplied from the Dead Cell Removal Kit using ultrapure water. Store at 4 °C for up to 1 month.
Collagenase A
Reconstitute lyophilized powder in 1× PBS for a final concentration of 1 mg/mL. Filter-sterilize by using a 0.22 µm vacuum filter system. Prepare aliquots of 25 mL and store at −20 °C for up to 6 months.
Critical
Thaw a previously prepared aliquot of Collagenase A in a water bath at 37 °C before use. Do not perform repeated freezing and thawing of the aliquots, as this may compromise enzymatic activity.
Freezing medium
To prepare a 10 mL solution, add 1 mL of DMSO to 9 mL of FBS for a final concentration of 10% (vol/vol) DMSO in FBS. Store at 4 °C for up to 1 week.
Critical
Protect from light.
Thawing medium
To prepare a 50 mL solution, add 5 mL of FBS to 45 mL of DMEM for a final concentration of 10% (vol/vol) FBS in DMEM.
Critical
Always prepare fresh. Prewarm in water bath at 37 °C before use.
Umbilical Cord Dissociation Kit
Reconstitute enzymes A, B, D and P according to the manufacturer’s instructions. Prepare single-use aliquots and store at −20 °C for up to 6 months.
Critical
Thaw aliquots at room temperature before use. Do not perform repeated freezing and thawing of the aliquots, as this may compromise enzymatic activity.
Procedure
Critical
Preparation of single-cell suspensions from the BP + PV and CAM can be performed in parallel (for the overview of tissue collection, see Fig. 1, and for the processing of tissues for single-cell suspensions, see Fig. 2).

a, Following tissue collection, the BP with PV (BP + PV) and CAM are minced into small pieces and incubated at 37 °C with enzymes. Sequential filtration and centrifugation are performed to remove debris, and ACK lysing buffer is used to eliminate contaminant erythrocytes to obtain single-cell suspensions. b, As part of the first step of quality control, cell viability is measured. After obtaining ≥80% viability, the process can continue with either preparation of libraries from freshly collected tissues, or with cryopreservation in liquid nitrogen by using the slow-freezing method. Single-cell suspensions with ≥80% viability are used for scRNA-seq experiments, and suspensions with <80% viability are rescued by using the Dead Cell Removal Kit. Image for Step 60 in b (right) from ref. 89; other images from BioRender.com.
Critical
This protocol was validated for the specific amounts of tissue described in the procedure below. Therefore, it should be reoptimized if larger or smaller starting tissue amounts are desired. All supplies used to process one tissue type should not be used for another tissue type to prevent cross-contamination.
Critical
The successful preparation of single-cell suspensions is largely dependent on high cell viability. Therefore, Steps 1–59 should be performed by using wide-orifice pipette tips to gently handle the cells, except when narrow-orifice tips are specifically indicated. In addition, when samples are not undergoing active processing, they should be kept on ice to maintain cell viability.
Preparation of single-cell suspension from the BP with PV (BP + PV)
Tissue collection
Timing 30 min
-
1
Place the placenta on the cutting board with the BP (maternal side) facing up (Fig. 1b). Select a cotyledon at least 5 cm away from the umbilical cord insertion point (Fig. 1c). Using forceps and a pair of sharp dissecting scissors, cut a cotyledon ~1 cm deep, which will ensure that both BP and PV are included (Fig. 1d and Extended Data Fig. 1a).
Critical step
For our line of investigation, which is focused on the maternal–fetal interfaces (decidua and intervillous space), we perform randomized sampling of the placenta from the maternal side to obtain two to three biopsies that include BP and the attached underlying placental villous tree. Researchers who are interested in the study of the placental villous tree and/or chorionic plate may choose different sampling sites and/or depth, which should be followed by appropriate standardization of the protocol.
-
2
Rinse the tissue by placing it in a 10 cm Petri dish containing ~15 mL of 1× PBS to remove excess blood. Using an analytical balance, weigh 2–3 g of tissue.
Critical step
If a cotyledon weighs >3 g, remove excess tissue from the PV to ensure adequate cell recovery from the BP.
Pause point
Transfer the tissue into a 50 mL centrifuge tube containing 25 mL of 1× PBS and place on ice for up to 30 min.
Mechanical dissociation and enzymatic digestion
Timing 3.5 h
-
3
After rinsing the tissue, place it in a gentleMACS C Tube containing 4.4 mL Buffer L supplied from the Umbilical Cord Dissociation Kit.
-
4
Using a pair of sharp dissecting scissors, mince the tissue contained in Buffer L into small pieces (~1 mm2).
-
5
Add the following thawed enzymes from the Umbilical Cord Dissociation Kit to the minced tissue: 200 µL Enzyme D, 8 µL of Enzyme B, 20 µL of Enzyme A and 125 µL Enzyme P.
Critical step
Ensure that Enzyme P is added at the end, following the manufacturer’s specifications.
-
6
Tightly close the gentleMACS C Tube and seal the lid with parafilm. Place the sample in a water bath prewarmed to 37 °C to incubate for 3 h. Gently invert the gentleMACS C Tube every 30 min to ensure thorough digestion of the sample.
-
7
After incubation, remove the parafilm and place the gentleMACS C Tube upside down onto the sleeve of the gentleMACS Tissue Dissociator. Select the program h_cord_01. This program runs for 30 s with ~553 total rotations per round.
Critical step
Ensure proper attachment of the gentleMACS C Tube to the tissue dissociator.
-
8
After dissociation, remove the gentleMACS C Tube from the dissociator and fill the tube with 1× PBS to stop the enzymatic reaction.
Cell filtration and erythrocyte lysis
Timing 1.5 h
-
9
Filter the dissociated tissue through a 100 µm MACS SmartStrainer into a 50 mL centrifuge tube.
Critical step
Large pieces of tissue may clog the MACS SmartStrainer. To avoid this, allow the tissue pieces to settle at the bottom of the gentleMACS C Tube before filtering the supernatant. Toward the end of the filtration process, the tissue pieces remaining in the gentleMACS C Tube may be poured onto the MACS SmartStrainer.
-
10
Rinse the gentleMACS C Tube with 1× PBS to recover remaining cells and strain through the same 100 µm MACS SmartStrainer.
-
11
Fill the centrifuge tube with 1× PBS to a final volume of 50 mL.
-
12
Centrifuge at 300g, for 10 min at 20 °C. Next, aspirate the supernatant without disturbing the pellet.
-
13
Gently resuspend the cell pellet with ACK lysing buffer at a 1:5 ratio of cell pellet:ACK lysing buffer (e.g., if the cell pellet is ~0.5 mL, use 2 mL of ACK lysing buffer). Then, incubate the cell suspension at room temperature for 5–10 min (for visual assessment of the erythrocyte lysis process, see Fig. 3). Gentle flicking can be applied every 2 min to prevent settling of the cell suspension during lysis.
Fig. 3: Visual evaluation of erythrocyte lysis. 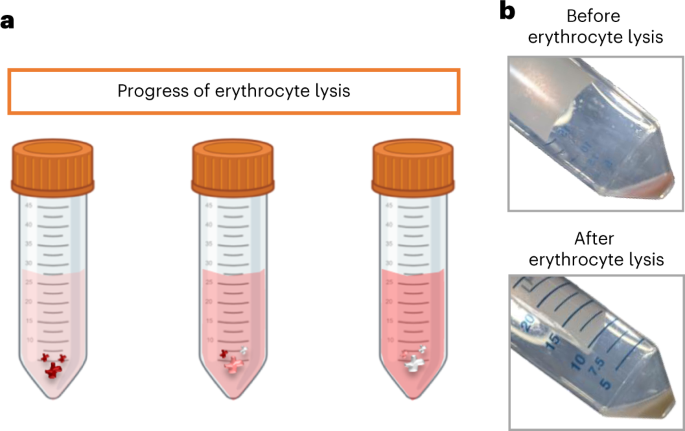
a, Diagram illustrating the visual progress of erythrocyte lysis. b, Representative images of a cell pellet before (top) and after (bottom) successful erythrocyte lysis. Panel a created using BioRender.com.
Critical step
The volume of ACK lysing buffer added and incubation time are highly dependent on the size of the cell pellet. In addition, it is important to carefully observe the lysis of red blood cells to determine when to stop the reaction, which may vary from sample to sample owing to the amount of erythrocytes.
-
14
After incubation, fill the centrifuge tube to a final volume of 50 mL with 0.04% (wt/vol) BSA solution to stop the reaction.
-
15
Centrifuge at 300g and 20 °C for 10 min and aspirate the supernatant without disturbing the pellet.
-
16
Gently resuspend the cell pellet with 1 mL of 0.04% (wt/vol) BSA solution and filter the cell suspension through a 30 µm MACS SmartStrainer into a 15 mL centrifuge tube.
Critical step
For this step, use pipette tips with a narrow orifice to dissociate cell aggregates while maintaining the gentle handling of cells.
-
17
Rinse the 50 mL centrifuge tube three times with 1 mL of 0.04% (wt/vol) BSA solution to recover any remaining cells and transfer each 1 mL through the same 30 µm MACS SmartStrainer into the same centrifuge tube.
-
18
Rinse the MACS SmartStrainer with 1 mL of 0.04% (wt/vol) BSA solution to bring the centrifuge tube to a final volume of 5 mL. Proceed immediately to ‘Cell counting, cryopreservation, thawing and scRNA-seq of BP + PV and CAM’ (Step 40).

Preparation of single-cell suspension from the CAM
Tissue collection
Timing 30 min
-
19
Place the placenta on the cutting board with the BP (maternal side) facing up (Fig. 1b). Extend the CAM surrounding the placenta to reveal the rupture site (Fig. 1e). The rupture site refers to the location where the spontaneous rupture of the CAM occurs during the process of labor, or where the incision is made by the surgeon during cesarean section in the absence of labor.
Critical step
During normal labor, the CAM undergo programmed changes, some of which are limited to the region overlying the cervix (i.e., the rupture zone)23. Therefore, this rupture zone differs from the periplacental or middle zones of the CAM. To provide the most representative overview of all membrane zones and their changes associated with labor, the CAM are collected as a single sample that spans the full length of the tissue from the rupture zone to the placenta.
-
20
Using a single-edged razor blade, cut a section of the CAM starting from the rupture site toward the placenta, carefully avoiding the BP and PV (Fig. 1e and Extended Data Fig. 1b).
-
21
Place the CAM with the maternal side facing up in a Petri dish containing just enough 1× PBS to submerge the tissue. Use forceps to manually remove blood clots from the maternal side.
-
22
Remove the CAM from the Petri dish. To remove excess PBS, pat the tissue with a clean paper towel (avoid letting the tissue dry completely) and weigh out 4–6 g using an analytical balance.
Critical step
Work quickly when weighing and keep the tissue in 1× PBS at all other times to avoid dehydration.
Pause point
Transfer the tissue into a 50 mL centrifuge tube containing 20 mL of 1× PBS and place on ice for up to 30 min.
Mechanical dissociation and enzymatic digestion
Timing 3.5 h
-
23
Place the tissue in a Petri dish with enough 1× PBS to submerge the tissue. Then, use a single-edged razor blade to cut the CAM into small pieces of at least 2 cm2.
-
24
Briefly dry the excess PBS from the resulting pieces of CAM (4–6 g) and transfer the tissue pieces to a 50 mL centrifuge tube containing a thawed 25 mL aliquot of Collagenase A.
-
25
Mince the tissue into smaller pieces (~5 mm2) using a pair of sharp dissecting scissors.
-
26
Tightly screw on the lid of the centrifuge tube and seal with parafilm.
-
27
Place the 50 mL centrifuge tube horizontally on the platform of the heated shaker (prewarmed to 37 °C) and secure it in place with a piece of tape. Incubate at 37 °C shaking at 125 rpm.
-
28
Incubate for 2–3 h while visually inspecting the progress of digestion every 30–45 min (Fig. 4).
Fig. 4: Visual evaluation of enzymatic digestion of the CAM. 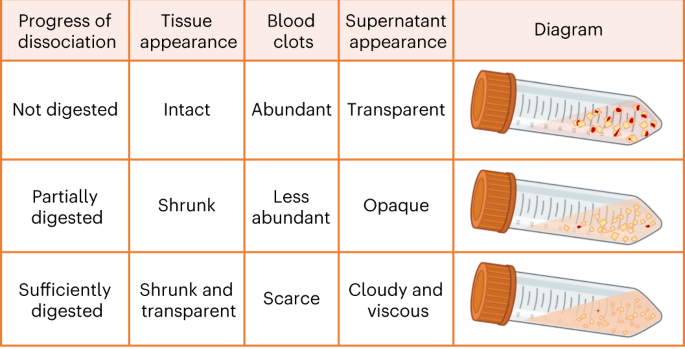
Criteria used to visually evaluate the progress of enzymatic digestion of the CAM on the basis of the tissue appearance, presence of blood clots and viscosity of the supernatant. Figure created using BioRender.com.
Critical step
Visual evaluation of the tissue digestion is important to avoid either overdigestion (tissue itself has almost completely disintegrated into small pieces, together with high viscosity of the supernatant), which can result in low cell viability, or underdigestion, which can result in low cell yield.
-
29
After incubation, fill the centrifuge tube with 1× PBS to a final volume of 50 mL and gently invert the tube three times to stop the enzymatic reaction.

Cell filtration and erythrocyte lysis
Timing 1.5 h
-
30
Prepare two 50 mL centrifuge tubes with a 100 µm MACS SmartStrainer to filter the dissociated tissue.
Critical step
Note that the CAM are rich in collagen, and the dissociated tissue and cell suspension will appear very thick and viscous. For effective cell filtration, pour ~20 mL of sample suspension into each of the 50 mL centrifuge tubes through the 100 µm MACS SmartStrainer. Then, add another ~30 mL of 1× PBS to the initial dissociation tube to decrease the viscosity, mix by inverting and pour again ~20 mL of the contents through the 100 µm MACS SmartStrainer into the two 50 mL centrifuge tubes containing the initial filtrate.
Critical step
Large pieces of tissue may clog the MACS SmartStrainer. To avoid this, allow the tissue pieces to settle at the bottom of the 50 mL centrifuge tube before filtering the supernatant. Transfer the remaining tissue pieces to the MACS SmartStrainer toward the end of the filtration process.
-
31
Centrifuge at 300g for 10 min at 20 °C and decant the supernatant without disturbing the pellet until ~10 mL of supernatant remains.
Critical step
Owing to the viscosity of the sample, decanting is recommended over aspiration.
-
32
Fill the centrifuge tubes with 1× PBS to a final volume of 50 mL and invert the tubes until the cell pellet is fully resuspended.
-
33
Centrifuge at 300g for 10 min at 20 °C and aspirate the supernatant without disturbing the pellet. Then, gently resuspend each pellet using the remaining volume of PBS, and combine the two pellets together in one of the 50 mL centrifuge tubes before proceeding with erythrocyte lysis.
Critical step
The cell pellets will have a loose consistency, thus requiring careful aspiration and resuspension.
-
34
Gently resuspend the cell pellet with ACK lysing buffer at a 1:5 ratio of cell pellet:ACK lysing buffer (e.g., if the cell pellet is 0.5 mL, use 2 mL of ACK lysing buffer). Then, incubate the cell suspension at room temperature for 5–10 min (for visual assessment of the erythrocyte lysis process, see Fig. 3). Gentle flicking can be applied every 2 min to prevent settling of the cell suspension during lysis.
Critical step
The volume of ACK lysing buffer added and incubation time are highly dependent on the size of the cell pellet. In addition, it is important to carefully observe the lysis of red blood cells to determine when to stop the reaction, which may vary from sample to sample owing to the amount of erythrocytes.
-
35
After incubation, fill the centrifuge tubes with 0.04% (wt/vol) BSA to a final volume of 50 mL to stop the reaction.
-
36
Centrifuge at 300g and 20 °C for 10 min and aspirate the supernatant without disturbing the pellet.
-
37
Gently resuspend the cell pellet with 1 mL of 0.04% (wt/vol) BSA in 1× PBS and filter the cell suspension through a 30 µm MACS SmartStrainer into a 15 mL centrifuge tube.
Critical step
In this step, use pipette tips with a narrow orifice to gently dissociate cell aggregates.
-
38
Rinse the 50 mL centrifuge tube three times with 1 mL of 0.04% (wt/vol) BSA solution to recover any remaining cells and transfer each 1 mL through the same 30 µm MACS SmartStrainer into the same centrifuge tube.
-
39
Rinse the MACS SmartStrainer with 0.04% (wt/vol) BSA solution to bring the centrifuge tube to a final volume of 5 mL. Proceed immediately to Step 40.
Cell counting, cryopreservation, thawing and scRNA-seq of BP + PV and CAM
Cryopreservation of single-cell suspension
Timing 30 min
-
40
Determine cell concentrations and viability with the Cellometer automatic cell counter. Mix a 1:1 ratio of single-cell suspension and AOPI staining solution. Load 20 µL of the mixture into a Cellometer counting chamber. Select the ‘Primary lines, cell lines’ assay type for AOPI viability measurement. Adjust the focus by using the brightfield view if necessary.
Critical step
Resuspend the single-cell suspension before mixing with AOPI to achieve accurate measurement of cell concentration.
-
41
Record the measured cell viability along with the concentrations of total, live and dead cells.
Critical step
The optimal cell viability for a good quality scRNA-seq library is ≥80%. Cell viability <80% may be rescued using the Dead Cell Removal Kit (described in Step 59). If dead cell removal is utilized, it should be performed in case and control samples.
-
42
If library preparation will be performed from freshly digested samples, proceed to Step 60; otherwise, centrifuge the single-cell suspension at 300g and 20 °C for 10 min and aspirate the supernatant without disturbing the pellet.
-
43
Calculate the appropriate volume of freezing medium (10% (vol/vol) DMSO in FBS) needed for cryopreservation at a maximum concentration of 2 × 10⁶ live cells/mL for BP + PV and 5 × 10⁶ live cells/mL for CAM.
-
44
Gently resuspend the cell pellet with the appropriate volume of freezing medium and prepare 1 mL aliquots of single-cell suspensions in 2 mL cryogenic vials.
-
45
Immediately place the cryogenic vials in freezing containers containing isopropanol at room temperature and place the rack in a −80 °C freezer for 24 h.
Critical step
Cryopreservation of single cells uses the slow-freezing method to minimize cell damage and maintain viability.
-
46
After 24 h, transfer the cryogenic vials to a liquid nitrogen tank for long-term storage.
Critical step
It is imperative that cryopreserved single-cell suspensions are used as soon as possible for scRNA-seq experiments owing to decreasing cell viability over time.
Pause point
Single-cell suspensions can be stored in liquid nitrogen for up to 2 weeks.
Thawing of cryopreserved single-cell suspensions
Timing 2 h
-
47
Retrieve the single-cell suspensions from liquid nitrogen and place on dry ice.
-
48
Immediately transport the cells to a circulating water bath at 37 °C and thaw for ~2 min until only a small ice crystal remains in the cryogenic vial.
Critical step
A circulating water bath ensures the rapid thawing of cells at a constant temperature.
-
49
Transfer the single-cell suspension from the cryogenic vial to a 50 mL centrifuge tube by gentle pipetting, using a wide-orifice pipette tip.
-
50
Perform a twofold serial dilution of the single-cell suspension to gradually rinse out the freezing medium (Fig. 5). Hold the 50 mL centrifuge tube containing 1 mL of single-cell suspension at a 45° angle. Using a micropipette with a wide-orifice pipette tip, add 1 mL of prewarmed thawing medium dropwise while simultaneously shaking the tube back and forth.
Fig. 5: Twofold serial dilution of cryopreserved single-cell suspensions. 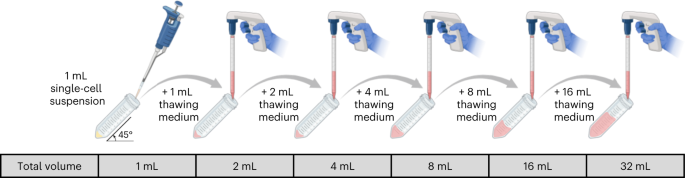
Schematic diagram illustrating the addition of prewarmed thawing medium to cryopreserved single-cell suspensions, where the cell concentration is diluted by a factor of two with each addition. Figure created using BioRender.com.
Critical step
Thawing cryopreserved cells in a stepwise manner minimizes cell damage and maintains viability by ensuring that the integrity of the cells is maintained while slowly replacing the DMSO with culture medium. This step is recommended by 10x Genomics for downstream scRNA-seq (https://www.10xgenomics.com/resources/publications?query=31337793&pmid=31337793).
-
51
Following the above procedure, continue adding thawing medium to the cell suspension until a final volume of 32 mL is achieved.
-
52
Centrifuge at 300g and 20 °C for 5 min, and aspirate the supernatant without disturbing the cell pellet until ~1 mL of supernatant remains.
-
53
Using a micropipette with a wide-orifice pipette tip, gently resuspend the cell pellet.
-
54
Repeat Steps 50–51 once.
-
55
Centrifuge at 300g and 20 °C for 5 min and aspirate the supernatant without disturbing the pellet.
-
56
Gently resuspend the cell pellet with the appropriate volume of thawing medium and filter the cell suspension through a 30 µm preseparation filter into a 15 mL centrifuge tube. Rinse the 50 mL centrifuge tube with thawing medium to recover any remaining cells and strain through the same 30 µm preseparation filter into the same centrifuge tube.
Critical step
The volume of thawing medium added is dependent on the size of the pellet. Ultimately, 10x Genomics recommends an optimal final concentration of 700–1,200 total cells/µL.
-
57
Determine cell concentrations and viability with the Cellometer automatic cell counter. Mix a 1:1 ratio of single-cell suspension and AOPI staining solution. Load 20 µL of the mixture into a Cellometer counting chamber. Select the ‘Primary lines, cell lines’ assay type for AOPI viability measurement. Adjust the focus by using the brightfield view if necessary (Fig. 6).
Fig. 6: Assessment of the quality of single-cell suspensions before and after dead cell removal. 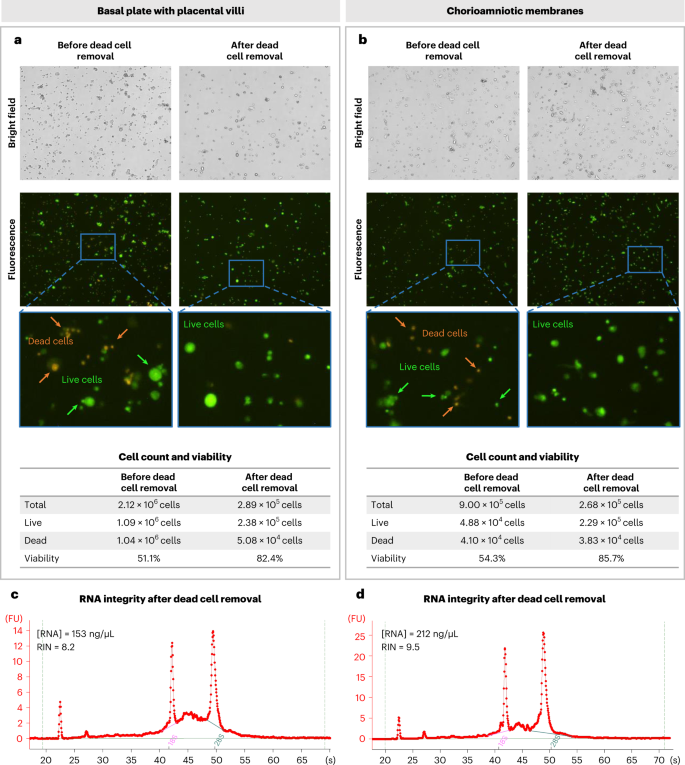
a,b, Assessment of representative thawed single-cell suspensions from the BP with PV (BP + PV) (a) and CAM (b) before and after by using the Dead Cell Removal Kit. Brightfield (top) and fluorescence (middle) images (with digital zoom) obtained from the Cellometer automatic cell counter as well as the quantification of cell count and viability (bottom) are shown. Dead cells are stained with orange and live cells are stained with green. Magnification 4×. c,d, Bioanalyzer electrophoretic traces of RNA isolated from representative good-quality single-cell suspensions following dead cell removal show the RNA concentration and RNA integrity number (RIN) from BP + PV (c) and CAM (d).
Critical step
Resuspend the single-cell suspension before mixing with AOPI to achieve accurate measurement of cell concentration.
-
58
Record the measured cell viability along with the concentrations of total, live and dead cells.
Critical step
The optimal cell viability for a good quality scRNA-seq library is ≥80%. Cell viability <80% may be rescued using the Dead Cell Removal Kit (described below). If dead cell removal will be applied to cases, the same procedure should be applied to controls.
-
59
If cell viability is <80%, eliminate dead cells using the Dead Cell Removal Kit following the manufacturer’s instructions.
Critical step
During the incubation of the cells at room temperature for 15 min, resuspend the cell pellet by gently flicking the tube every 5 min to increase the efficiency of magnetic labeling.


10x Genomics library preparation, sequencing and analysis
Timing variable
-
60
Follow the 10x Genomics protocol for Next GEM Single Cell 3′ Gene Expression v3.1 (CG000204 Rev D), and use cell suspensions with ≥80% viability for the generation of complementary (c)DNA and the preparation of scRNA-seq libraries. Sequencing of the libraries prepared in our laboratory is performed on the Illumina NextSeq 500 in the Genomics Services Center of the Center for Molecular Medicine and Genetics (Wayne State University School of Medicine, Detroit, MI, USA). Alternative sequencers recommended by 10x Genomics are the MiSeq, HiSeq 2500, HiSeq 3000/4000 and NovaSeq. The Illumina 75 Cycle Sequencing Kit is used with 58 cycles for R2, 26 for R1 and 8 for I1.
-
61
Follow the instructions provided in Box 1 for data analysis for downstream scRNA-seq applications.
Troubleshooting
Troubleshooting information can be found in Table 1
Timing
The times listed below are estimates of the amount of time an experienced researcher takes to complete the entire procedure based on concurrently processing one sample (2–3 g) of BP + PV and one sample (4–6 g) of CAM. Researchers attempting this protocol for the first time may take longer to complete each step.
-
Steps 1–2; 19–22, tissue collection: 30 min
-
Steps 3–8; 23–29, mechanical dissociation and enzymatic digestion: 3.5 h
-
Steps 9–18; 30–39, cell filtration and erythrocyte lysis: 1.5 h
-
Steps 40–46, cell counting, cryopreservation of single-cell suspensions: 30 min
-
Steps 47–59, thawing of cryopreserved single-cell suspensions: 2 h
-
Steps 60–61, 10x Genomics library preparation, sequencing and analysis: variable
Anticipated results
This protocol describes a reproducible method to isolate immune and nonimmune cells from human placentas (BP + PV and CAM). We successfully obtained single-cell suspensions from the BP + PV (average of 1 × 10⁷ cells with over 83% viability) and CAM (average of 6 × 10⁶ cells with over 80% viability) collected after a term or preterm delivery to perform cryopreservation. For the cryopreservation process, we typically freeze vials of 2 × 10⁶ cells (>80% viability) and can recover an average of 3.7 × 10⁵ (>80% viability) cells per vial after dead cell removal, for ~25% cell recovery postcryopreservation. Here, we consider two primary factors as indicators of successful single-cell isolation: (i) high cell viability and (ii) nonaggregated (i.e., singlet) cells. It is ideal to use single cells from freshly collected samples for scRNA-seq; yet owing to the efficiency and cost-effectiveness of multiplexing single-cell libraries, cryopreservation of single-cell suspensions for future applications is more advantageous. A downside of cryopreservation is diminished cell viability upon thawing; however, the removal of dead cells is successfully utilized to restore the proportion of viable cells in each sample of BP + PV (Fig. 6a) and of CAM (Fig. 6b) before scRNA-seq. As a readout of the quality of the isolated cells, we isolated total RNA from an aliquot of the single-cell suspensions after dead cell removal and obtained an RNA integrity number of >8, indicative of intact RNA24, from the BP + PV and CAM (Fig. 6c,d).
The preparation of single-cell suspensions from the placental tissues is not directly informative of the complex nature of this organ; however, when coupled with high-throughput sequencing techniques such as scRNA-seq, a wealth of information about cellular composition, gene expression profiles and cell–cell interactions can be obtained that provides deep insight into complex tissues such as those forming the maternal–fetal interface. We typically utilize single-cell suspensions derived from the BP + PV and CAM for scRNA-seq with the Single Cell 3′ Gene Expression Kit from the 10x Genomics Platform. During this process, several quality control metrics are evaluated. The first takes place after the formation of cDNA. Representative cDNA traces from a BP + PV sample that meets 10x Genomics standards (> 80% viability) and from a sample that does not (<80% viability) are shown in Fig. 7a. The expected size of cDNA fragments is between 400 bp and 9,000 bp, as observed in the high-viability sample (Fig. 7a, left); however, in the low-viability sample, no traces are observed within this range (Fig. 7a, right). After library preparation, a trace of the resulting library is also obtained, with high-quality and low-quality traces shown in Fig. 7b. Similarly, a peak corresponding to the expected size of the library fragments (300 bp to 1 kb) is observed in the high-viability sample (Fig. 7b, left) but is only minimally present in the low-viability sample (Fig. 7b, right). Last, after sequencing, the Cell Ranger pipeline from 10x Genomics is used to obtain a rank plot showing the distribution of 10× Genomics barcodes that are inferred to be associated with cells, as well as a summary of parameters for the sequenced library (https://www.10xgenomics.com/) (Fig. 7c,d). An important parameter to monitor is the fraction of reads per cell, which should ideally be above 90% if the cells are viable. In our experience, cells from the CAM are more sensitive and therefore more likely to have low viability; therefore, the same quality control metrics must be evaluated differently for each sample type. Representative cDNA traces, post-library traces and Cell Ranger rank plots/summaries from CAM samples that meet 10x Genomics standards and those with low viability are shown in Fig. 8.

a,b, Quality control assessment during library preparation shows Bioanalyzer electrophoretic traces of cDNA (a) and the resulting library (b) from representative high-quality (left) and low-quality (right) scRNA-seq libraries. c, 10x Genomics Barcode Rank Plots show the distribution of 10× Genomics Barcodes that are inferred to be associated with cells. Highlighted in blue lines are cell-associated 10× Genomics Barcodes (x-axis) determined by increased counts of UMIs (y-axis), while gray lines represent background-associated 10× Genomics barcodes. d, Summary of 10× Genomics Cell Ranger output from representative high-quality (left) and low-quality (right) scRNA-seq libraries shows key quality metrics detailing the fraction of reads in cells and the alignment quality of sequencing reads to the reference transcriptome.

a,b, Quality control assessment during library preparation shows Bioanalyzer electrophoretic traces of cDNA (a) and post-library preparations (b) from representative high-quality (left) and low-quality (right) scRNA-seq libraries. c, 10x Genomics Barcode Rank Plots show the distribution of 10x Genomics Barcodes that are inferred to be associated with cells. Highlighted in blue lines are cell-associated 10x Genomics Barcodes (x axis) determined by increased counts of UMIs (y axis), while gray lines represent background-associated 10x Genomics barcodes. d, Summary of 10x Genomics Cell Ranger output from representative high-quality (left) and low-quality (right) scRNA-seq libraries shows key quality metrics detailing the fraction of reads in cells and the alignment quality of sequencing reads to the reference transcriptome.
Postsequencing data analysis is used to identify cell types on the basis of their similarities to reference datasets. The cell identities and expression profiles are confirmed by determining the top differentially expressed genes in each cell type and performing functional enrichment analysis. Automated cell labeling methods such as SingleR25 and those implemented in Seurat26 can also be used.
Single-cell suspensions of the placental tissues include immune and nonimmune cell types7. To validate the quality of single-cell suspensions before initiating scRNA-seq experiments, immunophenotyping was performed using flow cytometry in freshly prepared and cryopreserved single-cell suspensions from the BP + PV and the CAM (Supplementary Information). We validated the presence of multiple immune and nonimmune cell populations in single-cell suspensions of the BP + PV (Fig. 9 and Extended Data Fig. 2) and CAM (Fig. 10 and Extended Data Fig. 3). As observed, neutrophils are depleted after cryopreservation; therefore, this caveat should be considered when establishing the research question and/or study design. Representative uniform manifold approximation and projection (UMAP) plots derived from the final scRNA-seq analysis of cryopreserved tissues indicate that this protocol allows for the identification of immune and non-immune cell clusters as well as the expression of top differentially expressed genes to be used to assign cell type identities (Fig. 11a,b). Consistent with the flow cytometry results, neutrophil populations were absent from the single-cell analysis after cryopreservation. Therefore, whether the investigators decide to perform single-cell analysis from freshly collected or cryopreserved cell suspensions should be considered before starting this protocol. Our protocol should also be compatible with similar droplet-based scRNA-seq technologies and other data analysis pipelines that are commonly used in single-cell transcriptomics.

a,b, Representative t-distributed stochastic neighbor embedding (t-SNE) plots show the immune cell populations present in freshly prepared single-cell suspensions (n = 1) (a) and after thawing of cryopreserved single-cell suspensions (n = 1) (b) from the BP with PV. NK cell, natural killer cell.

a,b, Representative t-SNE plots showing the immune cell populations present in freshly prepared single-cell suspensions (n = 1) (a) and after thawing of cryopreserved single-cell suspensions (n = 1) (b) from the chorioamniotic membranes. NK cell, natural killer cell.

a,b, Representative UMAP plots showing immune and nonimmune cell clusters derived from the BP with PV (n = 12) (a) and chorioamniotic membranes (n = 12) (b) generated from scRNA-seq experiments. LED, lymphoid endothelial decidual cell; NK cell, natural killer cell. Representative UMAP created using data from ref. 9. UMAP, uniform manifold approximation and projection.
Data availability
The genotyping and scRNA-seq data9 reported in this study were deposited in the National Institutes of Health dbGAP repository (phs001886.v3.p1).
References
Burton, G. J. & Jauniaux, E. What is the placenta. Am. J. Obstet. Gynecol. 213, S6 e1 S6–S8 (2015).
Ander, S. E., Diamond, M. S. & Coyne, C. B. Immune responses at the maternal–fetal interface. Sci. Immunol. 4, eaat6114 (2019).
Redline, R. W. The clinical implications of placental diagnoses. Semin. Perinatol. 39, 2–8 (2015).
Motomura, K. et al. RNA sequencing reveals distinct immune responses in the chorioamniotic membranes of women with preterm labor and microbial or sterile intra-amniotic inflammation. Infect. Immun. 89, e00819–e00820 (2021).
Kulkarni, A., Anderson, A. G., Merullo, D. P. & Konopka, G. Beyond bulk: a review of single cell transcriptomics methodologies and applications. Curr. Opin. Biotechnol. 58, 129–136 (2019).
Haque, A., Engel, J., Teichmann, S. A. & Lonnberg, T. A practical guide to single-cell RNA-sequencing for biomedical research and clinical applications. Genome Med. 9, 75 (2017).
Pique-Regi, R. et al. Single cell transcriptional signatures of the human placenta in term and preterm parturition. eLife 8, e52004 (2019).
Pique-Regi, R. et al. Does the human placenta express the canonical cell entry mediators for SARS-CoV-2. eLife 9, e58716 (2020).
Garcia-Flores, V. et al. Maternal–fetal immune responses in pregnant women infected with SARS-CoV-2. Nat. Commun. 13, 320 (2022).
Xu, Y., Plazyo, O., Romero, R., Hassan, S. S. & Gomez-Lopez, N. Isolation of leukocytes from the human maternal–fetal interface. J. Vis. Exp. https://doi.org/10.3791/52863 (2015).
Tsang, J. C. H. et al. Integrative single-cell and cell-free plasma RNA transcriptomics elucidates placental cellular dynamics. Proc. Natl Acad. Sci. USA 114, E7786–E7795 (2017).
Pavličev, M. et al. Single-cell transcriptomics of the human placenta: inferring the cell communication network of the maternal–fetal interface. Genome Res. 27, 349–361 (2017).
Vento-Tormo, R. et al. Single-cell reconstruction of the early maternal–fetal interface in humans. Nature 563, 347–353 (2018).
Liu, Y. et al. Single-cell RNA-seq reveals the diversity of trophoblast subtypes and patterns of differentiation in the human placenta. Cell Res. 28, 819–832 (2018).
Huang, J. et al. Single-cell transcriptomics analysis showing functional heterogeneity in decidual stromal cells during labor. J. Investig. Med. 69, 851–856 (2020).
Du, L. et al. Single-cell transcriptome analysis reveals defective decidua stromal niche attributes to recurrent spontaneous abortion. Cell Prolif. 54, e13125 (2021).
Wang, F. et al. Single-cell immune landscape of human recurrent miscarriage. Genomics Proteom. Bioinforma. 19, 208–222 (2021).
Chen, P. et al. The immune atlas of human deciduas with unexplained recurrent pregnancy loss. Front. Immunol. 12, 689019 (2021).
Zhang, T. et al. Dissecting human trophoblast cell transcriptional heterogeneity in preeclampsia using single-cell RNA sequencing. Mol. Genet. Genom. Med. 9, e1730 (2021).
Zeb, Q., Wang, C., Shafiq, S. & Liu, L. in Single-Cell Omics (eds. Barh, D. & Azevedo, V.) 101–135 (Academic Press, 2019).
10x Genomics. What is the range of compatible cell sizes? https://kb.10xgenomics.com/hc/en-us/articles/218170543-What-is-the-range-of-compatible-cell-sizes- (2022).
Pique-Regi, R. et al. A single-cell atlas of the myometrium in human parturition. JCI Insight 7, e153921 (2022).
Gomez-Lopez, N. et al. Specific inflammatory microenvironments in the zones of the fetal membranes at term delivery. Am. J. Obstet. Gynecol. 205, 235.e215–224 (2011).
Schroeder, A. et al. The RIN: an RNA integrity number for assigning integrity values to RNA measurements. BMC Mol. Biol. 7, 3 (2006).
Aran, D. et al. Reference-based analysis of lung single-cell sequencing reveals a transitional profibrotic macrophage. Nat. Immunol. 20, 163–172 (2019).
Stuart, T. et al. Comprehensive integration of single-cell data. Cell 177, 1888–1902.e1821 (2019).
Acknowledgements
The authors acknowledge D. Miller for his helpful revision of the manuscript, A. Peyvandipour for providing some of the representative plots, and M. Arenas-Hernandez, Z. Liu and J. Winzeler for their helpful feedback on the protocol. This research was supported by the Perinatology Research Branch, Division of Obstetrics and Maternal-Fetal Medicine, Division of Intramural Research, Eunice Kennedy Shriver National Institute of Child Health and Human Development, National Institutes of Health, US Department of Health and Human Services (NICHD/NIH/DHHS) under contract no. HHSN275201300006C (R.R.). This research was also supported by the Wayne State University Perinatal Initiative in Maternal, Perinatal and Child Health (N.G.-L.). R.R. has contributed to this work as part of his official duties as an employee of the United States Federal Government.
Author information
Authors and Affiliations
Contributions
V.G.-F. wrote the protocol, performed validation experiments, analyzed data and created figures. Y.X. performed validation experiments, analyzed data and created figures. E.P. wrote the protocol, performed validation experiments and created figures. R.R. conceived the study and provided intellectual input. R.P.-R. provided intellectual input, analyzed data and created figures. N.G.-L. conceived the study, supervised the study, provided intellectual input, analyzed data and wrote the protocol. All authors revised and approved the final version of the manuscript.
Corresponding author
Ethics declarations
Competing interests
The authors declare no competing interests.
Peer review
Peer review information
Nature Protocols thanks Padma Murthi, Kristina Adams Waldorf and the other, anonymous, reviewer(s) for their contribution to the peer review of this work.
Additional information
Publisher’s note Springer Nature remains neutral with regard to jurisdictional claims in published maps and institutional affiliations.
Related links
Key references using this protocol
Garcia-Flores, V. et al. Nat. Commun. 13, 320 (2022): https://doi.org/10.1038/s41467-021-27745-z
Pique-Regi, R., et al. eLife 8, e52004 (2019): https://doi.org/10.7554/eLife.52004
Pique-Regi, R., et al. eLife 9, e58716 (2020): https://doi.org/10.7554/eLife.58716
Extended data
Extended Data Fig. 1 Detailed sampling of BP with PV and CAM.
a, Sequential representative images showing the detailed sampling of the BP and PV from the placenta. b, Sequential representative images showing the detailed sampling of the CAM from the placenta.
Extended Data Fig. 2 Immunophenotyping of nonimmune cells in the BP with PV using flow cytometry.
a, Main gate used to identify nonimmune cells. Representative flow cytometry histograms from single antibody staining showing the presence of nonimmune cell populations in the BP with PV (BP + PV). b, Stromal cells (CD10+ cells, CD29+ cells and Vimentin+ cells). c, Epithelial cells (CD326+ cells). d, Trophoblast cells (CK7+ cells). e, Hematopoietic stem cells (CD34+ cells). f, Endothelial cells (CD31+ cells). Pink histograms represent staining with indicated markers, and gray histograms represent negative controls. SSC-A, side scatter area; FSC-A, forward scatter area; Comp., compensation.
Extended Data Fig. 3 Immunophenotyping of nonimmune cells in the CAM using flow cytometry.
a, Main gate used to identify nonimmune cells. Representative flow cytometry histograms from single antibody staining, showing the presence of nonimmune cell populations in the CAM. b, Stromal cells (CD10+ cells, CD29+ cells and Vimentin+ cells). c, Epithelial cells (CD326+ cells). d, Trophoblast cells (CK7+ cells). e, Hematopoietic stem cells (CD34+ cells). f, Endothelial cells (CD31+ cells). Green histograms represent staining with indicated markers, and gray histograms represent negative controls. SSC-A, side scatter area; FSC-A, forward scatter area; Comp., compensation.
Supplementary information
Supplementary Information
Protocol to validate the quality of single-cell suspensions by immunophenotyping.
Rights and permissions
Springer Nature or its licensor (e.g. a society or other partner) holds exclusive rights to this article under a publishing agreement with the author(s) or other rightsholder(s); author self-archiving of the accepted manuscript version of this article is solely governed by the terms of such publishing agreement and applicable law.
About this article

Cite this article
Garcia-Flores, V., Xu, Y., Pusod, E. et al. Preparation of single-cell suspensions from the human placenta. Nat Protoc 18, 732–754 (2023). https://doi.org/10.1038/s41596-022-00772-w
Received:
Accepted:
Published:
Issue Date:
DOI: https://doi.org/10.1038/s41596-022-00772-w
Comments
By submitting a comment you agree to abide by our Terms and Community Guidelines. If you find something abusive or that does not comply with our terms or guidelines please flag it as inappropriate.
