
Abstract
The genetic origins of Japanese populations have been controversial. Upper Paleolithic Japanese, i.e. Jomon, developed independently in Japanese islands for more than 10,000 years until the isolation was ended with the influxes of continental immigrants about 2,000 years ago. However, the knowledge of origin of Jomon and its contribution to the genetic pool of contemporary Japanese is still limited, albeit the extensive studies using mtDNA and Y chromosomes. In this report, we aimed to infer the origin of Jomon and to estimate its contribution to Japanese by fitting an admixture model with missing data from Jomon to a genome-wide data from 94 worldwide populations. Our results showed that the genetic contributions of Jomon, the Paleolithic contingent in Japanese, are 54.3∼62.3% in Ryukyuans and 23.1∼39.5% in mainland Japanese, respectively. Utilizing inferred allele frequencies of the Jomon population, we further showed the Paleolithic contingent in Japanese had a Northeast Asia origin.
Introduction
The genetic origins of modern Japanese have been debated and three models are noteworthy1. In the ‘continuity’ model, modern Japanese are considered as direct decedents of Jomon, the inhabitants of Japan in Paleolithic time, while their morphology showed secular changes2. In the ‘admixture’ model, Jomon admixed with the Yayoi, more recent continental immigrants, which is consistent with the rapid changes in morphology and culture which took place synchronically about 2,500 years before present (BP)1,3. In the ‘replacement’ model, Paleolithic Jomon was completely replaced by the continental immigrants (Yayoi) after their arrival4. To date, the ‘admixture’ model is seemingly better supported by the increasing lines of evidence of multiple genetic components found in modern Japanese5,6,7.
The upper Paleolithic populations, i.e. Jomon, reached Japan 30,000 years ago from somewhere in Asia when the present Japanese Islands were connected to the continent8. The separation of Japanese archipelago from the continent led to a long period (∼13,000 – 2,300 years B.P) of isolation and independent evolution of Jomon9. The patterns of intraregional craniofacial diversity in Japan suggest little effect on the genetic structure of the Jomon from long-term gene flow stemming from an outside source during the isolation10. The isolation was ended by large-scale influxes of immigrants, known as Yayoi, carrying rice farming technology and metal tools via the Korean Peninsula. The immigration began around 2,300 years B.P. and continued for the subsequent 1,000 years5. Based on linguistic studies, it is suggested that the immigrants were likely from Northern China, but not a branch of proto-Korean11.
Genetic studies on Y-chromosome and mitochondrial haplogroups disclosed more details about origins of modern Japanese. In Japanese, about 51.8% of paternal lineages belong to haplogroup O6 and mostly the subgroups O3 and O2b, both of which were frequently observed in mainland populations of East Asia, such as Han Chinese and Korean. Another Y haplogroup, D2, making up 35% of the Japanese male lineages, could only be found in Japan6,12. The haplogroups D1, D3 and D*, the closest relatives of D2, are scattered around very specific regions of Asia, such as the Andaman Islands, Indonesia, Southwest China and Tibet13. In addition, C1 is the other haplogroup unique to Japan6,12. It was therefore speculated that haplogroups D2 and O may represent Jomon and Yayoi migrants, respectively6. However, no mitochondrial haplotypes, except M7a, that shows significant difference in distribution between modern Japanese and mainlanders5. Interestingly, a recent study of genome-wide SNPs showed that 7,003 Japanese individuals could be assigned to two differentiated clusters, Hondo and Ryukyu, further supporting the notion that modern Japanese may be descendent of the admixture of two different components7.
However, the estimation of contribution of the Paleolithic contingency, i.e. Jomon, to modern Japanese posed a technical challenge since all contemporary populations in Japan were subject to admixture at various levels and the ‘pure’ Jomon no longer exist. The STRUCTURE and similar analysis does provide a solution of estimating the relative contribution of different components in admixed populations when both parental populations are available14,15, but such approach was challenged for its accuracy especially when information on parental populations is incomplete16,17.
In this report, we estimated the relative contribution of Paleolithic inhabitants (Jomon) and more recent immigrants (Yayoi) to modern Japanese, under the assumption of the ‘admixture’ model. This was achieved with only one of the parental populations (Yayoi) was available while another parental population (Jomon) was missing. We also explored the possibility of inferring the genetic origin of Jomon.
Results
Genetic contribution of Jomon in mordent Japanese
With the given two-population admixture model (Figure 1, see Materials and Methods section for details), the contributions of Jomon to Hondo Japanese (JP_ML) and Ryukyuans (JP_RK) were estimated by using genome-wide SNP data. Genotypes of both JP_ML and JP_RK populations were produced in PanAsia SNP project (see S1 of Supplementary file).
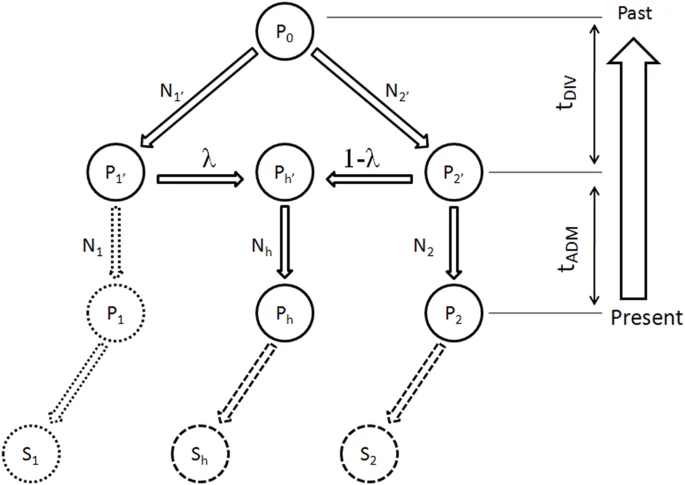
Demographic model of population admixture with missing population.
The original genetic donor to Yayoi migration is still controversial, both Korean and Chinese (northern or southern Han) were potential candidates5,18. Since genetic difference exists between northern and southern Han Chinese populations19, we examined the possible contribution of both northern Han Chinese (NH, combining data of CHB in HapMap project and NHan in HGDP) and southern Han Chinese (SH, combining data of CN-SH in PanAsia SNP project and SHan in HGDP) respectively in this study. We also examined the contribution of northern East Asian population by combining data of NH and Korean (NHK, including NH and Korean population named KR-KR in PanAsia SNP project) since previous genetic studies differed on whether Koreans were the only immigrants in period of later Jomon and early Yayoi5. Therefore totally three potential genetic sources (NH, SH and NHK) were evaluated respectively as continental genetic donor.
The estimated contribution of Jomon to modern Hondo Japanese ranges from 0.231 to 0.395 for different donors (Figure 2). The contribution of Jomon (0.231) is the lowest, when NHK (combination of Northern Han and Korean) was taken as the donor, with 95% confidential interval (C.I.) 0.215–0.266. When NH and SH were taken as donors, estimated contributions were 0.395 (C.I. 0.379–0.421) and 0.376 (C.I. 0.344–0.387), respectively. In contrast, Jomon's contribution in modern Ryukyuans is much greater than that in modern Hondo Japanese, regardless the choice of donors. The estimated contribution are 0.543 (95% C.I. 0.512–0.567), 0.605 (95% C.I. 0.605–0.648) and 0.623 (95% C.I. 0.623–0.671), for NHK, NH and SH, respectively (Figure 2).
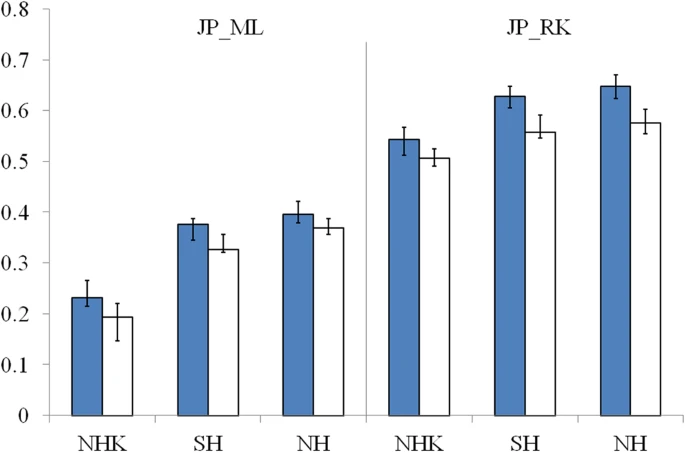
Estimated contributions of Jomon in different genetic scenarios.
Proportions of Jomon's contribution were marked on y-axis and names of the Asian mainland donors were presented on x-axis. Results based on parameters presented in table 1 were shown in blue columns. Open columns presented estimations from scenarios where Jomon's Ne is only a half of before. Black bars indicated 95% C.I of the estimations.
Combining lines of evidence from the above results and previous reports on both maternal and paternal lineages, none of the three possible donors can be excluded from the model for peopling of Japan. We therefore averaged the above estimations from all three possible donors to assess the proportion of Jomon contribution in modern Japanese. Thus, in Hondo Japanese, 33.4% of genetic component was derived from Jomon, whereas, 60.5% of its genetic component in Ryukyuans may come from Jomon. These estimations based on autosome data are consistent with previous studies using frequencies of Y haplogoups in modern Japanese populations. In particular, overall frequency of Japanese specific Y lineages, D2 and C1, is about 60% in Okinawa (Ryukyu) and 26.4∼46.2% in Japanese mainland6.
It is likely that the effective population size (Ne) of Jomon was relatively smaller than that of the populations in Asian mainland, because history of agriculture is relatively shorter in Japan Archipelago than that in Asian mainland. We applied our estimation in scenarios that Ne of ancestry Japanese is only a half of the size in aforementioned estimations. The extent evaluation shows the reduced Ne led to only minor changes to the estimations of Jomon contribution (Figure 2). In particular, the estimated contribution with reduced Ne is 0.194 (95% C.I. 0.146–0.220), 0.326 (95% C.I. 0.321–0.356) and 0.369 (95% C.I. 0.356–0.387) for Hondo Japanese and 0.510 (95% C.I. 0.490–0.525), 0.557 (95% C.I. 0.546–0.592) and 0.575 (95% C.I. 0.554–0.602) for Ryukyuans with three possible donors, respectively. In other words, the estimations are robust to the changes of the parameters of demographic model.
Genetic affinity of Jomons
With the genetic contribution of Jomon in Ryukyuans and Hondo Japanese being 33.4% and 60.5% respectively, allele frequencies of SNPs of ancestral Jomon populations were inferred using the maximum likelihood (ML) method described in the Materials and Methods section. Overall allele frequencies in 6 virtual Jomon populations (JOMON ML-NH, JOMON ML-SH, JOMON ML-NHK, JOMON RK-NH, JOMON RK-SH and JOMON RK-NHK) were inferred based on two extant Japanese populations, i.e. Hondo and Ryukyuans and three possible continental donors including NH, SH and NHK. The inferred allele frequencies of Jomon populations allowed the reconstruction of the phylogeny including Jomon and the extant populations, using coancestry coefficient20 as the measurement of genetic distance and Neighbor-Joining method (NJ) for phylogeny reconstruction. Interestingly, all six inferred Jomon populations fell into the group of Northeast Asian populations but not that of the populations in South Asia or Southeast Asia (Figure 3A). The results of Principle Component Analysis (PCA) confirmed the genetic affinity shown in the NJ tree (Figure 3B). Jomon is therefore genetically closer to North Asian populations than it is to any other populations, suggesting that it is more likely of North Asian origin. The results based on autosomal data do not support the hypothesis of Southeast Asian origin which was proposed by Tuner 2nd (1976)4. In addition, PCA revealed that two modern Japanese are located between mainland Asian populations and Jomon populations, consistent with the notion that they are the descendents of the admixture of mainland Asians and Jomons (Figure 3B). Furthermore, the clustering of Jomon populations inferred from Hondo and Ryukyuan Japanese suggested that their respective Jomon components were of similar, if not identical, origins (Figure 3A &B).
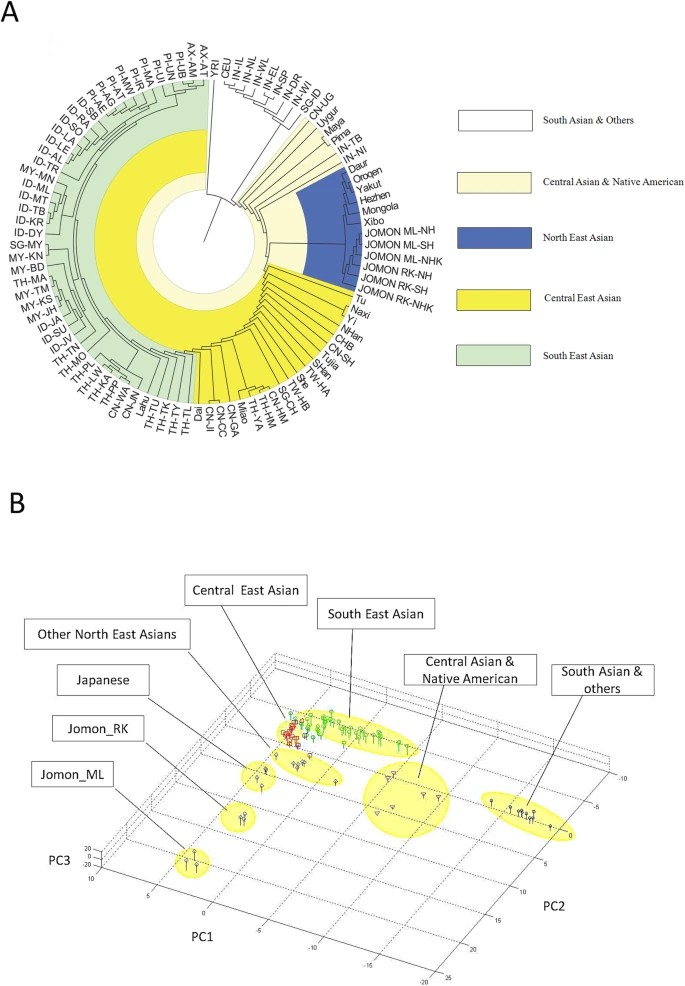
Genetic affinities between Jomon and other Asia populations.
A. NJ tree based on pairwise genetic distance. Each inferred Jomon population was named in population IDs of its admixed descendants and continental donors (JOMON ML-NH, JOMON ML-SH, JOMON ML-NHK, JOMON RK-NH, JOMON RK-SH and JOMON RK-NHK, respectively). B. Populations presented on a 3D plot with axis of PC1, 2 and 3 from PCA analysis. Features of the genetic affinities were the same as those were discovered by NJ tree.
Discussion
Through the estimations and inferences presented above, this study may shed light on the understanding of peopling of Japan. A few critical issues related to the findings of this work need to be further scrutinized.
Our result suggested D2 lineage of Y chromosome provides insufficient information on Jomon's origin. Sharing of haplogroup D-M174 between central Asian populations and Japanese has been recognized as evidence of central Asian origin for paternal lineage of Paleolithic Japanese6. However, this study showed that some populations carrying branches of Y haplogroup D-M174 (D*: 10% in Dai; D1: 7.7% in Chuang, 2.59% in Tujia; D3: 28.89% in Naxi) showed little genetic relationship with the inferred Jomon populations (Figure 3)13. Furthermore, Y haplogroup D-M174 appears rarely in North Asian populations when the populations have a close genetic relationship with Jomon (Figure 3). The only appearance of D2 lineage in Japanese and the widespread geographic distribution of D-M174 made it practically impossible to pinpoint a population in the continent that provided the D2 lineage to Japanese. In contrast, autosomal markers indeed provide additional information that connects Jomon and North Asians.
In this study, a specified model was used to evaluate genetic admixture in modern Japanese populations. However, there is another powerful approach that was commonly applied in data analysis for population admixture, Bayesian method implemented in STRUCTURE. The Bayesian method focuses on a genetic inheritance model specified in terms of the proportion of an individual's genome originating from each of a set of possible subpopulations21. The method is powerful and well recognized. However, when population history is partially understood and the divergence among ancestral populations is relatively small, performance of the Bayesian method is not fully clarified yet22. We applied the Bayesian method on 4 Japanese populations and 9 other East Asian populations with assumption that all the populations shared 2, 3, or 4 independent ancestry populations (Figure 4). None of inferred genetic components from STUCTURE could well explain the great frequency difference of Japanese specific Y lineages, D2 and C1, between modern Hondo Japanese and Ryukyuans, while our estimations were concordant with the previous reports (Figure 2 & 3). The comparison suggested a specified model could be superior when population history was partially known.

Estimated admixtures with different pre-given value for number of genetic components in STRUCTURE 2.3.
Geographic distribution of lineages explained the great contribution of Yayoi in our results. Hammer et al. investigated geographic distribution of Y lineages in Japanese populations. Haplogroup frequencies of the Y lineages showed U-shape cline with significant correlation with geographic distance of the populations from Kyushu. In briefs, the frequency of D2 lineage increased with increase of the distance meanwhile frequencies of O lineages decreased6. The O lineages were recognized as a Yayoi founding lineage and D2 lineage was believed to be Jomon specific6,23. Therefore, the pattern of geographic distribution of lineages supported published archeological and anthropological results about population expansion during Jomon and Yayoi period in Japan. The archeological studies suggested general demographic density was significantly greater in eastern Japan compared to western Japan around the 3,300 years BP and a rapid increase first happened in West Japan around 2,000 years BP24. The studies of physical anthropology on human skeleton showed the new continental immigrants in West Japan, Yayoi people, have better capability to achieve enough foods to feed more people than Jomon24,25. The pattern of population expansion may explain the great genetic contribution (about 60–72%) of Yayoi in extent Japanese. Size of continental immigration was not necessary to be very large but descendants of the immigrants increased rapidly and subsequently dispersed from West Japan to other regions. Population admixture between the continental descendants (Yayoi) and Jomon descendants shaped genetic pattern of extent Japanese. Straits between Japanese islands and Asian mainland may not act as effective barriers to the genetic admixture.
This study supplied a genetic view for peopling of Japan. Both contributions and genetic affinity of Paleolithic Jomon were investigated in quantitative approach. However, the results should be improved continuously in further analysis. At first, the demographic model shall be improved when more data become available across Eurasia, especially from East Asia. Any improvement for the demographic model will lead to better estimation and inference in the model-based approach. The second, the used divergence time between historical Jomon and continental Yayoi should be validated with increased lines of evidence in future although both archeological evidences and genetic studies supported a divergence time between Jomon and continental populations is properly around 20,000 years BP5,6. Furthermore, relatives of Yayoi in Asian mainland should be specified further.
Methods
Genotype data
This study involves 94 populations from worldwide, mostly Asia. Genotype data of these populations were collected from three sources, Pan-Asia SNP project26, the International HapMap project27 and Human Genome Diversity Project (HGDP)28. In the Pan-Asia SNP project, DNA samples from 1,719 unrelated individuals of 71 representative populations from China, India, Indonesia, Japan, Malaysia, the Philippines, Singapore, South Korea and Thailand etc. were collected and genotyped in Affymetrix platform26. Genotypes for 60 unrelated European-Americans (CEU), 60 unrelated Yoruba (YRI), 45 unrelated Chinese (CHB) and 44 unrelated Japanese (JPT) were downloaded from the website of International HapMap project. Furthermore, the HGDP data was obtained from website of Stanford Human Genome Center for genotypes of 240 individuals of 17 East Asia populations and 45 individuals of 2 Native American populations. Finally, 20,362 SNPs with average spacing of 134.8 kb shared among all the 94 populations were included for further analyses. Names of populations, population IDs, sample sizes and more details could be found in online material (see S1 of Supplementary file).
Admixture model
A genetic model (Figure 1) including two parental populations (P1 and P2) and one admixed population (Ph) is frequently used to evaluate contribution of historical genetic donors (population P1′ and P2′) to the population with admixture (Ph)22,29. The P1′, P2′ and Ph' are ancestral populations to P1, P2 and Ph, respectively at tAMD generations before present when the parental populations P1′ and P2′ admixed and led to emergence of Ph′ . P1′ and P2′ contributed to Ph′ with the proportion of λ and 1 - λ, respectively. All the populations have a common ancestral population, P0, at the divergence of the two parental populations, P1′ and P2′. Time of the divergence is tDIV generations before the admixture event. Each population in each historical stage have effective population size Nj, j ∈ {1, 2, h, 1′, 2′} (see Figure 1 for detail). Samples (in sizes of S1, S2 and Sh) were collected from the three currently observable populations (P1, P2 and Ph). In Wright-Fisher model on assumption of Hardy-Weinberg Equilibrium (HWE), probability of the observation in samples can be calculated using Bayesian theorem when all demographic parameters are known.29
Estimating historical genetic contribution
Likelihood method was applied on the aforementioned demographic model for parameter estimation29. Wang's method, implemented in LEADMIX, estimates multiple demographic parameters simultaneously using genotype data from the parental informative populations (P1 and P2) and the admixed descendants (Ph). In this study, however, the genotypes on one of the parental populations, i.e. Jomon, is unavailable since none of the modern Japanese populations could be used as pure descendants of Jomon without admixture with Yayoi people. LEADMIX neither was evaluated for its performance for the scenarios with missing parental population, not it could handle thousands of markers simultaneously. Therefore, we developed another maximum likelihood (ML) approach to estimate the contribution of the missing parental population.
The basic idea of ML method is to maximize the probability of observations with an appropriate value for genetic contribution λ. For a specific locus j, the observed counts of a given allele are Cj2 and Cjh in samples from population P2 and Ph, respectively. Given the demographic parameters  , the probability of observation on locus j could be calculated as bellows

where

Here, {fk|k = 0, 2, h, 2′, h'} is allele frequency of the given allele in a specific population k. Effective population sizes are given in {Nk|k = 0, 2, h, 2′, h'}.
With n independent loci or loci with ignorable linkage disequilibrium, we have probability of observations on the n loci

Thus, genetic contribution λ can be estimated by maximizing the probability of observations using the ML approach.
During the calculation for probability of observations, allele frequencies in descendant populations were determined by allele frequency in ancestry population P0 and other given demographic parameters, {ω|S2, Sh, N2, Nh, N1′, N2′, λ}, in the Wright-Fisher model. The allele frequency in common ancestral population P0 could be determined by either coalescence theory or uniform distribution with range from 0 to 122,29,30,31. However, joint frequency spectrum of given alleles in descendent populations (P1′, P2′, Ph', P1, P2 and Ph) is difficult to be presented in closed form. We utilized a forward Monte Carlo (MC) simulation to obtain the joint frequency spectrum and calculate the probability of observations.
To maximize the probability of observations, an algorithm of golden section search was implemented with the aforementioned probability calculation. The algorithm finds the extremum of probability by successively narrowing the range of genetic contribution λ32. In other words, we seek a genetic contribution λ given the best explanation to the observations. We executed the search algorithm for multiple times on independent data sets of the same populations to reduce uncertainty of the MC calculation. Median of the optimized results supplies a robust estimation of genetic contribution λ from results of the multiple runs. The two-side 95% confidential intervals of the median are given by order statistics33. Evaluation on simulation data showed that our approach was accurate in multiple scenarios and robust to ascertain bias of marker allele frequency (see S2 and S3 of Supplementary file).
Estimating contribution of Jomon
Parameters of the demographic model (Figure 1), except genetic contribution λ, must be given before further admixture analysis using aforementioned ML method.
The estimated time of divergence between Jomon and their continental relatives is ∼14,000-30,000 years B.P., properly around 20,000 years B.P. (based on coalescent time of Y haplogroup M174-D2)5,6. The arrival of Yayoi people and the admixture of Yayoi and Jomon occurred about 2,000∼2,500 years BP9. We therefore let tDIV = 1,000 and tAMD = 100 generations in subsequent analyses. The rapid accumulation of genetic data improves the reliability of demographic model of human populations. Based on fitness of allele frequency spectrum of simulation data and multi-locus sequencing data, Schaffner et al. identified an optimized demographic model including Han Chinese and Japanese34. The best fitted demographic model with its parameters have been well supported and widely applied in genetic studies35,36,37,38,39. Thus, we employed the parameters of population dynamics described in Schaffner et al (2005) in our admixture estimation (table 1).
In each estimation, 30 SNP sets were involved, each with 500 SNPs randomly selected with replacement from 20,362 SNPs. The contribution of Jomon to extant Japanese populations was estimated using all 30 groups individually and the median of the estimations was taken as the overall estimation.
Inference of allele frequency of the missing parental population
In order to explore genetic affinity of Jomon with the extant populations, we estimated allele frequency of each SNP in Jomon population using an ML method. Given a genetic contribution λ and current observation Cj2 and Cjh on locus j for population P2 and Ph, allele frequency fj1′ in the missing ancestral population P1′ could be estimated when the recent effective population sizes (Nh and N2) are large and the admixture event is relatively young. Details of the estimation were addressed below.
Given the current observation Cj (Cj2, Cjh) and sample size S (S2, Sh), we have the probability of observation

where

In order to maximize the probability , we let partial derivatives of Equation 4 to be zero. After solving the partial derivative equations, we have estimation for the allele frequency in missing parental population fj1 by

Discovery of Genetic Relationships
With the estimated genetic contributions of Jomon in Ryukyuans and Hondo Japanese, we inferred the allele frequencies of corresponding markers of Jomon populations using genotype data of Ryukyuans (JP_RK), Hondo Japanese (JP_ML) and all the three possible genetic sources (NH, SH and NHK). Allele frequencies of Jomon were inferred separately utilizing pairs of the data (JP_RK and NH, JP_RK and SH, JP_RK and NHK, JP_ML and NH, JP_ML and SH, JP_ML and NHK) in this study. Using the inferred frequencies, we explored genetic relation between Jomon and other Asian populations.
The coancestry coefficient is a measure of genetic distance and the coefficient determined by drift only is proportion to divergence time of pairwise populations20. We calculated the coancestry coefficient to uncover pairwise genetic distance between Jomon and other Asian populations. Based on the genetic distances, NJ tree was built to present possible genetic affinities in program Splits Tree 4.040. All mordent Japanese populations and Korean were excluded from the NJ tree to avoid possible bias because coancestry coefficient was not originally proposed to handle such admixed populations. Simultaneously, Principle Component Analysis (PCA) was used to visualize genetic affinity based on direct difference of the allele frequencies of all populations. The PCA analysis was conducted in Matlab language and computational environment (version 2007b).
References
Hanihara, K. Dual structure model for the population history of the Japanese. Japan Review 2, 1–33 (1991).
Mizoguchi, Y. Contributions of prehistoric Far East populations to the population of modern Japan: a Q-mode path analysis based on cranial measurements. Prehistoric hunter-gatherers in Japan: new research methods 27, 107–136 (1986).
Omoto, K. & Saitou, N. Genetic origins of the Japanese: a partial support for the dual structure hypothesis. Am. J. Phys. Anthropol 102, 437–446 (1997).
Tuner, C.. G., 2nd Dental evidence on the origins of the Ainu and Japanese. Science 193, 911 (1976).
Tanaka, M. et al. Mitochondrial genome variation in eastern Asia and the peopling of Japan. Genome Res 14, 1832–1850 (2004).
Hammer, M. F. et al. Dual origins of the Japanese: common ground for hunter-gatherer and farmer Y chromosomes. J. Hum. Genet 51, 47–58 (2006).
Yamaguchi-Kabata, Y. et al. Japanese population structure, based on SNP genotypes from 7003 individuals compared to other ethnic groups: effects on population-based association studies. Am. J. Hum. Genet 83, 445–456 (2008).
Ono, A., Sato, H., Tsutsumi, T. & Kudo, Y. Radiocarbon dates and archaeology of the Late Pleistocene in the Japanese islands. Radiocarbon 44, 477–494 (2002).
Chard, C. S. Northeast Asia in prehistory (Univ of Wisconsin Pr: 1974).
Hanihara, T. & Ishida, H. Regional differences in craniofacial diversity and the population history of Jomon Japan. Am. J. Phys. Anthropol 139, 311–322 (2009).
Beckwith, C. I. Koguryo, the language of Japan's continental relatives: an introduction to the historical-comparative study of the Japanese Koguryoic languages with a preliminary description of Archaic northeastern Middle Chinese (Brill Academic Pub: 2004).
Tajima, A. et al. Genetic origins of the Ainu inferred from combined DNA analyses of maternal and paternal lineages. J. Hum. Genet 49, 187–193 (2004).
Shi, H. et al. Y chromosome evidence of earliest modern human settlement in East Asia and multiple origins of Tibetan and Japanese populations. BMC Biol 6, 45 (2008).
Xu, S., Huang, W., Qian, J. & Jin, L. Analysis of genomic admixture in Uyghur and its implication in mapping strategy. Am. J. Hum. Genet 82, 883–894 (2008).
Xu, S. & Jin, L. A genome-wide analysis of admixture in Uyghurs and a high-density admixture map for disease-gene discovery. Am. J. Hum. Genet 83, 322–336 (2008).
Hauser, L., Seamons, T. R., Dauer, M., Naish, K. A. & Quinn, T. P. An empirical verification of population assignment methods by marking and parentage data: hatchery and wild steelhead (Oncorhynchus mykiss) in Forks Creek, Washington, USA. Mol. Ecol 15, 3157–3173 (2006).
Waples, R. S. & Gaggiotti, O. What is a population? An empirical evaluation of some genetic methods for identifying the number of gene pools and their degree of connectivity. Mol. Ecol 15, 1419–1439 (2006).
Li, S.-L. et al. Phylogenetic relationship of the populations within and around Japan using 105 short tandem repeat polymorphic loci. Hum. Genet 118, 695–707 (2006).
Xue, F. et al. A spatial analysis of genetic structure of human populations in China reveals distinct difference between maternal and paternal lineages. Eur. J. Hum. Genet 16, 705–717 (2008).
Reynolds, J., Weir, B. S. & Cockerham, C. C. Estimation of the Coancestry Coefficient: Basis for a Short-Term Genetic Distance. Genetics 105, 767–779 (1983).
Pritchard, J. K., Stephens, M. & Donnelly, P. Inference of population structure using multilocus genotype data. Genetics 155, 945–959 (2000).
Excoffier, L., Estoup, A. & Cornuet, J.-M. Bayesian Analysis of an Admixture Model With Mutations and Arbitrarily Linked Markers. Genetics 169, 1727–1738 (2005).
Karafet, T. M. et al. Ancestral Asian source(s) of new world Y-chromosome founder haplotypes. Am. J. Hum. Genet 64, 817–831 (1999).
Koyama, S. Jomon subsistence and population. Senri Ethnological Studies 2, 1–65 (1978).
Temple, D. H. What can variation in stature reveal about environmental differences between prehistoric Jomon foragers? Understanding the impact of systemic stress on developmental stability. Am. J. Hum. Biol 20, 431–439 (2008).
Abdulla, M. A. et al. Mapping human genetic diversity in Asia. Science 326, 1541–1545 (2009).
Frazer, K. A. et al. A second generation human haplotype map of over 3.1 million SNPs. Nature 449, 851–861 (2007).
Li, J. Z. et al. Worldwide human relationships inferred from genome-wide patterns of variation. Science 319, 1100–1104 (2008).
Wang, J. Maximum-likelihood estimation of admixture proportions from genetic data. Genetics 164, 747–765 (2003).
Fu, Y. X. Statistical properties of segregating sites. Theoretical Population Biology 48, 172–197 (1995).
Wang, J. A Coalescent-Based Estimator of Admixture From DNA Sequences. Genetics 173, 1679–1692 (2006).
Press, W. H., Flannery, B. P., Teukolsky, S. A. & Vetterling, W. T. Numerical recipes in C: the art of scientific programming (Cambridge U. Press, Cambridge, England, 1992).
Campbell, M. J. & Gardner, M. J. Calculating confidence intervals for some non-parametric analyses. Br Med J (Clin Res Ed) 296, 1454–1456 (1988).
Schaffner, S. F. et al. Calibrating a coalescent simulation of human genome sequence variation. Genome Res 15, 1576–1583 (2005).
Garrigan, D., Lewontin, R. & Wakeley, J. Measuring the sensitivity of single-locus “neutrality tests” using a direct perturbation approach. Mol. Biol. Evol 27, 73–89 (2010).
Helgason, A. et al. Refining the impact of TCF7L2 gene variants on type 2 diabetes and adaptive evolution. Nat. Genet 39, 218–225 (2007).
Pickrell, J. K. et al. Signals of recent positive selection in a worldwide sample of human populations. Genome Res 19, 826–837 (2009).
Sabeti, P. C. et al. Genome-wide detection and characterization of positive selection in human populations. Nature 449, 913–918 (2007).
Scheinfeldt, L. B. et al. Population genomic analysis of ALMS1 in humans reveals a surprisingly complex evolutionary history. Mol. Biol. Evol 26, 1357–1367 (2009).
Huson, D. H. & Bryant, D. Application of phylogenetic networks in evolutionary studies. Molecular biology and evolution 23, 254 (2006).
Acknowledgements
We thank anonymous reviewers for comments which improved the study and the manuscript. Y.H. gratefully acknowledges the support of SA-SIBS scholarship program. This work was supported by grants from Shanghai Institutes of Biological Sciences (2010KIP206 to Y.H.) and National Natural Science Foundation of China (81100997 and 31171279 to Y.H.; 30890034 and 30625016 to L.J.). L.J. was also supported by Shanghai Leading Academic Discipline Project (B111) and the Center for Evolutionary Biology at Fudan University. The funders had no role in study design, data collection and analysis, decision to publish, or preparation of the manuscript.
Author information
Authors and Affiliations
Contributions
H.Y. and W.W. carried out the studies and performed the statistical analysis. H.Y. and J.L. designed the study. H.Y., J.L. and X.S. participated in its coordination and helped to draft the manuscript. Members of Pan-Asia SNP Consortium conceived the data production and participated in its coordination. All authors read and approved the final manuscript.
Ethics declarations
Competing interests
The authors declare no competing financial interests.
Additional information
The Pan-Asian SNP consortium authorship list
China: ChineseNational HumanGenome Center at Shanghai: Wei Huang (Project Leader), Ying Wang,Wentao Yuan,HaifengWang, Guoping Zhao (Principal Investigator); Institute of Medical Biology, Chinese Academy of Medical Science: Jiayou Chu; National Engineering Center for Biochips at Shanghai: Huasheng Xiao, Junsong Han; School of Life Sciences, Fudan University; CAS-MPG Partner Institute for Computational Biology, Shanghai Institutes of Biological Sciences, Chinese Academy of Sciences: Li Jin (Principal Investigator), Shuhua Xu (Project Leader). India: Institute of Genomics and Integrative Biology: Mitali Mukerji (Project Leader), Amit Sinha, Vinod Scaria, Amit Chaurasia,, Pankaj Jha, Ikhlak Ahmed, Indian Genome Variation Consortium, Samir K. Brahmachari (Principal Investigator); Indian Statistical Institute (Kolkata): Partha P. Majumder; The Centre for Genomic Applications: Kiran Kumar Mandapati, Preeti Khurana. Indonesia: Eijkman Institute for Molecular Biology: Herawati Sudoyo (Project Leader), Yuliana Sandraling, Helena Suryadi, Sangkot Marzuki (Principal Investigator). Japan: Health Sciences University of Hokkaido: Norio Niikawa; National Institute of Genetics: Takashi Gojobori (Principal Investigator), Yoshiyuki Suzuki, Tomohiro Koike; RIKEN Genomic Sciences Center: Yoshiyuki Sakaki (Principal Investigator); Tokai University School of Medicine: Akira Oka, Hidetoshi Inoko; University of the Ryukyus: Kenji Naritomi; University of Tokyo, School of Medicine: Katsushi Tokunaga (Principal Investigator), Nao Nishida, Jun Ohashi, Ryosuke Kimura, University of Tokyo, Graduate School of Frontier Science: Sumio Sugano (Principal Investigator). Korea: Eulji University College of Medicine: Kuchan Kimm; Korea National Institute of Health: Jongsun Jung (Project Leader), Bermseok Oh, Jongyoung Lee, Kwangjoong Kim, Hyung-Lae Kim (Principal Investigator), Korean Bioinformation Center, Korean Institute of Bioscience and Biotechnology: Ho Ghang (Project Leader), Woo-Yeon Kim, Sunghoon Lee, Jin Ok Yang, Sangho Oh, Hyang Sook Yoo, Jong Bhak (Principal Investigator); Soongsil University: Sangsoo Kim. Malaysia: University of Malaya: Maude Elvira Phipps (Principal Investigator), Timothy Adrian Jinam, Juli Edo,Mahmood Ameen Abdulla; Universiti Sains Malaysia: Bin-Alwi Zilfalil (Principal Investigator), Hoh Boon Peng, Mohd Ros Sidek. Philippines: Natural Sciences Research Institute, University of the Philippines, Diliman: Maria Corazon A. De Ungria (Project Leader), Gayvelline C. Calacal, Frederick C. Delfin, Henry B. Perdigon, Jazelyn M. Salvador, Kristina A. Tabbada, Lilian P.Villamor; Institute of Human Genetics, University of the Philippines,Manila: Eva Maria C. Cutiongco-de la Paz, Carmencita D. Padilla (Principal Investigator). Singapore: Genome Institute of Singapore: Mark Seielstad (Principal Investigator), Vikrant Kumar, Jieming Chen, Wayne Mitchell, Rick Ong, Eileen Png, Adrian Tan, Edison T. Liu (PASNPI Project Leader); National University of Singapore: Poh-San Lai Taiwan: Institute of Biomedical Sciences, Academia Sinica: Chien-Hsiun Chen (Principal Investigator), Yuan-Tsong Chen, Jer-Yuarn Wu, Sheng-Feng Ho. Thailand: Chiang Mai University: Daoroong Kangwanpong (Principal Investigator), Metawee Srikummool, Jatupol Kampuansai; National Center for Genetic Engineering and Biotechnology: Prasit Palittapongarnpim (Project Leader), Sissades Tongsima, Chumpol Ngamphiw, Supasak Kulawonganunchai; Mahidol University: Suthat Fucharoen (Project Leader), Anunchai Assawamakin. USA: Affymetrix: Giulia C. Kennedy (Principal Investigator), Eric Wang; John Hopkins University: Yin Yao.
Electronic supplementary material
Supplementary Information
Supplementary file
Rights and permissions
This work is licensed under a Creative Commons Attribution-NonCommercial-ShareALike 3.0 Unported License. To view a copy of this license, visit http://creativecommons.org/licenses/by-nc-sa/3.0/
About this article
Cite this article
He, Y., Wang, W., Xu, S. et al. Paleolithic Contingent in Modern Japanese: Estimation and Inference using Genome-wide Data. Sci Rep 2, 355 (2012). https://doi.org/10.1038/srep00355
Received:
Accepted:
Published:
DOI: https://doi.org/10.1038/srep00355
This article is cited by
-
Demographic history of Ryukyu islanders at the southern part of the Japanese Archipelago inferred from whole-genome resequencing data
Journal of Human Genetics (2023)
-
A partial nuclear genome of the Jomons who lived 3000 years ago in Fukushima, Japan
Journal of Human Genetics (2017)
Comments
By submitting a comment you agree to abide by our Terms and Community Guidelines. If you find something abusive or that does not comply with our terms or guidelines please flag it as inappropriate.
