
Abstract
Genomic studies of speciation often report the presence of highly differentiated genomic regions interspersed within a milieu of weakly diverged loci. The formation of these speciation islands is generally attributed to reduced inter-population gene flow near loci under divergent selection, but few studies have critically evaluated this hypothesis. Here, we report on transcriptome scans among four recently diverged pairs of sunflower (Helianthus) species that vary in the geographical context of speciation. We find that genetic divergence is lower in sympatric and parapatric comparisons, consistent with a role for gene flow in eroding neutral differences. However, genomic islands of divergence are numerous and small in all comparisons, and contrary to expectations, island number and size are not significantly affected by levels of interspecific gene flow. Rather, island formation is strongly associated with reduced recombination rates. Overall, our results indicate that the functional architecture of genomes plays a larger role in shaping genomic divergence than does the geography of speciation.
Introduction
Advances in high-throughput sequencing and computational biology have made it possible to ask new questions in speciation research, such as identifying the numbers, effect size and distribution of loci involved in population divergence. One such question that has received considerable attention over the past decade concerns how genomes diverge during speciation. Theory predicts that levels of genetic divergence across the genome will be more heterogeneous in populations diverging in the presence of gene flow (sympatry or parapatry) than in geographically isolated (allopatric) populations1,2,3. In allopatry, geographical separation simultaneously isolates the entire genome, so both neutral and adaptive genetic differences accumulate across the genome4. In contrast, during speciation with gene flow, differentiation should be accentuated for loci under divergent natural selection (and loci tightly linked to them—hitchhiker loci), whereas gene flow will likely homogenize neutral or more weakly-selected regions1. Under some models of speciation with gene flow, regions of genetic divergence are predicted to expand as populations diverge, forming so-called speciation islands, because of reductions in effective gene flow rates near loci under divergent selection, a process sometimes referred to as divergence hitchhiking5,6. In contrast, hybrid zone theory implies that divergence at hitchhiker loci will be eroded by gene flow and that zones of contact between differentiated populations are frequently stable and will not necessarily lead to further divergence and speciation7. While speciation islands are commonly reported in genomic studies of speciation with gene flow2,5,8,9, their sizes and causation remain unclear potentially because of low-resolution scan, lack of allopatric control, and/or incomplete consideration of possible causes3,4.
To estimate the effects of gene flow on patterns of genomic divergence, we compared levels of differentiation across the genomes of four pairs of wild sunflower (Helianthus) species that have similar divergence times but differ in the geographical context of speciation (see Fig. 1, redrawn from Rogers et al.10). Here, the geographical context of speciation is used as a proxy for levels of gene flow encountered during speciation and subsequent species divergence. While our classification is more qualitative in nature, numerous lines of evidence support it, as described below. The species are diploid (n=17) annuals, with an obligate outcrossing mating system, which simplifies interpretation of population genomic data. Helianthus annuus and H. petiolaris are abundant and sympatric throughout the central and western United States. While it is not possible to rule out a phase of allopatry during speciation, the indigenous ranges of these two sympatric species are almost identical, and all evidences indicate that the species have likely been exchanging genes during much of their history of divergence11,12. Although partially isolated by several strong reproductive barriers, both early- and later-generation H. annuus–petiolaris hybrid genotypes have been documented in hybrid swarms13 and coalescent estimates of interspecific gene flow (Nem=0.34–0.76) (14) are well within the range of intraspecific gene flow estimates for outcrossing plant species15. H. debilis, a species native to the southern United States16, is parapatric with both H. annuus and H. argophyllus in southern Texas, but with different consequences. Contact of H. debilis with H. annuus, likely secondary, has resulted in extensive interspecific gene flow in Texas since at least the beginning of the Holocene, circa 12,000 years ago17. In addition, the southward expansion of H. annuus is thought to have been facilitated by adaptive introgression with locally adapted populations of H. debilis18. In contrast, no evidence of recent gene flow between H. debilis and H. argophyllus has been reported in the literature, despite these species having been studied for close to 100 years19. Lastly, H. petiolaris and H. argophyllus are geographically isolated (Fig. 1) and molecular data are consistent with the absence of interspecific gene flow during their entire history of divergence20. These two species are nevertheless still capable of producing partially fertile hybrids in control crosses21.

(a) Species range (redrawn from Rogers et al.10). For H. debilis, the range shown is for two subspecies native to Texas because molecular phylogenetic analyses indicate that the other three subspecies (native to Florida) form a separate monophyletic taxon52. (b) Phylogenetic relationship of four species pairs studied here (1. sympatric, high gene flow: H. annuus–H. petiolaris; 2. parapatric, high gene flow: H. annuus–H. debilis; 3. parapatric, no introgression: H. debilis–H. argophyllus; 4. allopatric, no introgression: H. petiolaris–H. argophyllus).
We found that the average genetic distance (as measured by FST) was lower, and the proportion of divergent substitutions fixed by selection (alpha) higher, in sympatric compared to allopatric species pairs. Genomic islands of divergence were strongly associated with reduced recombination rates and weakly associated with an excess of co-expressed genes, implying that features of the genome may have a larger impact on patterns of genomic variation and divergence than do levels of interspecific gene flow.
Results
Trancriptome alignments and overall divergence
Genetic divergence was estimated by sequencing the transcriptomes of 107 genotypes spanning the geographic ranges of the four focal species (Supplementary Table S1), which allowed us to examine divergence in both gene sequence and expression. Sequences were aligned against a reference transcriptome of 51,468 contiguous expressed sequences (contigs). Between 198,000 and 240,000 single-nucleotide polymorphisms (SNPs) per species pair (Table 1), with an average of 3.0 SNPs per 100 bp, passed our strict quality controls (see Methods). From this curated data set, a standard measure of genetic divergence, FST, was calculated for each SNP.
As expected based on geographic distributions of the species and previous estimates of interspecific gene flow levels, average FST values were considerably higher in the allopatric and parapatric (no gene flow) pairs (FST=0.51 and 0.48, respectively) than in the parapatric (high gene flow) and sympatric pairs (FST=0.36 and 0.30, respectively, Table 1 and Supplementary Fig. S1). In addition, the shape of the FST distributions varied between species pairs (Kolmogorov–Smirnov test, P-value <2e−16 for all pairwise comparisons) and accord with expectations based on levels of interspecific gene flow. Both comparisons with high gene flow showed an L-shaped distribution with few fixed loci, in sharp contrast with the low gene flow comparisons showing a greater proportion of highly divergent loci (Supplementary Fig. S1).
Rates of protein evolution
Divergence in the presence of gene flow is also expected to increase the proportion of base substitutions driven to fixation by positive selection (alpha) relative to neutral fixed differences, since the latter are predicted to be eroded by interspecific gene flow. To test this hypothesis, we identified all open reading frames and calculated alpha22 by comparing the number of polymorphic versus fixed differences at synonymous and presumably neutral sites relative to non-synonymous sites that may be subject to natural selection. As expected, alpha was the greatest in sympatric and parapatric (high gene flow) comparisons and lowest in the parapatric (no gene flow) and allopatric comparisons (Table 2 and Supplementary Table S2).
High-density genetic map
Next, we generated a high-density genetic map for H. annuus to determine the genetic position of FST values. This was accomplished by whole-genome shotgun sequencing of two highly inbred sunflower cultivars to ~10 × coverage and 96 recombinant inbred lines (RILs) derived from them to 1 × depth. Parental reads were aligned to a draft assembly of the sunflower genome23 and genomic contigs in each RIL were called as descended from one or the other parent. MSTMAP24 was used to place the contigs in linear order. After binning matching contigs, circa 2.6 million SNPs were mapped to 17 linkage groups corresponding to the 17 chromosomes of H. annuus (Supplementary Fig. S3). Contigs from the reference transcriptome mapped to 3,047 unique locations on the genetic map, with a mean distance between map positions of 0.45 cM. An average of 98 SNPs from the transcriptome comparisons aligned to each unique location on the genetic map.
Genomic clustering of SNPs
Using a sliding window approach to minimize noise from individual sites and bootstrap resampling to assess significance, we investigated the spatial distribution of divergent loci along linkage groups. As expected, genetic divergence was highly heterogeneous along the genome (Fig. 2). We identified many, mostly small (genetic distance size of less than 1 cM), genomic regions (Fig. 2, coloured dots) containing a significant excess of ‘outlier’ markers, defined as SNPs falling in the top three percentile of the empirical FST distribution. Contrary to expectations from divergence hitchhiking theory, the size and number of these islands of divergence did not differ between comparisons (Table 1; mean island size=0.43 cM, non-parametric Kruskal–Wallis rank sum test, χ2(3)=3.7, P-value=0.29; mean number of islands=53, chi-square test, χ2 (3, N=210)=2.2, P-value=0.53). We also find that sample sizes would need to be nearly twice as large (that is, identify twice as many islands) for the differences in island sizes reported here to be significant (Supplementary Fig. S4). Such results would nevertheless contradict predictions from divergence hitchhiking theory and imply that island sizes are larger in allopatry than in sympatry (Table 1).

FST distribution along the genome with coloured dots representing regions containing a statistically significant excess of highly divergent loci (top three percentile) compared to the genome-wide average. Significance (P-value <0.001) was assessed according to the bootstrap resampling test described in the methods.
We also explored different criteria to define divergent windows (top one percentile of the empirical FST distribution, top five percentile, mean FST of window significantly above global average) in addition to different window sizes (1 or 2 cM). Results were similar to those presented here; genomic islands of divergence appear small (less than 1 cM) and do not vary significantly among comparisons. In fact, despite our sliding window approach, one-third of all regions did not span more than a single-map position, and the median number of genes per island was seven, with few regions harbouring many genes (max=404), and many harbouring few (min=1). Lastly, we calculated how many islands would be expected if divergent markers were randomly distributed throughout the genome. In this case, the average number of islands (8) and size (~0.02 cM) were very small and similar between all four comparisons (Supplementary Table S3), implying that genomic divergence is more heterogeneous than expected from a random distribution of loci.
The islands of divergence identified through the sliding window analysis described above contain only a small fraction of all divergent loci (6–9%), with the remainder being dispersed across the genome. Therefore, we also assessed the amount of overall clustering of divergent loci using spatial autocorrelation statistics. This approach revealed that while the degree of clustering varied among chromosomes (Fig. 3, one-way ANOVA: F16,319=3.97, P-value=7.3e−07 for the chromosome effect), it decayed rapidly and essentially no clustering was observed at distances greater than 5 cM (Fig. 3, one-way ANOVA: F16,319=188.7, P-value <2.2e−16 for the distance class effect). In addition, the degree of clustering was not influenced by species pair (similar linear regression slopes between spatial autocorrelation statistics and size classes in Fig. 3, one-way ANOVA: F3,319=0.8, P-value=0.77 for the species pair effect).

Spatial autocorrelation (log(observed/expected joint count)) statistics, in order to assess the genome-wide clustering of the highly divergent (top three percentile) markers, calculated per chromosome and per species pairs. A value of 0 (dashed line) indicates that highly divergent markers are randomly distributed throughout a chromosome at a particular spatial scale (0–0.1, 0.1–1, 1–3, 3–5, 5–10 cM). Solid coloured lines indicate the slope of the linear regression between spatial autocorrelation statistics and size classes.
Reference transcriptome, genetic map, SNP tables, FST values and raw read counts per gene are deposited in the Dryad Digital Repository ( http://datadryad.org/resource/doi:10.5061/dryad.9q1n4).
Genomic factors influencing divergence
Having failed to find evidence of divergence hitchhiking, we explored other possible causes of island formation. For example, empirical studies of genomic divergence often report higher levels in regions of low recombination25. Recombination rates across the sunflower genome were inferred by comparing our high-density genetic map to a physical map recently developed for H. annuus23,26 (Supplementary Figs S5 and S6). We found that overall, recombination rates were negatively correlated with FST (r2=0.14, Pearson correlation coefficient test, P-value <2.2e−16, Supplementary Fig. S6) and, more specifically, that speciation islands were associated with a dramatic reduction in recombination rates in all species pairs (Fig. 4, genome-wide median 0.40 cM per MB, compared to 0.08 cM per MB for speciation islands, Wilcoxon rank sum test, P-value <2.2e−16).

Median recombination rates calculated genome wide and solely for islands of divergence (error bars: 95% confidence interval of the median) for each species pair.
In addition, genes involved in adaptation can have similar regulatory requirements and selection may operate on gene order by favouring the sharing of regulatory machinery (through rearrangements or tandem duplication)27. As subsequent divergence would tend to occur near these co-expression clusters, this could provide another explanation for the formation of islands with and without gene flow. As previously observed in other eukaryote species27, we identified several regions on Helianthus chromosomes where the expression of neighbouring genes was significantly more positively correlated than average correlations among gene expression across the genome (Supplementary Fig. S7). Then, substantiating the argument that genes involved in adaptation have similar regulatory requirements, we found significantly higher rates of co-occurrence of regions of co-expression with islands of genomic divergence in all four population comparisons, with increases between 25.6 and 33.4% over expectations based on independent rates of occurrence (chi-square test, P-value <<0.001; Supplementary Table S4). However, given the small rates of occurrence involved, these represent modest effect sizes with less than 0.5% of the variation (r2=0.0006–0.0037) in FST being explained by degree of co-expression among genes in the surrounding neighbourhood (Supplementary Table S4).
Discussion
Our results, along with a growing number of genomic studies of speciation, support the view that even for species still exchanging genes, divergence is typically maintained in numerous independent genomic regions28,29,30,31, rather than in a few large islands of divergence. While there are reports of simpler genetic architectures of divergence, at least in some instances (especially early studies), scan resolution appears to have been too low to detect smaller islands of divergence (for example, Hahn et al.32).
Surprisingly, interspecific gene flow does not appear to significantly affect the clustering of divergent loci in wild sunflower species, at least at the resolution scale measured here. This result accords well with ‘genomic hitchhiking’ models, in which divergent selection reduces the average effective migration rate globally across the genome, and the degree of clustering of divergent loci is not expected to differ significantly from species that diverged in allopatry4.
Our conclusions come with several caveats. First, divergence hitchhiking may only be relevant to taxa that initially diverged in sympatry and maintained contact throughout the speciation process (primary contact) versus those that initially diverged in geographic isolation and then re-established contact and gene flow (secondary contact). However, when species have been exchanging genes throughout much of their history of divergence (as it is the case at least for H. annuus and H. petiolaris), there has been ample opportunity to unlink neutral genomic regions from regions that contribute to reproductive isolation. As such, there should be little difference between primary and secondary contact33. Nonetheless, the effects of primary versus secondary contact on patterns of genomic divergence need to be further explored theoretically. Also, unambiguous examples of sympatric speciation are rare34 and most cases of divergence with gene flow discussed in the literature involve a phase of allopatry. Thus, the scenarios of divergence with gene flow presented here are highly relevant to patterns typically observed in nature as opposed to ‘pure’ cases of sympatric speciation, which may be rare.
A second caveat is that the sympatric sunflower species studied here have large subdivided geographic distributions, which might limit the efficacy of divergence hitchhiking. Thus, we cannot rule out the possibility that larger islands of divergence might be found in local contact zones in sunflower or in sympatric taxa experiencing conditions more favourable for divergence hitchhiking35.
Third, it is difficult to find highly replicated examples of sympatric, parapatric and allopatric species pairs that also share similar divergence times and natural histories. In the current study, we lack replication of the different geographical contexts of speciation (allopatry, parapatry and sympatry). However, we do provide replication in terms of the key biological process (interspecific gene flow), with two high gene flow transcriptome scans and two without contemporary gene flow.
Another limitation of our approach may stem from restricting our analyses to the transcribed fraction of the sunflower genome; different patterns could be observed in the non-transcribed fraction of the genome. Fortunately, this does not appear to be the case based on preliminary comparisons of restriction site-associated DNA sequences (that is, RAD tags) from the same species36.
Lastly, patterns of polymorphism and divergence across species can be influenced by effective population size, as well as interspecific gene flow. In small populations, the efficacy of positive selection is reduced, which may lead to the smaller effect of selection on protein coding evolution (alpha) we observed (Table 2). H. annuus and H. petiolaris have large effective population sizes (~0.8 million each) that are almost twice that of H. argophyllus (~0.4 million) (37), with H. debilis somewhere in between these extremes17. While effective population size and interspecific alpha estimates are correlated37, that correlation is not perfect. For example, the parapatric (no gene flow) H. debilis–H. argophyllus comparison should have a lower alpha than the allopatric H. petiolaris–H. argophyllus comparison if effective population size were the main cause of variation in alpha, but instead alpha was the same in both comparisons, as predicted based on levels of interspecific gene flow. Most likely, both interspecific gene flow and effective population size contribute to the variation in alpha reported here. However, this does not invalidate our conclusions, but rather implies that current levels of interspecific gene flow are even less important in explaining patterns of genomic divergence reported here.
Although we failed to find evidence of divergence hitchhiking, we identified a strong association between islands of divergence and low recombination rates. This association also implies that the small islands we observe in terms of genetic map distances (cM) could nevertheless be very large with respect to physical distance (1.24 (0.82–2.46) Mb, median and 95% confidence interval). Interestingly, the breakpoints of major chromosomal rearrangements that differentiate these species typically map to areas of low recombination as well, possibly accounting for the weak correlations between genetic divergence and chromosomal breakpoints previously reported20. Reduced recombination can facilitate the formation of islands by reducing the frequency at which interspecific genetic exchange breaks up co-adapted complexes of alleles in these regions, or by extending the effects of directional selection, which reduces diversity at linked neutral sites25. The latter mechanism is likely the main proximate cause of speciation islands in sunflowers, as it can occur in the absence of gene flow, whereas the former mechanism is not expected during allopatric divergence.
Alternatively, if the architecture of the genome evolves through intermittent periods of adaptation with gene flow over millions of generations, clusters of locally adaptive loci could evolve through genomic rearrangements and give rise to islands of allelic divergence, even in currently allopatric populations38,39. We also found a weak significant correlation between the formation of genomic islands and an excess of co-expressed genes. While we suspect that this pattern is a by-product of the reduced recombination rates in genomic islands, we cannot rule out the possibility that clustering of locally adapted genes with similar regulatory needs has been favoured by natural selection.
In conclusion, our work lays the ground for further studies quantifying the effects of ecological, biogeographic and genomic parameters on the architecture of genomic divergence in a more comprehensive and predictive framework. Our results cast doubt on the importance of divergence hitchhiking as a mechanism for generating islands of speciation. Instead they support a model in which the functional architecture of the genome, especially variation in recombination rates, is more predictive of patterns of genomic divergence than is the geographical context of speciation. Further research is required to determine whether observed islands in allopatry form only as a consequence of selection reducing diversity at linked loci, or whether longer-term evolution of genomic architecture also contributes via clustering of adaptive loci. Our results also highlight the need to employ an ‘allopatric control’ when interpreting the effects of interspecific gene flow on patterns of genomic divergence and, more generally, the need for better analytical tools for distinguishing the genomic consequences of different ecological and evolutionary processes.
Methods
Plant collection and transcriptome sequencing
Achenes (single seeded fruits) representing 40 H. annuus, 25 H. petiolaris, 28 H. argophyllus and 14 H. debilis spanning the range of each species were acquired either from USDA collections or from previous sampling efforts (Fig. 1 and Supplementary Table S1). Seeds were germinated at the University of British Columbia and grown for approximately 3 weeks in growth chambers (12 h of daylight at 22°), following which whole plants were harvested, flash frozen in liquid nitrogen and kept at −80°. For some plants, leaf tissue was collected in the field. For each individual, RNA was extracted from young leaf tissues using a modified TRIzol Reagent protocol (Invitrogen, Carlsbad, CA) protocol40. Samples were quantified using NanoDrop (Thermo Fisher Scientific, Waltham, MA) and their quality verified on agarose gels. Total RNA was stored in pure water.
Approximately one-third of the samples were normalized, retrotranscribed and sequenced on the GAII Illumina platform (paired-end sequencing, 2 × 100 bp reads) at the David H. Murdock Research Institute (DHMRI, Kannapolis, NC) or on the Roche 454 FLX platform at the Genome Quebec Innovation Center (McGill University, Montreal, Canada). For normalized libraries, cDNA was amplified and normalized with the TRIMMER-DIRECT cDNA Normalization Kit (Evrogen, Moscow, Russia). For the remaining samples, standard libraries were prepared using the mRNASeq (Illumina, San Diego, CA) approach, which allowed us to analyze both sequence and expression variation. These libraries were sequenced on a GAII (paired-end sequencing, 2 × 100 bp reads) at the Genome Sciences Centre (Vancouver, Canada). All individual libraries were either uniquely barcoded or ran on a separate plate.
For each transcriptome, raw sequencing files (fastq Illumina files and fasta/fasta.qual 454 files) were aligned against the reference transcriptome (see Supplementary Methods) using the Burrows-Wheeler Aligner (BWA, ALN and SAMPE commands for Illumina reads and BWASW for 454 reads)41. SAMTOOLS (MPILEUP and BCFTOOLS)42 was used to call SNPs using information from all samples. Genotypes with Phred-scaled genotype likelihoods below 30 were considered as missing, which corresponds to a genotyping accuracy of at least 99.9%. Following this first round of SNP calling, 3,133,503 polymorphic sites were retained for further analyses.
As relationships among populations may not conform to a tree-like pattern due to potential gene flow and shared ancestral polymorphisms, we performed a phylogeographic analysis using the Neighbor-net method43 implemented in SPLITSTREE4 (44). We compiled an artificial nucleotide sequence comprising 10,000 randomly chosen high-quality (overall missing data <10%) SNPs coded according to the International Union of Pure and Applied Chemistry (IUPAC) nucleotide code. We used default parameters (uncorrected_P distance as metric, ambiguous states ignored and normalize option accounting for unequal distribution of missing data across individuals) to draw the phylogenetic network (Supplementary Fig. S2).
Based on this preliminary analysis, four individuals were removed prior to further analyses. Helianthus debilis individual btm15-2 is likely an early-generation hybrid (Supplementary Fig. S2). H. petiolaris individual PI586932 yielded less than a third of the number of reads compared with the overall average number of the reads. These reads were also of lower quality and therefore it was necessary to discard them (see also Renaut et al.45). H. argophyllus individual ARG1820.white clustered with H. annuus and thus likely represents a mislabelled sample (Supplementary Fig. S2). Finally, H. petiolaris individual PL109.white was removed because two individuals from the same location had been inadvertently sequenced.
At this point, SNPs were then parsed into separate files for each species and questionable SNPs were removed due to poor-quality sequence, low coverage, potential sequencing errors and paralogy. Interspecific comparisons varied in terms of the number of individuals available per comparison and the sequence depth per individual. Therefore, we used different missing data thresholds so that the number of genotypes per comparison could be held roughly constant and sampling biases could be avoided. We filtered out SNPs with low expected heterozygosity (He<0.2) given that they represent either sequencing errors (unless very high coverage was attained) or rare alleles with little information content for interspecific comparisons. We also filtered out SNPs with very high observed heterozygosity (Ho>0.6) because they likely represent paralogous sequence variants. Nevertheless, our final data set likely contains a small fraction of false positives due to alignment and/or sequencing errors. Yet, given the large amount of data, high overall coverage, strict quality threshold cut-offs and visual inspection of random subsets of alignments (several tens of kilobases), we expect the data to be more than sufficient for the genome-wide analysis conducted here. From this curated data set, FST values (according to Weir46) were calculated for each marker and each species pair, using the package HIERFSTAT (47) in the programming language R48.
Protein coding evolution
For analyses of protein evolution, open reading frames (ORFs) were identified from our reference transcriptome using the program GETORF in EMBOSS (European Molecular Biology Open Software Suite)49. The longest open-ended ORF (minimum length of 300 nucleotides) was kept as the most probable translated region of the gene. SNPs within these ORFs were considered as coding sites and differences were classified as synonymous or non-synonymous. This approach (as compared to the BLASTX approach) has the advantage of identifying genes that have no detectable homolog present in public databases. Such orphan genes are potentially rare, but may play an important role in generating species-specific evolutionary novelties50. To verify the accuracy of our approach, we visually inspected 50 random ORFs recognized by our approach versus ORFs identified from BLASTX against the NCBI nr database. In 48 out of 50 cases, the ORFs identified corresponded to the same open reading frame identified by BLASTX. The last two sequences had different ORFs, but high e-values against the NCBI nr database, therefore implying that the BLAST hits were poorly supported. This suggests that our approach recognizes conserved ORFs, as well as being more likely to identify new unique translated regions.
To identify the proportion of differences fixed by positive selection, we calculated the average proportion of amino-acid substitutions driven by positive selection (alpha), using equation (3) in Smith and Eyre-Walker22.
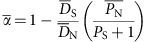
where all averages are across genes and PS, DS, PN and DN are the number of synonymous polymorphisms, synonymous substitutions, non-synonymous polymorphisms and non-synonymous substitutions, respectively. Confidence intervals of alpha were obtained through bootstraps (1,000 bootstraps) by randomly selecting genes with replacement as described in Smith and Eyre-Walker22. In this case, substitutions (D) were considered as SNPs in the top three percentile of the FST distribution and polymorphisms, the bottom 97 percentile. We also conducted these analyses using the top one and top five percentile or completely fixed sites (FST=1) as our criteria for substitutions and levels of alpha were similar (Supplementary Table S2).
Genomic clustering of SNPs
Next, we used BLASTN to position nearly half of all transcriptome contigs (24,406) onto 3,047 unique genomic map locations (see Supplementary Methods for a detailed description of how the genomic map was assembled) covering all 17 H. annuus chromosomes (Supplementary Fig. S5). We then assessed the genomic distribution of SNPs in the top three percentile of the distribution of FST values. This approach provided a straightforward means of categorizing highly divergent markers (top three percentile) and, more importantly, avoided a statistical power bias, which would be unavoidable with a fixed threshold. We also explored the genomic distribution of SNPs in the top one and five percentile of the distribution of FST values, as well as the genomic distribution of regions with mean FST significantly greater than the genome-wide average. Sliding window analyses were carried out to minimize noise from individual site-based divergence estimates. We explored window sizes of 1 and 2 cM to identify genomic regions containing more divergent SNPs than expected based on the whole-genome proportion.
For each window, we calculated the number of markers in the top three percentile, as well as the total number of markers. To assess significance, we randomly sampled with replacement from across the genome the same number of markers and calculated the proportion of top three percentile markers over the total for the re-sampled data set. For computational efficiency, in each region, we started with 1,000 replicates and for each region where more than 900 values exceeded the randomized values, we augmented the number of replications to 100,000 in order to provide better accuracy in the tail of the distribution. Essentially, this bootstrap approach provides a null distribution of expected values for each genomic region, accounting for the number of sites. Significance (P) values given in the text and tables represent proportions of these bootstrap distributions exceeding the calculated value.
While the sliding window approach permits the detection of highly significant regions of divergence, it may fail to detect smaller clusters. Therefore, we also assessed the overall clustering of loci across the genome using spatial autocorrelations statistics51. Observed and expected joint count statistics and z scores were calculated for outlier loci (top three percentile) across different size classes (0–0.1, 0.1–1, 1–3, 3–5 and 5–10 cM), for each chromosome and interspecific comparison separately.
Additional information
Accession codes: Coordinates for the transcriptome data have been deposited at NCBI. Sequence Read Archive (SRA) under the accession codes SRX264548 to SRX264569, SRX264812 to SRX264817, SRX264824 to SRX264825, SRX264836 to SRX264912.
How to cite this article: Renaut, S. et al. Genomic islands of divergence are not affected by geography of speciation in sunflowers. Nat. Commun. 4:1827 doi: 10.1038/ncomms2833 (2013).
References
Wu, C. The genic view of the process of speciation. J. Evol. Biol. 14, 851–865 (2001).
Turner, T. L., Hahn, M. W. & Nuzhdin, S. V. Genomic islands of speciation in Anopheles gambiae. PLoS Biol. 3, e285 (2005).
Nosil, P., Funk, D. J. & Ortiz-Barrientos, D. Divergent selection and heterogeneous genomic divergence. Mol. Ecol. 18, 375–402 (2009).
Feder, J., Egan, S. & Nosil, P. The genomics of speciation-with-gene-flow. Trends Genet. 28, 342–350 (2012).
Via, S. Natural selection in action during speciation. Proc. Natl Acad. Sci. USA 106, 9939–9946 (2009).
Feder, J. L. & Nosil, P. The efficacy of divergence hitchhiking in generating genomic islands during ecological speciation. Evolution 64, 1729–1747 (2010).
Barton, N. H. N. & Hewitt, G. M. G. Adaptation, speciation and hybrid zones. Nature 341, 497–503 (1989).
Renaut, S. et al. Genome-wide patterns of divergence during speciation: the lake whitefish case study. Phil. Trans. R. Soc. B 367, 354–363 (2012).
Hohenlohe, P. A. P., Bassham, S. S., Currey, M. M. & Cresko, W. A. W. Extensive linkage disequilibrium and parallel adaptive divergence across threespine stickleback genomes. Phil. Trans. R. Soc. B 367, 395–408 (2012).
Rogers, C., Thompson, T. & Seiler, G. J. Sunflower Species of the United States National Sunflower Association (1982).
Gross, B. L. B., Schwarzbach, A. E. A. & Rieseberg, L. H. L. Origin(s) of the diploid hybrid species Helianthus deserticola (Asteraceae). Am. J. Bot. 90, 1708–1719 (2003).
Strasburg, J. L. & Rieseberg, L. H. Molecular demographic history of the annual sunflowers Helianthus annuus and H. petiolaris-large effective population sizes and rates of long-term gene flow. Evolution 62, 1936–1950 (2008).
Rieseberg, L., Whitton, J. & Gardner, K. Hybrid zones and the genetic architecture of a barrier to gene flow between two sunflower species. Genetics 152, 713–727 (1999).
Sambatti, J., Strasburg, J. L., Ortiz-Barrientos, D., Baack, E. J. & Rieseberg, L. H. Reconciling extremely strong barriers with high levels of gene exchange in annual sunflowers. Evolution 66, 1459–1473 (2012).
Morjan, C. & Rieseberg, L. How species evolve collectively: implications of gene flow and selection for the spread of advantageous alleles. Mol. Ecol. 13, 1341–1356 (2004).
Heiser, C. B. Biosystematics of Helianthus debilis. Madrono 37, 145–176 (1956).
Scascitelli, M. et al. Genome scan of hybridizing sunflowers from Texas (Helianthus annuus and H. debilis) reveals asymmetric patterns of introgression and small islands of genomic differentiation. Mol. Ecol. 19, 521–541 (2010).
Whitney, K. D., Randell, R. A. & Rieseberg, L. H. Adaptive introgression of herbivore resistance traits in the weedy sunflower Helianthus annuus. Am. Nat. 167, 794–807 (2006).
Heiser, C. B., Smith, D. M., Clevenger, S. B. & Martin, W. C. The North American sunflowers (Helianthus). Mem. Torrey Bot. Club 22, 218 (1969).
Strasburg, J. L., Scotti-Saintagne, C., Scotti, I., Lai, Z. & Rieseberg, L. H. Genomic patterns of adaptive divergence between chromosomally differentiated sunflower species. Mol. Biol. Evol. 26, 1341–1355 (2009).
Chandler, J. M., Jan, C. C. & Beard, B. H. Chromosomal differentiation among the annual Helianthus species. Sys. Bot. 11, 354–371 (1986).
Smith, N. G. C. & Eyre-Walker, A. Adaptive protein evolution in Drosophila. Nature 415, 1022–1024 (2002).
Kane, N. et al. Progress towards a reference genome for sunflower. Botany 89, 429–437 (2011).
Wu, Y., Bhat, P. R., Close, T. J. & Lonardi, S. Efficient and accurate construction of genetic linkage maps from the minimum spanning tree of a graph. PLoS Genet. 4, e1000212 (2008).
Nachman, M. W. & Payseur, B. A. Recombination rate variation and speciation: theoretical predictions and empirical results from rabbits and mice. Phil. Trans. R. Soc. B 367, 409–421 (2012).
Kane, N. C., Barker, M. S., Zhan, S. H. & Rieseberg, L. H. Molecular evolution across the Asteraceae: micro- and macroevolutionary processes. Mol. Biol. Evol. 28, 3225–3235 (2011).
Hurst, L. D., Pal, C. & Lercher, M. J. The evolutionary dynamics of eukaryotic gene order. Nat. Rev. Genet. 5, 299–310 (2004).
Lawniczak, M. K. N. et al. Widespread divergence between incipient Anopheles gambiae species revealed by whole genome sequences. Science 330, 512–514 (2010).
Michel, A. P. et al. Widespread genomic divergence during sympatric speciation. Proc. Natl Acad. Sci. USA 107, 9724–9729 (2010).
Jones, F. C. et al. The genomic basis of adaptive evolution in threespine sticklebacks. Nature 484, 55–61 (2012).
Parchman, T. L. et al. The genomic consequences of adaptive divergence and reproductive isolation between species of manakins. Mol. Ecol (e-pub ahead of print 26 February 2013; doi:10.1111/mec.12201) (2013).
Hahn, M. W., White, B. J., Muir, C. D. & Besansky, N. J. No evidence for biased co-transmission of speciation islands in Anopheles gambiae. Phil. Trans. R. Soc. B 367, 374–384 (2012).
Barton, N. H. & Hewitt, G. M. Analysis of hybrid zones. Annu. Rev. Ecol. Syst. 16, 113–148 (1985).
Coyne, J. & Orr, H. A. Speciation Sunderland (2004).
Nadeau, N. J. et al. Genomic islands of divergence in hybridizing Heliconius butterflies identified by large-scale targeted sequencing. Phil. Trans. R. Soc. B 367, 343–353 (2012).
Andrew, R. L. & Rieseberg, L. Divergence is focused on few genomic regions early in speciation: incipient speciation of sunflower ecotypes. Evolution (doi:10.1111/evo.12106) (2013).
Strasburg, J. L. J. et al. Effective population size is positively correlated with levels of adaptive divergence among annual sunflowers. Mol. Biol. Evol. 28, 1569–1580 (2011).
Yeaman, S. & Whitlock, M. C. The genetic architecture of adaptation under migration-selection balance. Evolution 65, 1897–1911 (2011).
Yeaman, S. Genomic rearrangements and the evolution of clusters of locally adaptive loci. Proc. Natl Acad. Sci. USA (doi:10.1073/pnas.1219381110) (2013).
Lai, Z. et al. Genomics of Compositae weeds: EST libraries, microarrays, and evidence of introgression. Am. J. Bot. 99, 209–218 (2012).
Li, H. & Durbin, R. Fast and accurate short read alignment with Burrows-Wheeler transform. Bioinformatics 25, 1754–1760 (2009).
Li, H. et al. The sequence alignment/map format and SAMtools. Bioinformatics 25, 2078–2079 (2009).
Bryant, D. Neighbor-Net: an agglomerative method for the construction of phylogenetic networks. Mol. Biol. Evol. 21, 255–265 (2003).
Huson, D. H. Application of phylogenetic networks in evolutionary studies. Mol. Biol. Evol. 23, 254–267 (2005).
Renaut, S., Grassa, C., Moyers, B., Kane, N. & Rieseberg, L. The population genomics of sunflowers and genomic determinants of protein evolution revealed by RNAseq. Biology 1, 575–596 (2012).
Weir, B. Genetic Data Analysis II Sinauer (1996).
Goudet, J. HIERFSTAT, a package for R to compute and test hierarchical F-statistics. Mol. Ecol. 5, 184–186 (2005).
R Core Team. R: A Language and Environment for Statistical Computing R Foundation for Statistical Computing (2012).
Rice, P., Longden, I. & Bleasby, A. EMBOSS: the European molecular biology open software suite. Trends Genet. 16, 276–277 (2000).
Khalturin, K., Hemmrich, G., Fraune, S. & Augustin, R. More than just orphans: are taxonomically-restricted genes important in evolution? Trends Genet. 25, 404–413 (2009).
Bivand, R., Pebesma, E. & Gomez-Rubio, V. Applied Spatial Data Analysis with R Springer (2008).
Timme, R. E., Simpson, B. B. & Linder, C. R. High-resolution phylogeny for Helianthus (Asteraceae) using the 18S-26S ribosomal DNA external transcribed spacer. Am. J. Bot. 94, 1837–1852 (2007).
Acknowledgements
We thank Rose Andrew, Aneil Agrawal, Mike Whitlock and Sally Otto for critical discussions of the data. We also thank M. King, H. Rowe, M. Scascitelli and M. Stewart for contributing samples and performing lab work. This work was supported by funding from the NSF Plant Genome Research Program (DBI-0820451), Genome Canada, Genome BC, and a postdoctoral scholarship from the Natural Sciences and Engineering Council of Canada to S.R. S.Y. was funded by a Genome Canada/BC grant to AdapTree. The authors wish to acknowledge the sequencing platform (454) of the Genome Quebec Innovation Centre.
Author information
Authors and Affiliations
Contributions
S.R., C.J.G., S.Y. and J.E.B. analysed the data. S.R., L.H.R. and J.M.B. designed the study. S.R. and L.H.R. wrote the manuscript. S.R., B.T.M., N.C.K. and Z.L. gathered the data.
Corresponding author
Ethics declarations
Competing interests
The authors declare no competing financial interests.
Supplementary information
Supplementary Information
Supplementary Figures S1-S7, Supplementary Tables S1-S4, Supplementary Methods and Supplementary References (PDF 1303 kb)
Rights and permissions
About this article
Cite this article
Renaut, S., Grassa, C., Yeaman, S. et al. Genomic islands of divergence are not affected by geography of speciation in sunflowers. Nat Commun 4, 1827 (2013). https://doi.org/10.1038/ncomms2833
Received:
Accepted:
Published:
DOI: https://doi.org/10.1038/ncomms2833
This article is cited by
-
Physical geography, isolation by distance and environmental variables shape genomic variation of wild barley (Hordeum vulgare L. ssp. spontaneum) in the Southern Levant
Heredity (2022)
-
Recent introgression between Taiga Bean Goose and Tundra Bean Goose results in a largely homogeneous landscape of genetic differentiation
Heredity (2020)
-
Resequencing 93 accessions of coffee unveils independent and parallel selection during Coffea species divergence
Plant Molecular Biology (2020)
-
Ancient polymorphisms contribute to genome-wide variation by long-term balancing selection and divergent sorting in Boechera stricta
Genome Biology (2019)
-
Lessons on Evolution from the Study of Edaphic Specialization
The Botanical Review (2018)
Comments
By submitting a comment you agree to abide by our Terms and Community Guidelines. If you find something abusive or that does not comply with our terms or guidelines please flag it as inappropriate.
