
Abstract
Kennewick Man, referred to as the Ancient One by Native Americans, is a male human skeleton discovered in Washington state (USA) in 1996 and initially radiocarbon dated to 8,340–9,200 calibrated years before present (bp)1. His population affinities have been the subject of scientific debate and legal controversy. Based on an initial study of cranial morphology it was asserted that Kennewick Man was neither Native American nor closely related to the claimant Plateau tribes of the Pacific Northwest, who claimed ancestral relationship and requested repatriation under the Native American Graves Protection and Repatriation Act (NAGPRA). The morphological analysis was important to judicial decisions that Kennewick Man was not Native American and that therefore NAGPRA did not apply. Instead of repatriation, additional studies of the remains were permitted2. Subsequent craniometric analysis affirmed Kennewick Man to be more closely related to circumpacific groups such as the Ainu and Polynesians than he is to modern Native Americans2. In order to resolve Kennewick Man’s ancestry and affiliations, we have sequenced his genome to ∼1× coverage and compared it to worldwide genomic data including for the Ainu and Polynesians. We find that Kennewick Man is closer to modern Native Americans than to any other population worldwide. Among the Native American groups for whom genome-wide data are available for comparison, several seem to be descended from a population closely related to that of Kennewick Man, including the Confederated Tribes of the Colville Reservation (Colville), one of the five tribes claiming Kennewick Man. We revisit the cranial analyses and find that, as opposed to genome-wide comparisons, it is not possible on that basis to affiliate Kennewick Man to specific contemporary groups. We therefore conclude based on genetic comparisons that Kennewick Man shows continuity with Native North Americans over at least the last eight millennia.
Main
The skeleton of Kennewick Man was inadvertently discovered in July of 1996 in shallow water along the Columbia River shoreline outside Kennewick, Washington state, USA. On several visits to the locality over the following month, some 300 bone elements and fragments were collected, ultimately comprising ∼90% of an adult male human skeleton3. The initial assessment of this individual was that he was a historic-period Euro-American, based largely on his apparently “Caucasoid-like”3 cranium, along with a few artefacts found nearby (later proved not to be associated with the skeletal remains). However, radiocarbon dating subsequently put the age of the skeleton in the Early Holocene1. The claim that Kennewick Man was anatomically distinct from modern Native Americans in general, and in particular from those tribes inhabiting northwest North America4, sparked a legal battle over the disposition of the skeletal remains. Five tribes who inhabit that region requested the remains be returned to them for reburial under the Native American Graves Protection and Repatriation Act (NAGPRA). The US Army Corps of Engineers, which manages the land where Kennewick Man was found, announced their intent to do so. That in turn prompted a lawsuit to block the repatriation2,5, and generated considerable scientific controversy as to Kennewick Man’s ancestry and affinities (for example, refs 3, 6, 7, 8, 9). The lawsuit ultimately (in 2004) resulted in a judicial ruling in favour of a detailed study of the skeletal remains, the results of which were recently published2.
These studies provide important details on, for example, Kennewick Man’s life history, refine his antiquity to 8,358 ± 21 14C years bp or to within a two sigma range of 8,400–8,690 calibrated years bp (based on 90% marine diet, and 750 year marine reservoir correction), and demonstrate that the body had been intentionally buried and had eroded out shortly before discovery2. They also include anatomical and morphometric analyses, which confirm earlier studies that Kennewick Man resembles circumpacific populations, particularly the Ainu and Polynesians2,10; that he has certain “European-like morphological” traits2; and that he is anatomically distinct from modern Native Americans2. These results are interpreted as indicating that Kennewick Man was a descendant of a population that migrated earlier than, and independently of, the population(s) that gave rise to modern Native Americans2.
However, those recent studies did not include DNA analysis. Herein we present the genome sequence of Kennewick Man in order to resolve his ancestry and affinities with modern Native Americans. There were several prior efforts to recover genetic material from Kennewick Man11, but none were successful.
We obtained ∼1 × coverage of the genome, from 200 mg of metacarpal bone specimen (Supplementary Information 1) using previously published methods12,13. The endogenous DNA content was between 0.4% and 1.4% for double-stranded and single-stranded libraries, respectively (Supplementary Information 2). Average fragment length was 53.6 base pairs (bp) and the sample exhibited damage patterns typical of ancient DNA, with excessive deamination of cytosine towards the ends of the fragments (Supplementary Information 2). Similarly, patterns of DNA decay agree with published expectations14, and display an estimated molecular half-life corresponding to 3,670 years for 100-bp molecules (Supplementary Information 3). The mitochondrial genome was sequenced to ∼71× coverage and is placed at the root of haplogroup X2a (Extended Data Fig. 1 and Supplementary Information 2), and the Y-chromosome haplogroup is Q-M3 (Extended Data Fig. 2 and Supplementary Information 5); both uniparental lineages are found almost exclusively among contemporary Native Americans15,16. We used the X chromosome to conservatively estimate contamination to be 2.5%, which is within the normal range obtained observed in genomic data from ancient human remains17, and we further show this contamination to be of European origin (Supplementary Information 4).
We compiled an autosomal reference data set consisting of published SNP array data18,19,20,21,22,23 as well as new data generated from one of the claimant tribes, the Colville (Supplementary Information 10). Due to high levels of recent admixture in many Native American populations, we masked European ancestry from the Native Americans (Supplementary Information 6). No masking was done on the Kennewick Man. When we compare Kennewick Man with the worldwide panel of populations, a clear genetic similarity to Native Americans is observed both in principal components analysis (PCA) and using f3-outgroup statistics (Fig. 1a, b). In particular, we can reject the hypothesis that Kennewick Man is more closely related to Ainu or Polynesians than he is to Native Americans, as seen in a D-statistic-based test where no trees of the type ((CHB,Ainu/Polynesian),(X,Karitiana)) with X being Kennewick Man, the Clovis age Anzick-1 child (ref. 12) or a modern Native American genome are rejected (Extended Data Fig. 3). Model-based clustering using ADMIXTURE24 shows that Kennewick Man has ancestry proportions most similar to those of other Northern Native Americans (Fig. 1c and Supplementary Information 7), especially the Colville, Ojibwa, and Algonquin. Considering the Americas only, f3-outgroup and D-statistic based analyses show that Kennewick Man, like the Anzick-1 child, shares a high degree of ancestry with Native Americans from Central and South America, and that Kennewick Man also groups with geographically close tribes including the Colville (Fig. 2a, b and Extended Data Fig. 4). Despite this similarity, Anzick-1 and Kennewick Man have dissimilar genetic affinities to contemporary Native Americans. In particular, we find that Anzick-1 is more closely related to Central/Southern Native Americans than is Kennewick Man (Extended Data Fig. 5). The pattern observed in Kennewick Man is mirrored in the Colville, who also show a high affinity with Southern populations (Fig. 2c), but are most closely related to a neighbouring population in the data set (Stswecem’c; Extended Data Fig. 4c). This is in contrast to other populations such as the Chipewyan, who are more closely related to Northern Native Americans rather than to Central/Southern Native Americans in all comparisons (Fig. 2d and Extended Data Fig. 4d).
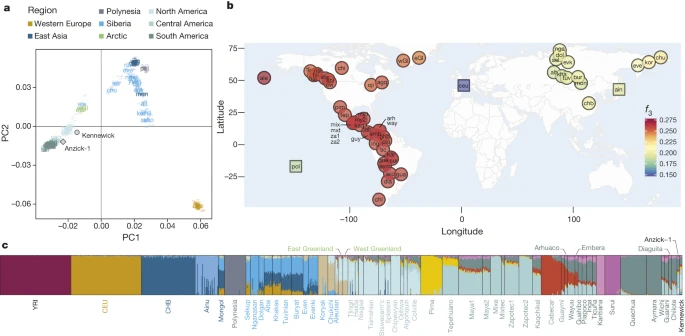
a, Principal components analysis (PCA) projecting Kennewick Man and Anzick-1 onto a set of out-of-Africa populations. b, Heat map of f3-outgroup statistics between Kennewick Man, Native Americans, Siberians and additional populations with suggested relationship to Kennewick Man (in squares). Warmer colours indicate higher allele sharing. For list of population labels, see the Methods section. c, Admixture proportions for worldwide set of population, including masked Native American, Anzick-1 and Kennewick, shown at K = 14.
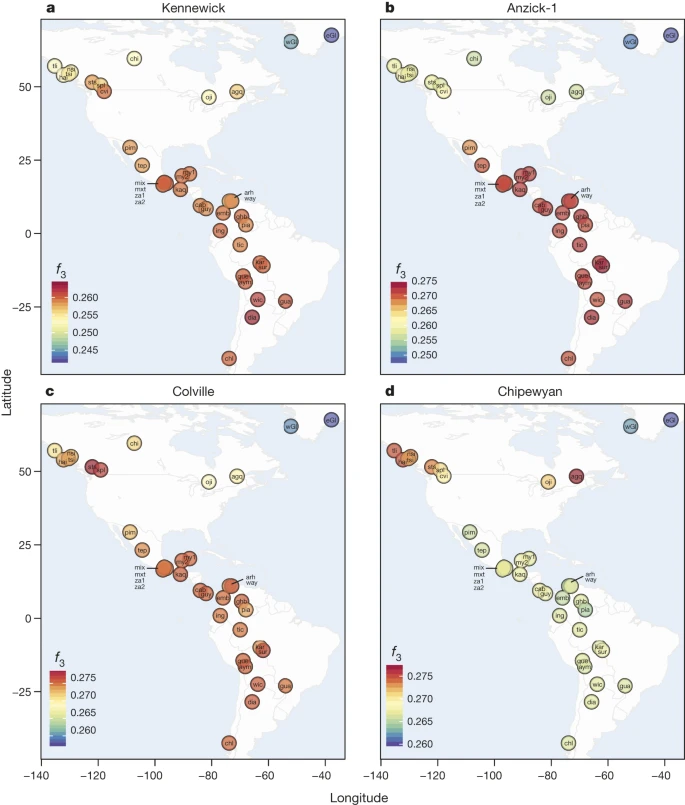
a–d, Heat maps of f3-outgroup statistics testing (YRI; Native Americans, X), where X is Kennewick Man (a), Anzick-1 (b), Colville (c) or Chipewyan (d). Warmer colours indicate higher allele sharing, for list of population labels, see the Methods section.
Our results are in agreement with a basal divergence of Northern and Central/Southern Native American lineages as suggested from the analysis of the Anzick-1 genome12. However, the genetic affinities of Kennewick Man reveal additional complexity in the population history of the Northern lineage. The finding that Kennewick is more closely related to Southern than many Northern Native Americans (Extended Data Fig. 4) suggests the presence of an additional Northern lineage that diverged from the common ancestral population of Anzick-1 and Southern Native Americans (Fig. 3). This branch would include both Colville and other tribes of the Pacific Northwest such as the Stswecem’c, who also appear symmetric to Kennewick with Southern Native Americans (Extended Data Fig. 4). We also find evidence for additional gene flow into the Pacific Northwest related to Asian populations (Extended Data Fig. 5), which is likely to post-date Kennewick Man. We note that this gene flow could originate from within the Americas, for example in association with the migration of paleo-Eskimos or Inuit ancestors within the past 5,000 years25, or the gene flow could be post-colonial19.
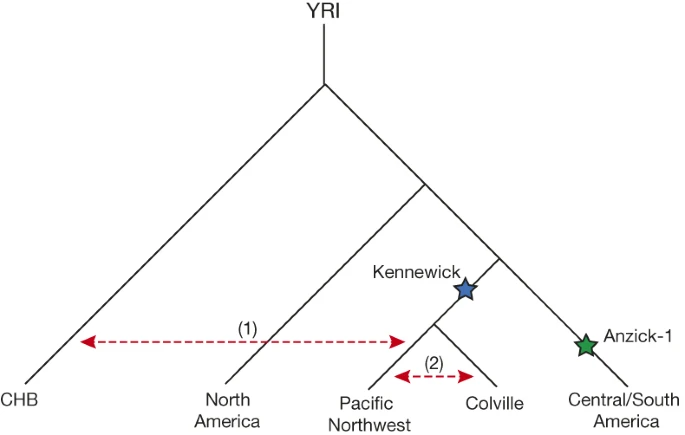
Depicted is a population tree consistent with the broad affinities between modern and ancient Native Americans. Kennewick Man and the Anzick-1 child are indicated with blue and green stars respectively. Red dashed arrows indicate gene flow (1) of Asian-related ancestry with tribes of the Pacific Northwest and (2) between Colville and neighbouring tribes.
We used a likelihood ratio test to test for direct ancestry of Kennewick Man for two members of the Colville tribe who show no evidence of recent European admixture. This test allows us to determine if the patterns of allele frequencies in the Colville and Kennewick Man are compatible with direct ancestry of the Colville from the population to which Kennewick Man belonged, without any additional gene flow. As a comparison we also included analyses of four other Native Americans with high quality genomes: two Northern Athabascan individuals from Canada25 and two Karitiana individuals from Brazil12,13. Although the test rejects the null hypothesis of direct ancestry with no subsequent gene flow in all cases, it only does so very weakly for the Colville tribe members (Table 1 and Supplementary Information 8). These findings can be explained as: (1) the Colville individuals are direct descendants of the population to which Kennewick Man belonged, but subsequently received some relatively minor gene flow from other American populations within the last ∼8,500 years, in agreement with our findings above; (2) the Colville individuals descend from a population that ∼8,500 years was slightly diverged from the population which Kennewick Man belonged or (3) a combination of both.
It has been asserted that “…cranial morphology provides as much insight into population structure and affinity as genetic data”2. However, although recent and previous craniometric analyses have consistently concluded that Kennewick Man is unlike modern Native Americans, they disagree regarding his closest population affinities, the cause of the apparent differences between Kennewick Man and modern Native Americans, and whether the differences are historically important (for example, represent an earlier, separate migration to the Americas), or simply represent intra-population variation2,3,7,10,26,27,28. These inconsistencies are probably owing to the difficulties in assigning a single individual when comparing to population-mean data, without explicitly taking into account within-population variation. Reanalysis of W. W. Howells’ worldwide modern human craniometric data set29 (Supplementary Information 9) shows that biological population affinities of individual specimens cannot be resolved with any statistical certainty. Although our individual-based craniometric analyses confirm that Kennewick Man tends to be more similar to Polynesian and Ainu peoples than to Native Americans, Kennewick Man’s pattern of craniometric affinity falls well within the range of affinity patterns evaluated for individual Native Americans (Supplementary Information 9). For example, the Arikara from North Dakota (the Native American tribe representing the geographically closest population in Howells’ data set to Kennewick), exhibit with high frequency closest affinities with Polynesians (Supplementary Information 9). Yet, the Arikara have typical Native-American mitochondrial DNA haplogroups30, as does Kennewick Man. We conclude that the currently available number of independent phenetic markers is too small, and within-population craniometric variation too large, to permit reliable reconstruction of the biological population affinities of Kennewick Man.
In contrast, block bootstrap results from the autosomal DNA data are highly statistically significant (Extended Data Fig. 3), showing stronger association of the Kennewick man with Native Americans than with any other continental group. We also observe that the autosomal DNA, mitochondrial DNA and Y chromosome data all consistently show that Kennewick Man is directly related to contemporary Native Americans, and thus show genetic continuity within the Americas over at least the past 8,000 years. Identifying which modern Native American groups are most closely related to Kennewick Man is not possible at this time as our comparative DNA database of modern peoples is limited, particularly for Native-American groups in the United States. However, among the groups for which we have sufficient genomic data, we find that the Colville, one of the Native American groups claiming Kennewick Man as ancestral, show close affinities to that individual or at least to the population to which he belonged. Additional modern descendants could be identified as more Native American groups are sequenced. Finally, it is clear that Kennewick Man differs significantly from the Anzick-1 child who is more closely related to the modern tribes of Mesoamerica and South America12, possibly suggesting an early population structure within the Americas.
Methods
We extracted DNA from a 200-mg bone fragment from Kennewick Man, and built both single and double stranded DNA libraries, which were sequenced on the Illumina HiSeq platform (Supplementary Information sections 1, 2). We performed DNA damage analyses and estimated decay rates to verify authenticity; additionally we estimated contamination on both nuclear and mitochondrial DNA (Supplementary Information sections 2, 3, 4). For the nuclear contamination we developed a model to identify the most likely source population (Supplementary Information section 4). Both mitochondrial and Y-chromosome haplogroup were determined (Supplementary Information sections 2 and 5). To resolve the ancestry of Kennewick Man, we performed PCA, outgroup f3- and D-statistics, as well as ADMIXTURE analyses on a panel of published SNP array data that was collected and curated from worldwide populations with suggested relationship to Kennewick Man (Supplementary Information sections 6 and 7), in addition to data generated from members of the Colville Tribe (Supplementary Information section 1). Individual and tribal consent was obtained for all study participants, and the National Committee on Health Research Ethics in Denmark had no comments on the design (H-3-2012-FSP21). We tested if Kennewick Man belonged to a population ancestral to the Colville Tribe and estimated their divergence time (Supplementary Information section 8). Lastly, we reanalysed the craniometric data for Kennewick Man, and compared it to both individual samples and population mean data (Supplementary Information section 9).
Population labels: agq, Algonquin; ain, Ainu; ale, Aleutian; alt, Altai; arh, Arhuaco; aym, Aymara; bur, Buryat; cab, Cabecar; ceu/CEU, Utah residents with ancestry from northern and western Europe; chb/CHB, Han Chinese in Beijing, China; chi, Chipewyan; chl, Chilote; chu, Chukchi; cvi, Colville; dia, Diaguita; dol, Dolgan; eGl, EastGreenland; emb, Embera; eve, Even; evk, Evenki; ghb, Guahibo; gua, Guarani; guy, Guaymi; hai, Haida; ing, Inga; kaq, Kaqchikel; kar, Karitiana; kha, Khakas; kor, Koryak; mix, Mixe; mon, Mongol; mxt, Mixtec; my1, Maya1; my2, Maya2; nga, Nganasan; nsi, Nisgaa; oji, Ojibwa; pia, Piapoco; pim, Pima; pol, Polynesia; que, Quechua; sel, Selkup; spl, Splatsin; sts, Stswecem'c; sur, Surui; tep, Tepehuano; tic, Ticuna; tli, Tlingit; tsi, Tsimshian; tuv, Tuvinian; wGl, WestGreenland; way, Wayuu; wic, Wichi; yri/YRI, Yoruba in Ibadan, Nigeria; za1, Zapotec1; za2, Zapotec2.
Accession codes
Primary accessions
Sequence Read Archive
Data deposits
The Kennewick Man genome sequence has been deposited in the Sequence Read Archive under accession number SRS937952. The Colville SNP chip data can be used for scientific confirmation of our findings (with regard to the group's direct ancestry to Kennewick Man). It cannot be used for any other purpose. The Colville data in this study are available under data access agreement with E.W. The bam file with mapped data can be downloaded from (http://purl.stanford.edu/bg616nn8691).
References
Taylor, R. E., Kirner, D. L., Southon, J. R. & Chatters, J. C. Radiocarbon dates of Kennewick Man. Science 280, 1171 (1998)
Owsley, D. W. & Jantz, R. L. Kennewick Man (Texas A&M Univ. Press, 2014)
Chatters, J. C. The recovery and first analysis of an Early Holocene human skeleton from Kennewick, Washington. Am. Antiq. 65, 291–316 (2000)
Chatters, J. C. Ancient Encounters (Simon and Schuster, 2001)
Bonnichsen v. United States. 217 F. Supp. 2d 1116 (D. Or. 2002).
Owsley, D. W. & Jantz, R. L. Archaeological politics and public interest in paleoamerican studies: lessons from Gordon Creek Woman and Kennewick Man. Am. Antiq. 66, 565–575 (2001)
Powell, J. F. The First Americans (Cambridge Univ. Press, 2005)
Swedlund, A. & Anderson, D. Gordon Creek Woman meets Kennewick Man: new interpretations and protocols regarding the peopling of the Americas. Am. Antiq. 64, 569–576 (1999)
Thomas, D. H. Skull Wars: Kennewick Man, Archaeology, and the Battle for Native American Identity (Basic Books, 2001)
Steele, D. G. & Powell, J. F. in The First Americans (ed. Jablonski, N. G. ) (Univ. California Press, 2002)
McManamon, F. Kennewick Man. http://www.nps.gov/archeology/kennewick/Index.htm (National Park Service, Washington DC, USA, 2004)
Rasmussen, M. et al. The genome of a Late Pleistocene human from a Clovis burial site in western Montana. Nature 506, 225–229 (2014)
Meyer, M. et al. A high-coverage genome sequence from an archaic Denisovan individual. Science 338, 222–226 (2012)
Allentoft, M. E. et al. The half-life of DNA in bone: measuring decay kinetics in 158 dated fossils. Proc. R. Soc. Lond. B 279, 4724–4733 (2012)
Perego, U. A. et al. The initial peopling of the Americas: a growing number of founding mitochondrial genomes from Beringia. Genome Res. 20, 1174–1179 (2010)
Dulik, M. C. et al. Y-chromosome analysis reveals genetic divergence and new founding native lineages in Athapaskan- and Eskimoan-speaking populations. Proc. Natl Acad. Sci. USA 109, 8471–8476 (2012)
Seguin-Orlando, A. et al. Genomic structure in Europeans dating back at least 36,200 years. Science 346, 1113–1118 (2014)
Reich, D. et al. Reconstructing Native American population history. Nature 488, 370–374 (2012)
Verdu, P. et al. Patterns of admixture and population structure in native populations of northwest North America. PLoS Genet. 10, e1004530 (2014)
Frazer, K. A. et al. A second generation human haplotype map of over 3.1 million SNPs. Nature 449, 851–861 (2007)
Japanese Archipelago Human Population Genetics Consortium . The history of human populations in the Japanese Archipelago inferred from genome-wide SNP data with a special reference to the Ainu and the Ryukyuan populations. J. Hum. Genet. 57, 787–795 (2012)
Wollstein, A. et al. Demographic history of Oceania inferred from genome-wide data. Curr. Biol. 20, 1983–1992 (2010)
Kayser, M. et al. Genome-wide analysis indicates more Asian than Melanesian ancestry of Polynesians. Am. J. Hum. Genet. 82, 194–198 (2008)
Alexander, D. H., Novembre, J. & Lange, K. Fast model-based estimation of ancestry in unrelated individuals. Genome Res. 19, 1655–1664 (2009)
Raghavan, M. et al. The genetic prehistory of the New World Arctic. Science 345, 1255832 (2014)
Brace, C. L. et al. Old World sources of the first New World human inhabitants: a comparative craniofacial view. Proc. Natl Acad. Sci. USA 98, 10017–10022 (2001)
Jantz, R. L. & Owsley, D. W. Variation among early North American crania. Am. J. Phys. Anthropol. 114, 146–155 (2001)
Jantz, R. L. & Owsley, D. W. in Paleoamerican Origins: Beyond Clovis (eds Bonnichsen, R., Lepper, B., Stanford, D. J. & Waters, M. R. ) 267–275 (Texas A & M Univ. Press, 2005)
Howells, W. W. Howells' craniometric data on the internet. Am. J. Phys. Anthropol. 101, 441–442 (1996)
Lawrence, D. M. et al. Mitochondrial DNA of protohistoric remains of an Arikara population from South Dakota: implications for the macro-Siouan language hypothesis. Hum. Biol. 82, 157–178 (2010)
Acknowledgements
We thank the members of the Confederated Tribes of the Colville Reservation who provided their DNA for this study. We would like to also thank Nez Perce Tribe, Umatilla Tribe, Yakama Nation, and Wanapum Band for their consultation. We thank C. B. Pulliam and G. C. Celmer of the US Army Corps of Engineers, and the Burke Museum of the University of Washington, especially L. Phillips. We thank the Danish National Research Foundation and the Lundbeck Foundation for financial support and the Danish National Sequencing Centre for help with sequencing. M.R. was funded by grant 12-131829 from the Danish Council for Independent Research. J.V.M.-M. was supported by 'Consejo Nacional de Ciencia y Tecnología' (Mexico). G.D.P. was supported by the National Science Foundation Graduate Research Fellowship under Grant No. DGE-1147470. I.M. was funded by a DFF-YDUN grant from the Danish Council for Independent Research. C.V. was funded by Marie Curie Intra-European Fellowship-FP7-People-PIEF-GA-2009-255503
Author information
Authors and Affiliations
Contributions
E.W. headed the project. E.W. and T.W.S. initiated the work. D.J.M., R.S.M. and C.V. provided archaeological knowledge and ethical advice. M.R. conducted the laboratory work. M.R., M.S., A.A., T.S.K., J.V.M.-M., G.D.P., M.E.A., I.M., H.J., L.O., C.D.B. and R.N. conducted the DNA analyses. C.P.E.Z. and M.S.P.L. conducted the morphological analyses. E.W., D.J.M. and M.R. wrote the paper with contributions from all the authors.
Corresponding author
Ethics declarations
Competing interests
C.D.B. is a founder of Identify Genomics. He is also on the Scientific Advisory Board (SAB) of Identify, Etalon, Personalis, and Ancestry.com. He is a former MAB member of InVitae. None of these organizations had a role in the design or conduct of the work presented here.
Extended data figures and tables
Extended Data Figure 1 Phylogenetic tree of mitochondrial haplogroup X including Kennewick Man.
A median-joining network of GenBank sequences from haplogroup X was constructed as described in the Supplementary Information. Haplogroup names are indicated by bold dark grey boxes, sequences of Native American origin are in light green background. Back mutations to ancestral state are denoted with an ! symbol. GenBank accession numbers are shown in boxes at branch tips.
Extended Data Figure 2 Y-chromosome haplogroup.
a, Phylogenetic tree including representative sequences of haplogroup P, the clade that includes haplogroups Q and R. Kennewick Man shares ancestry with orange branches. Each branch is labelled with an integer index and, in brackets, the number of SNPs that define it. b, Counts of SNPs from each branch of the tree, stratified by Kennewick Man genotype (ancestral in blue, derived in orange) and mutation type (C→T and G→A transitions coloured more lightly). Branch 19 was omitted to preserve scale; the Kennewick genotype was ancestral at all 145 sites for which read data were available.
Extended Data Figure 3 D-statistic-based test for Ainu and Polynesian affinity to Han Chinese and Native Americans.
Test of the type D((CHB,Ainu/Polynesian),(X,Karitiana)), where X is an Arctic or Native American population, including Kennewick Man and Anzick-1. Values equal to 0, has population X being closer to Karitiana than either CHB or Ainu/Polynesian. Thick and thin whiskers represent 1 and 3 standard errors, respectively.
Extended Data Figure 4 Similarity between Kennewick Man and Anzick-1 as well as Colville.
Test of D((YRI,Kennewick/Anzick-1/Colville/Chipewyan),(X,Karitiana)), to illustrate similarities between Kennewick Man and Anzick-1, and the Colville tribe. Thick and thin whiskers represent 1 and 3 standard errors, respectively.
Extended Data Figure 5 Affinity of Kennewick Man and Anzick-1 to Native American populations.
Test of D((YRI,X),(Kennewick,Anzick-1)) to distinguish different affinities of the ancient samples, and D((YRI,CHB),(X,Karitiana)) to test for recent Asian gene flow. Thick and thin whiskers represent 1 and 3 standard errors, respectively.
Supplementary information
Supplementary Information
This file contains Supplementary Information with References, Supplementary Tables S1-S8 and Supplementary Figures S1-S8. (PDF 6424 kb)
Rights and permissions
This work is licensed under a Creative Commons Attribution-NonCommercial-ShareAlike 3.0 Unported licence. The images or other third party material in this article are included in the article's Creative Commons licence, unless indicated otherwise in the credit line; if the material is not included under the Creative Commons licence, users will need to obtain permission from the licence holder to reproduce the material. To view a copy of this licence, visit http://creativecommons.org/licenses/by-nc-sa/3.0/.
About this article

Cite this article
Rasmussen, M., Sikora, M., Albrechtsen, A. et al. The ancestry and affiliations of Kennewick Man. Nature 523, 455–458 (2015). https://doi.org/10.1038/nature14625
Received:
Accepted:
Published:
Issue Date:
DOI: https://doi.org/10.1038/nature14625
This article is cited by
-
The Allen Ancient DNA Resource (AADR) a curated compendium of ancient human genomes
Scientific Data (2024)
-
Peopling of the Americas as inferred from ancient genomics
Nature (2021)
-
The Pre-Columbian Peopling and Population Dispersals of South America
Journal of Archaeological Research (2021)
-
Initial Upper Palaeolithic humans in Europe had recent Neanderthal ancestry
Nature (2021)
Comments
By submitting a comment you agree to abide by our Terms and Community Guidelines. If you find something abusive or that does not comply with our terms or guidelines please flag it as inappropriate.
