
Abstract
Improving lava flow hazard assessment is one of the most important and challenging fields of volcanology and has an immediate and practical impact on society. Here, we present a methodology for the quantitative assessment of lava flow hazards based on a combination of field data, numerical simulations and probability analyses. With the extensive data available on historic eruptions of Mt. Etna, going back over 2000 years, it has been possible to construct two hazard maps, one for flank and the other for summit eruptions, allowing a quantitative analysis of the most likely future courses of lava flows. The effective use of hazard maps of Etna may help in minimizing the damage from volcanic eruptions through correct land use in densely urbanized area with a population of almost one million people. Although this study was conducted on Mt. Etna, the approach used is designed to be applicable to other volcanic areas.
Introduction
Depending on their intensity and position, volcanic eruptions at Mt. Etna (Sicily, Italy, Fig. 1) have the potential to cause significant social and economic damage. Etna is characterized by persistent activity from summit craters, consisting of degassing and explosive phenomena associated with fast-moving lava flows1,2 and recurrent effusive eruptions from vents located on the flanks of the volcano, producing lava flows that can extend for several kilometres3,4,5. In future eruptions, one can expect to see one or the other of these eruptive types6,7. The geological record suggests that summit eruptions are somewhat more probable than flank8. However, both summit and flank eruptions are likely to produce lava flows and these are the greatest hazard posed by Mt. Etna to inhabited areas. Over the last 400 years, the most destructive eruption occurred in 1669 when ∼1 km3 of lava was erupted in about four months, producing a 17.3 km long tube-fed lava flow field that destroyed several villages and part of the city of Catania5. In the last century, the town of Mascali was almost completely destroyed by lava flows in 1928 and the towns of Fornazzo, Randazzo and Zafferana Etnea were threatened in 1979, 1981 and 1992, respectively. Recently, tourist facilities in the summit area have been extensively devastated by the 2001 and 2002–2003 lava flow-forming eruptions9, with serious damage to the local economy.

Volcano-tectonic map of Etna, showing the spatial distribution of main faults and eruptive fissures produced by flank eruptions in the last 2 ka.
The dykes of Valle del Bove are shown in the left hand inset (enlarged from the dotted black square). The lava flows emitted in the last 400 years are reported in two separate periods, recent (1981–2013) in red and older (1600–1980) in orange. The dashed black square delineates an area of 32.5 × 36 km containing the 500 m spaced grid of potential vents. This figure was generated using the free and open source GRASS GIS software. The topography is based on a DEM owned by INGV.
The ever-expanding use of areas near the volcano increases the potential impact of future eruptions on the regional economy and on the health and safety of the inhabitants5. The increasing exposure of a larger population, which has almost tripled in the area around Mt. Etna during the last 150 years, is often derived from a poor assessment of the volcanic hazard, allowing inappropriate land use in vulnerable areas10. Therefore, a correct assessment is an essential component in reducing the losses due to volcanic disasters. A detailed map showing areas that are likely to be inundated by future lava flows is extremely useful, allowing people living nearby to judge for themselves the relation between potentially dangerous areas and their daily lives. For summit eruptions at Mt. Etna the hazard related to lava flow inundation has been assessed only at the South-East Crater1, while for flank eruptions different hazard maps have been already proposed. Some of them are based on a qualitative analysis of historical eruptions4,5; other maps estimate the hazard combining the probability of an eruption occurring anywhere on the volcano with the results of lava flow simulations10,11,12,13,14,15.
Here we present an up-to-date methodology for the quantitative assessment of lava flow hazard based on the critical combination of field data, numerical simulations and probability analysis. In particular, we produce lava flow hazard maps for Mt. Etna by combining numerical simulations of lava flow paths, spatiotemporal probability of future vent opening and event probabilities associated with classes of expected eruptions. Our purpose is to give a rigorous statistical treatment of the historical records of summit and flank eruptions and to explore a much wider range of eruptive scenarios, i.e. different hypothetical volcanic events, than is possible to observe directly in identifying areas at risk. Although lava flow hazards could be considered in terms of the cumulative effects of summit and flank eruptions, a better approach is to assess the hazard related to each type of volcanic eruption separately, as they have varying characteristics and impacts. The final products of our analysis are two long-term hazard maps8, one for flank and the other for summit eruptions, showing the probability that a certain area will be inundated by future lava flows over a specific time period.
Results
Lava flow hazard assessment
The methodology, developed to achieve a reliable and comprehensive assessment of lava flow hazards at Mt. Etna, is founded on the MAGFLOW numerical model for simulating lava flow paths16,17,18. Numerical simulations are a powerful tool to explore various eruption scenarios, as they can be used to estimate the extent of the lava field, the time required for the flow to reach a particular point and the resulting morphological changes19,20,21. The numerical simulations of lava flow paths are based on our knowledge of Etna's past eruptions, derived from the integration of historical and geological data and by adopting a high-resolution updated digital elevation model (DEM). Accounting for a more comprehensive range of possible scenarios, through the combination of field data, numerical modeling and probabilistic analysis, gives a better understanding of effusive eruptions and their effects. However, such a combination is rarely straightforward and requires an accurate evaluation of diverse stages. For this reason, we developed a methodology based on four different tasks (Methods): (i) assessment of the spatiotemporal probability of future vent opening, (ii) estimation of the occurrence probability associated with classes of expected eruptions, (iii) simulation of a large number of eruptive scenarios with the MAGFLOW model and (iv) computation of the long-term probability that a lava flow will inundate a certain area. We applied this four-stage methodology to estimate lava flow hazard at Mt. Etna both for flank eruptions and summit eruptive activity.
Hazard assessment for flank eruptions
The historical records of flank eruptions at Etna date back over 2000 years, but are continuous and reliable only from the 17th century22. The eruptive behavior of Etna in the last 400 years is undoubtedly irregular, with important fluctuations in frequency, type of eruptions and lava discharge rates, both in the long (centuries) and short (decades) terms6,23,24,25. During the past century, major flank eruptions causing significant damage to crops and disruption in towns and villages have occurred in 1910, 1923, 1928, 1971, 1979, 1981, 1983, 1991–1993, 2001 and 2002–20035,8,22. An evident increase in the lava output and frequency of eruptions began in 1971. Since then, 17 eruptions have occurred mostly along the main rift zones (Fig. 1), showing that the volcano has been in a strongly active period during the last 400 years8.
In flank eruptions at Mt. Etna, lavas erupt from newly formed fissures and vents, hence, the potential spatiotemporal distribution of new vent openings must be estimated as part of the analysis. In order to identify the most probable emission zones of future lava flows, we analyzed the spatial location of past eruptive vents, as well as the eruption frequency within a time window. Recently, we conducted a detailed study22 of the main structural features of flank eruptions at Etna, including the outcropping and buried eruptive fissures active in the past 2000 years, the dykes in the Valle del Bove depression7,26 (Fig. 1a) and the main faults that can potentially be used as pathways for intruding magma27 and/or influence the surface stress field of the volcano. It is noteworthy that shallow feeder dykes guided by faults are not very rare on Etna, such as in the 1928 eruption27, while in other volcanoes worldwide the use of faults as channels is uncommon28. All these geological and structural features were used to construct the spatial probability map of vent opening at Etna27. Thanks to the completeness and accuracy of historical data over the last four centuries, we demonstrate spatial non-homogeneity and temporal non-stationarity of flank eruptions on Etna, showing that effusive events follow a non-homogenous Poisson process with space-time varying intensities8. Here, we assess the distribution of future vent locations using a probabilistic modeling (Methods) based on the locations of the pre-1600 eruptive fissures, dykes and faults (for which an exact date cannot be established) and on the spatial positioning and temporal sequencing of the post-1600 flank eruptions (that are accurately documented and well-dated). We calculate the recurrence rates (events expected per unit area per unit time) and produce a spatiotemporal probability map of new vent opening for the next 50 years (Fig. 2a). The distribution of probabilities is strongly non-homogeneous. The highest probability of new eruptions occurs in the areas closer to the summit of the volcano, at elevation higher than 2500 m. Diversity in the probability estimates also occurs in lower elevation areas, between 2500 and 1800 m. Below 1000 m, the expectation of new vent opening is very low, except in the South Rift, where probabilities slowly decrease to an elevation of ∼600 m.

(a) Spatiotemporal probability map of vent opening at Mt. Etna for the next 50 years. The probabilistic modeling is based on the locations of the pre-1600 eruptive fissures, dykes and faults and on the spatial positioning and temporal occurrence of post-1600 flank eruptions. (b) The six eruptive classes obtained by analysing duration and lava volume of eruptions at Etna volcano in the last 400 years. The dashed vertical line suggests the time barrier (30 days) for duration, while the two dashed horizontal lines show the lava volume divisions (30 and 100 × 106 m3). The percentage of occurrence for each eruptive class is also reported. (c) Curves of flux rate-days for the MAGLFOW numerical simulations associated with the six expected eruptive classes. The different colors highlight the three different total volumes of lava emitted. This figure was generated using the free and open source GRASS GIS software. The topography is based on a DEM owned by INGV.
To estimate the probability of occurrence of eruptions, a complete revision of location and opening dynamics of all flank eruptions occurring in the past 400 years was carried out. For each lava flow field, we collected the main quantitative volcanological data, concerning the eruption start and end, the eruptive style, the area covered by flows, the lava volume emitted and the fissure producing the lava flow. From an accurate analysis of the distribution of flow durations and lava volumes, we selected a time barrier at 30 days and two divisions for the total volume emitted, at 30 and 100 × 106 m3. Thus we obtained six eruptive classes, five of which are populated (Fig. 2b). This classification of expected eruptions permitted calculation of local occurrence probabilities for each class and the deduction of essential information for the lava flow simulations (Methods).
The eruptive scenarios were simulated using MAGFLOW29,30, which is based on a physical model for the thermal and rheological evolution of the flowing lava. To determine lava flow emplacement, MAGFLOW requires several input parameters: a digital representation of the topography, the chemical composition of the lava, an estimate of the effusion rate and the location of the eruptive vent. As digital representation of the topography, a 10-m resolution DEM of Etna updated to 2007 was utilized. For the chemical composition of the lava, the typical properties of Etna's basaltic rocks31,32 were used (Methods). The effusion rate, e.g. the discharge rate controlling how a lava body grows, was derived from the six eruptive classes obtained from the characterization of expected eruptions. Since the numerical simulations require flow duration and lava volume to be defined, short and long time periods were set at 30 and 90 days respectively, while 30, 100 and 200 × 106 m3 were fixed as values for total volume of lava emitted. These values of duration/volume produced six possible bell-shaped curves16 representing the flux rate as a function of time (Fig. 2c). Locations of eruptive vents are the nodes of a regular grid with boundaries shown in Fig. 1. For every potential vent, six simulations were executed, each one representative of a particular eruptive class.
Finally, assessment of the long-term hazard related to lava flows at Mt. Etna rests on combining the spatiotemporal probability of future opening of new eruptive vents, occurrence probabilities for each class of expected eruption and the overlapping of a large number (28,908) of numerical simulations (Methods). The hazard map for the next 50 years is shown in Fig. 3. The highest hazard level is reached in the well-delimited zone inside the Valle del Bove, a 5 × 7 km morphological depression on the eastern flank of the volcano able to capture lava flows emitted from the eruptive vents below the summit craters and along the upper portions of the South and North-East Rifts. Only eruptions exceptional in duration and lava output could form lava flows capable of travelling across the entire valley and seriously threatening the towns of Zafferana Etnea and Santa Venerina in the eastern sector. Other areas more likely to be threatened by lava flows are those on the southern flank, including densely populated areas near the towns of Nicolosi, Pedara, Trecastagni and Ragalna. Towns located at lower elevations could be equally threatened by lava flow inundation, though the hazard progressively diminishes at greater distances from volcano summit. On the northern and western sectors of the volcano, the main population centers exposed to lava inundation are Linguaglossa, downslope of the North-East Rift and Bronte, located along the likely trajectory of lava flows emitted from the West Rift.

Hazard map by lava flow inundation at Mt. Etna, based on 28,908 simulations of lava flow paths starting from 4,818 different potential vents.
Colors represent different hazard levels indicating a range of probability of inundation by a lava flow from a flank eruption in the next 50 years. Summit craters are masked because their activity is investigated separately. This figure was generated using the free and open source GRASS GIS software. The topography is based on a DEM owned by INGV.
Validation of the lava flow hazard map is an additional task in our four-stage methodology, giving a quantitative evaluation of its reliability. As historical eruptions provide the only available information, we propose a retrospective validation using more recent past eruptions to indicate potential future events33. In particular, we calculate a fitting score to measure the overlap of the probability distribution of lava flow hazards at Etna up to the year 1981 against the historical lava flow paths that occurred after 1981 (Fig. 1). The good agreement between the observed and expected inundation areas obtained for the hazard map up to 1981 confirms the consistency of our results33.
Hazard assessment for the summit eruptive activity
The summit area of Mt. Etna has frequently undergone major morphological changes due to its persistent eruptive activity, both effusive and explosive (Fig. 1a). A single, large Central Crater (CC) existed until the beginning of the 20th century, but soon afterwards the summit area was affected by repeated subsidence and collapse phenomena alternating with intracrater volcanic activity and the birth of new summit vents34. The North-East Crater (NEC; formed in 1911) opened a few hundred meters north of the CC rim. The Voragine (VOR; 1945) and the Bocca Nuova (BN; 1968) opened inside the CC. Finally, the South-East Crater (SEC; 1971) is the youngest and currently the most active summit vent, as also testified by the growth of a large new cone on its southeast flank, identified as the New South-East Crater1 (NSEC; 2007). The progressive increase in summit eruptive activity during the past 110 years is confirmed by the results of the statistical analysis8, indicating that the hazard from eruptive events is not constant with time and differs for each summit crater of Mt. Etna. A clear increase in the eruptive frequency is evident from the middle of the last century and particularly from 1971, when the SEC was formed.
The probability that a lava flow will inundate a certain area was estimated assuming an effusive eruption originated from a vent within the summit area of Mt. Etna. This was done using the methodology adopted for flank eruptions, including the development of the spatiotemporal probability map of future vent opening, the occurrence probabilities associated with the classes of expected eruptions and numerical simulation of a number of eruptive scenarios.
Firstly, we calculated a spatiotemporal probability map of future vent opening for the next 10 years using the spatial location of the existing four summit craters (CC, NEC, SEC and NSEC) and the frequency of eruptions since 1900 (Methods). This produced the spatiotemporal probability map for future vent opening shown in Fig. 4a.

(a) Spatiotemporal probability map of vent opening at Mt. Etna for the next 10 years within the summit area. The grid of potential vents, defined by a circular region (dashed area), has a regular spacing of 100 m. The probability values are calculated using the location of centroids for the main craters (CC, NEC, SEC and NSEC) and on the temporal occurrence of summit eruptions in the last century. (b) Classification based on durations and lava volumes of paroxysmal events and Strombolian activity occurring at Etna's summit craters since 1955. The Mean Output Rate (MOR) is calculated as the final volume of erupted lava divided by total eruption duration. (c) Curves of flux rate-hours from the MAGLFOW numerical simulations associated with the nine expected classes of paroxysmal events (Classes I–IX). For Class X, a low constant rate (MOR ≈ 0.5 m3 s−1) was assumed for the entire duration (150 days) of the simulated event. This figure was generated using the free and open source GRASS GIS software. The topography is based on a DEM owned by INGV.
Subsequently, the classes of expected summit eruptions were identified. We used flow duration/lava volume distributions for paroxysmal events and Strombolian activity at the summit craters1,2, to distinguish ten classes. For the paroxysmal events, lava flows and lava fountains occurring at VOR and SEC since 1998 were considered. We established three different duration intervals (≤4, 4–8 and >8 hours) and emitted lava volumes (≤1, 1–2 and >2 × 10⁶ m3), resulting in nine possible eruptive classes1 (Classes I–IX; Fig. 4b). The last class of expected eruptions (Class X) was identified on the basis of Strombolian activity from 1955 to 1996. Classification of expected eruptions enables probabilities of occurrence to be calculated (Methods), as well as deriving the ten effusion rate trends associated with each class for the MAGFLOW simulations. For Classes I–IX of paroxysmal events, we used the bell-shaped curves shown in Fig. 4c. Since the Strombolian episodes are often characterized by a continuous mild effusive activity, we assigned to the Class X a constant rate equal to the Mean Output Rate (MOR ≈ 0.5 m3 s−1; see Fig. 4b) for the entire duration (150 days) of the eruption.
To evaluate areas more likely to be affected by lava flow paths we computed ten simulations, corresponding to the expected classes of eruptions (Classes I–X), for each of the potential vents of the grid defined around Etna's summit craters (Fig. 4a). The topographic base was the 10-m resolution DEM of Etna updated to 200734, while the chemical composition of the lava was defined using the properties of products erupted from Etna's paroxysmal events35.
The hazard map for summit eruptions was obtained by combining the spatiotemporal probability of future vent opening, the probability of occurrence for each eruptive class and a large number of simulations (5,950) computed with the MAGFLOW model. The resulting hazard map (Fig. 5) estimates probable areas of inundation by lava flows issuing from vents within the summit area over the next 10 years. The inundated area measures about 51 km2, while the maximum distance of the simulated lava flow paths is reached at the end of Valle del Bove (∼700 m elevation) and in the direction of Linguaglossa, ∼1200 m elevation. Close to the summit area, the northern tourist facilities (Piano Provenzana) located above 1800 m are exposed to lava inundation, although no simulated flows erupted from the summit vents inundated the southern tourist facilities (Rifugio Sapienza) at ∼1900 m. New pyroclastic cones formed on the southern flank during the 2001 and 2002–2003 eruptions, created an effective topographic barrier to these lava flows, diverting lava west or east of the cones.

Hazard map for lava flow inundation at Etna's summit area.
It is based on 5,950 simulations of lava flow paths starting from 595 different potential vents. Colors represent different hazard levels showing the probability of lava flow inundation for the areas potentially affected by lava flows emitted from vents around the CC, NEC and SEC in the next 10 years. Piano Provenzana and Rifugio Sapienza are the main tourist facilities located respectively on the northern and southern sides of the Mt. Etna. This figure was generated using the free and open source GRASS GIS software. The topography is based on a DEM owned by INGV.
Discussion
When lava flows through towns and rural land, destruction is usually complete. However, the effects of lava flows can be reduced or eliminated by careful advance planning, so that cities and vulnerable structures are built away from or above likely lava flow paths. Hence understanding where and when lava flows are likely to occur is a vital requirement of any hazard assessment at volcanoes. Here a reliable way to estimate lava flow hazard based on a combination of field data, probabilistic modelling and accurate MAGFLOW simulations has been demonstrated. A comprehensive assessment of lava flow hazard entails incorporating the observed variability in both the spatial location and time frequency of historical eruptions into a probabilistic hazard analysis. Moreover, it requires a reliable numerical model, such as MAGFLOW, to accurately explore many eruptive scenarios, taking into account the lava's physical and rheological properties in addition to the topography affecting lava emplacement. This approach was applied at Mt. Etna to construct two long-term hazard maps, one for flank and the other for summit eruptions. Although this study was carried out at Mt. Etna, the approach used to assess areas most likely to be affected by lava flows is designed to be general and applicable to any volcanic area, where available data on historic eruptions are significant from a statistical point of view. Obviously, the accuracy of the results is affected by the reliability of the numerical simulations, the quality of input data and the construction of both the spatiotemporal probability of vent opening and the occurrence probability for different eruptive classes. However, the flexibility of the methodology allows updating of the hazard map simply and quickly, as input parameters change. This means that any uncertainty in assigned probability can be corrected and a new map obtained by re-processing all the eruptive scenarios simulated with MAGFLOW.
Lava flow hazard maps can be a very powerful instrument in identifying operational guidelines for mitigation during eruptive emergencies36. Moreover, knowing the areas that are the most exposed to inundation by a lava flow is useful for environmental preservation and to encourage better land use planning. Clearly the hazard map does not provide a deterministic forecast of future eruptions, but a useful prediction based on probabilistic modeling of historical eruptive activity of the volcano.
Presently our study shows that diligence is required in developing accurate lava flow hazard maps in densely populated areas. Improved management of volcanic threats requires real-time access to differing geophysical datasets, i.e. volcanic monitoring data, to achieve continuous updating of short-term hazard maps in the case of unrest and production of a risk map evaluating the expected damage that an eruptive event may cause to life, health, property and environment in a given area in a certain time period. Such maps are an indispensable guide in managing volcanic emergencies in terms of planning, mitigation of potential effects, relief efforts and assessing potential loss and replacement costs.
Methods
Spatiotemporal probability of future vent opening
The different typologies of available geological and structural datasets were accounted for by converting them in separate probability density functions (PDFs), giving each a relevance value (weight) and finally combining all the PDFs and weights in a non-homogeneous Poisson process.
For the flank eruptions at Etna, we considered four datasets: the eruptive fissures, divided into recent (post-1600) and older (pre-1600) fissures, the dykes and the main faults. We defined a 500-m spaced grid of potential vents vi(x,y) covering an area 32.5 km E-W and 36 km N-S (Fig. 1), over which we calculated separate PDFs using the formula for the Gaussian kernel:
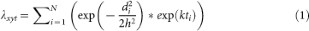
where N is the total number of volcanic structures considered in the calculation, di is the distance between the potential vent vi(x,y) and the ith volcanic structure, ti is the elapsed time since the eruption at the i-th eruptive fissure, k is a constant and h is the smoothing factor. The constant k serves the purpose of assigning larger weights to more recent events in comparison to older ones. For the post-1600 fissures, we calculated k (−0.00107) from the back analysis8. For the pre-1600 eruptive fissures, dykes and faults, k is zero since an exact date ti for these ancient volcanic events cannot be established. The smoothing factor h determines the influence of each volcanic structure, giving it high emphasis (for small values of h) or yielding a more uniform distribution across the area (for large values of h). To estimate h, we used the explicit version of the Least Squares Cross-Validation37,38 (LSCV), which is based on minimizing the integrated square error between the true and the estimated distribution. The smoothing parameters h minimizing the LSCV score are found to be 1000 m for the post-1600 fissures, 1200 m for the pre-1600 fissures, 1050 m for the dykes and 1350 m for the faults27. The PDFs for pre-1600 and post-1600 eruptive fissures, dykes and faults, after being normalized so that their integral across the whole area is unity, were aggregated in a linear combination using weights that express the importance and the quality of each dataset in evaluating the distribution. The best weights were computed from back analysis exploiting the location of the most recent flank eruptions since 1983 and found to be 0.15, 0.6, 0.15 and 0.1, respectively, for pre-1600 and post-1600 eruptive fissures, dykes and faults27. Finally the spatiotemporal probability map for future opening was calculated as:

where Λxyt is the linear combination of the four PDFs rescaled with the recurrence rate for the next 50 years6 (0.231), which was calculated on the basis of the frequency of flank eruptions occurring since 1610. Thereby pa specifies the probability of activation of each potential vent vi(x, y), i.e. the probability that at least one eruption will occur in the unit area ΔxΔy (500 m × 500 m) within the Δt time period considered (50 years).
For summit eruptive activity at Etna, one dataset including the four summit craters (CC, NEC, SEC and NSEC) was considered. The grid of potential vents was defined on a circular region with a spatial resolution of 100 meters (dashed area of Fig. 4a). For the spatial analysis, we considered the areas covered by CC, NEC, SEC and NSEC, on which we identified four centroids that were used to calculate the PDF with the Gaussian kernel for point patterns. The best estimate for the smoothing parameter h (300 m) was found by minimizing the LSCV score on the centroid locations. The PDF was rescaled with the recurrence rate for the next 10 years (17.03), which was calculated on the frequencies of summit eruptions occurring since 1900 at Etna8. Finally, for each potential vent in the circular grid, we calculated the probability of activation pa that at least one eruption will occur in the unit area ΔxΔy (100 m × 100 m) within the Δt time period under consideration (10 years).
Occurrence probability of expected eruptions
For the flank eruptions at Etna, we considered the location of the eruptive fissures divided into six eruptive classes (Fig. 2b) and estimated for the populated ones the bandwidth h with the LSCV score, obtaining the following values: 1300 m for class 1, 3700 m for class 2, 500 m for class 3, 1200 m for class 4 and 1400 m for class 6. To estimate the probability that one of the eruptive classes may occur in each potential vent vi(x,y) we used the formula of the Gaussian kernel generalized for broken lines27,36,38:
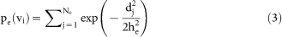
where dj is the distance between each potential vent and the jth eruptive fissure belonging to the class e, while he and Ne are respectively the bandwidth and the cardinality of e. We applied Eq. 3 only to the fissures of classes 1, 2, 3, 4 and 6, which were rescaled so that the integral across the area equaled the percentages of occurrence per class reported in Fig. 2b. For the empty eruptive class 5 an extremely low homogenous density was defined so that the integral across the area equaled a probability close to zero (0.0001). Finally, the estimates of pe are rescaled so that their sum for each potential vent vi(x,y) is equal to 1.
For the summit activity at Etna, we accounted for the flow duration/lava volume distributions of the paroxysmal events and Strombolian activity at the summit craters1,2, identifying ten classes. The probability of occurrence for each expected eruptive class was calculated by normalizing the percentage frequencies reported in Fig. 4b.
Numerical simulation of lava flow paths
The likely flow lengths and the extent of the area affected by expected eruptions were simulated using the MAGFLOW cellular automata (CA) model16,17, based on a two-dimensional structure with cells described by five scalar quantities: ground elevation, lava thickness, heat quantity, temperature and amount of solidified lava. The system evolution is purely local, with each cell evolving according to its present status and the status of its eight immediate neighbors. In this way, the CA can produce extremely complex structures using simple and local rules. The domain (automaton size) must be large enough to include the expected maximum extent of the lava flow and is decomposed into square cells whose width matches the resolution of the DEM available for the area. Lava thickness varies according to lava influx between source cells and any neighboring cells. Lava flux between cells is determined by the height difference in the lava using a steady-state solution for the one-dimensional Navier–Stokes equations for a fluid with Bingham rheology, in which the conservation of mass is guaranteed both locally and globally16. Rheological properties are modeled using a variable viscosity relationship for Etna's basaltic rocks31, parameterized in terms of temperature and water content17,21. Typical parameters of the Etna's lava used for the MAGFLOW simulations are: density (2600 kg m−3); specific heat capacity (1150 J kg−1 K−1); emissivity (0.9); solidification temperature (1173 K) extrusion temperature (1360 K).
Inundation probability by lava flows
The probability of inundation was computed for each point (x,y) of the area covered by flow simulations taking into account information on overlapping lava flows, the spatiotemporal probability of vent opening and the probability of occurrence of eruptive classes. Firstly the probability of each eruptive event is estimated and successively the total-accumulation probability as the union of these individual probabilities is evaluated. Over a given time period, the different eruptive events are independent but not mutually exclusive since they can all occur and have no influence on each other39. Let A1, A2, …, An be independent events, then the probability of their union is the intersection of all complements A1C, A2C,…, AnC:
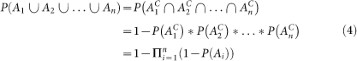
being 1 − P(Ai) the probability that event i does not occur and  the probability that none of the n events occur. For lava flow hazard, the total-accumulation probability in the Δt interval considered for each point (x,y) of the Etnean area can be rewritten as:

where M is the number of MAGFLOW simulations of the eruptive class e emitted by vent vi inundating the point (x,y), pa(vi, Δt) is the spatiotemporal probability of opening for vent vi in the next Δt years and pe(vi) is the probability of occurrence in vi for the eruptive class e. Thus Haz(x, y, Δt) is the probability of point (x,y) being affected by at least one lava flow in the next Δt years.
References
Vicari, A. et al. Near-real-time forecasting of lava flow hazards during the 12–13 January 2011 Etna eruption. Geophys. Res. Lett. 38, L13317 10.1029/2011GL047545 (2011b).
Ganci, G. et al. A year of lava fountaining at Etna: volumes from SEVIRI. Geophys. Res. Lett. 39, L06305 10.1029/2012GL051026 (2012a).
Guest, J. E. & Murray, J. B. An analysis of hazard from Mount Etna volcano. J. Geol. Soc. London 136, 347–354 (1979).
Andronico, D. & Lodato, L. Effusive Activity at Mount Etna Volcano (Italy) during the 20th Century: A Contribution to Volcanic Hazard Assessment. Nat. Hazards 36, 407–443 (2005).
Behncke, B., Neri, M. & Nagay, A. Lava flow hazard at Mount Etna (Italy): New data from a GIS-based study. in Kinematics and dynamics of lava flows, edited by M. Manga and G. Ventura, Spec. Pap. Geol. Soc. Am. 396, 189–208 (2005).
Behncke, B. & Neri, M. Cycles and trends in the recent eruptive behaviour of Mount Etna (Italy). Canadian Journal of Earth Sciences 40, 1405–1411 (2003).
Acocella, V., Neri, M. & Sulpizio, R. Dike propagation within active central volcanic edifices: constraints from Somma-Vesuvius, Etna and analogue models. Bull. Volcanol. 71, 219–223 (2009).
Cappello, A., Bilotta, G., Neri, M. & Del Negro, C. Probabilistic modelling of future volcanic eruptions at Mount Etna. J. Geophys. Res. Solid Earth 118, 1925–1935 10.1002/jgrb.50190 (2013).
Del Negro, C. et al. Capturing the fingerprint of Etna volcano activity in gravity and satellite radar data. Sci. Rep. 3, 3089; 10.1038/srep03089 (2013).
Harris, A. J. L., Favalli, M., Wright, R. & Garbeil, H. Hazard assessment at Mount Etna using a hybrid lava flow inundation model and satellite-based land classification. Nat. Hazards 58, 1001–1027 (2011).
Wadge, G., Young, P. & McKendrick, I. J. Mapping lava flow hazards using computer simulation. J. Geophys. Res. 99, 489–504 (1994).
Favalli, M., Tarquini, S., Fornaciai, A. & Boschi, E. A new approach to risk assessment of lava flow at Mount Etna. Geology 37, 1111–1114 (2009).
Crisci, G. M. et al. Predicting the impact of lava flows at Mount Etna, Italy. J. Geophys. Res. 115, B04203 (2010).
Cappello, A., Vicari, A. & Del Negro, C. Assessment and modeling of lava flow hazard on Etna volcano. Boll. Geof. Teor. Appl. 52, 299–308 10.4430/bgta0003 (2011a).
Rongo, R. et al. Defining High Detailed Hazard Maps by a Cellular Automata approach: Application to Mt. Etna (Italy). Ann. Geophys. 54(5), 568–578 (2011).
Vicari, A. et al. Modeling of the 2001 lava flow at Etna volcano by a cellular automata approach. Env. Mod. Soft. 22, 1465–1471 10.1016/j.envsoft.2006.10.005 (2007).
Del Negro, C., Fortuna, L., Herault, A. & Vicari, A. Simulations of the 2004 lava flow at Etna volcano by the MAGFLOW cellular automata model. Bull. Volcanol. 70, 805–812 10.1007/s00445-007-0168-8 (2008).
Bilotta, G. et al. Porting and optimizing MAGFLOW on CUDA. Annals of Geophysics 54, 5, 10.4401/ag-5341 (2011).
Vicari, A., Ciraudo, A., Del Negro, C., Hérault, A. & Fortuna, L. Lava flow simulations using effusion rates from thermal infrared satellite imagery during the 2006 Etna eruption. Nat. Hazards 50 (3), 539–550 10.1007/s11069-008-9306-7 (2009).
Vicari, A. et al. LAV@HAZARD: A Web-Gis interface for volcanic hazard assessment. Ann. Geophys. 54(5), 662–670 doi/10.4401/ag-5347 (2011a).
Bilotta, G. et al. Sensitivity analysis of the MAGFLOW Cellular Automaton model for lava flow simulation. Env. Mod. Soft. 35, 122–131 10.1016/j.envsoft.2012.02.015 (2012).
Neri, M. et al. Structural analysis of the eruptive fissures at Mount Etna (Italy). Ann. Geophys. 54(5), 464–479 (2011).
Wadge, G., Walker, G. P. L. & Guest, J. E. The output of the Etna volcano. Nature 213, 484–485 (1975).
Murray, J. Seismicity and time-lagged lava output at Mount Etna: a new method of long-term forecasting at a destructive volcano. Geology 31, 443–446 (2003).
Allard, P., Behncke, B., D'Amico, S., Neri, M. & Gambino, S. Mount Etna 1993–2005: Anatomy of an Evolving Eruptive Cycle. Earth-Science Rev. 78, 85–114 (2006).
Acocella, V. & Neri, M. Dike propagation in volcanic edifices: overview and possible developments. Tectonophysics 471, 67–77 (2009).
Cappello, A. et al. Spatial vent opening probability map of Mt. Etna volcano (Sicily, Italy). Bull. Volcanol. 74, 2083–2094 10.1007/s00445-012-0647-4 (2012).
Gudmundsson, A. Infrastructure and mechanics of volcanic systems in Iceland. Journal of Volcanology and Geothermal Research 64, 1–22 (1995).
Hérault, A., Vicari, A., Ciraudo, A. & Del Negro, C. Forecasting lava flow hazards during the 2006 Etna eruption: Using the MAGFLOW cellular automata model. Comput. Geosci. 35 (5), 1050–1060 10.1016/j.cageo.2007.10.008 (2009).
Ganci, G., Vicari, A., Cappello, A. & Del Negro, C. An emergent strategy for volcano hazard assessment: From thermal satellite monitoring to lava flow modeling. Rem. Sens. Environ. 119, 197–207 10.1016/j.rse.2011.12.021 (2012b).
Giordano, D. & Dingwell, D. B. Viscosity of hydrous Etna basalt: implications for Plinian-style basaltic eruptions. Bull. Volcanol. 65, 8–14 (2003).
Harris, A., Bailey, J., Calvari, S. & Dehn, J. Heat loss measured at a lava channel and its implications for down-channel cooling and rheology. Geol. Soc. Am. Spec. Pap. 396, 125–146 (2005).
Cappello, A., Vicari, A. & Del Negro, C. Retrospective validation of a lava flow hazard map for Mount Etna volcano. Ann. Geophys. 54, 634–640 10.4401/ag-5345 (2011b).
Neri, M. et al. The changing face of Mount Etna's summit area documented with LiDAR technology. Geophys. Res. Lett. 35, L09305 (2008).
Giordano, D., Polacci, M., Papale, P. & Caricchi, L. Rheological control on the dynamics of explosive activity in the 2000 summit eruption of Mt. Etna. Solid Earth 1, 61–69 (2010).
Becerril, L., Cappello, A., Galindo, I., Neri, M. & Del Negro, C. Spatial probability distribution of future volcanic eruptions at El Hierro Island (Canary Islands, Spain). J. Volcanol. Geotherm. Res. 257, 21–30 10.1016/j.jvolgeores.2013.03.005 (2013).
Worton, B. J. Using Monte Carlo simulation to evaluate kernel–based home range estimators. J. Wild. Manag. 59, 794–800 (1995).
Bartolini, S., Cappello, A., Martí, J. & Del Negro, C. QVAST: a new Quantum GIS plugin for estimating volcanic susceptibility. Nat. Hazards Earth Syst. Sci. 13, 3031–3042 10.5194/nhess-13-3031-2013 (2013).
Bonadonna, C. Probabilistic modelling of tephra dispersal. In: Mader, H., Cole, S. & Connor, C. B. (eds) Statistics in Volcanology. IAVCEI Series Vol. 1, Geological Society of London, 243–259 (2006).
Acknowledgements
This work was developed within the framework of TecnoLab, the Laboratory for Technological Advance in Volcano Geophysics organized by INGV-CT, DIEES-UNICT and DMI-UNICT. We thank Derek Rust for revising the English language of the manuscript.
Author information
Authors and Affiliations
Contributions
C.D.N. coordinated the research; C.D.N., A.C. and M.N. wrote the manuscript with contributions from all authors; M.N. collected volcano-tectonic data; A.C. performed the statistical analysis of data with the contribution of G.G. and G.B.; A.H. and G.B. developed the MAGFLOW model.
Ethics declarations
Competing interests
The authors declare no competing financial interests.
Rights and permissions
This work is licensed under a Creative Commons Attribution-NonCommercial-NoDerivs 3.0 Unported License. To view a copy of this license, visit http://creativecommons.org/licenses/by-nc-nd/3.0/
About this article
Cite this article
Negro, C., Cappello, A., Neri, M. et al. Lava flow hazards at Mount Etna: constraints imposed by eruptive history and numerical simulations. Sci Rep 3, 3493 (2013). https://doi.org/10.1038/srep03493
Received:
Accepted:
Published:
DOI: https://doi.org/10.1038/srep03493
This article is cited by
-
The Volcanic Hazard Maps Database: an initiative of the IAVCEI Commission on Volcanic Hazards and Risk
Journal of Applied Volcanology (2023)
-
Assessing impending hazards from summit eruptions: the new probabilistic map for lava flow inundation at Mt. Etna
Scientific Reports (2023)
-
Rapid provision of maps and volcanological parameters: quantification of the 2021 Etna volcano lava flows through the integration of multiple remote sensing techniques
Bulletin of Volcanology (2023)
-
The historical case of Paricutin volcano (Michoacán, México): challenges of simulating lava flows on a gentle slope during a long-lasting eruption
Natural Hazards (2021)
-
Lava effusion rate evolution and erupted volume during the 2018 Kīlauea lower East Rift Zone eruption
Bulletin of Volcanology (2021)
Comments
By submitting a comment you agree to abide by our Terms and Community Guidelines. If you find something abusive or that does not comply with our terms or guidelines please flag it as inappropriate.
