
Abstract
Genome wide association studies (GWAS) have been utilized to identify genetic risk loci associated with both simple and complex inherited disorders. Here, we performed a GWAS in Labrador retrievers to identify genetic loci associated with hip dysplasia and body weight. Hip dysplasia scores were available for 209 genotyped dogs. We identified a significantly associated locus for hip dysplasia on chromosome 24, with three equally associated SNPs (p = 4.3 × 10⁻⁷) in complete linkage disequilibrium located within NDRG3, a gene which in humans has been shown to be differentially expressed in osteoarthritic joint cartilage. Body weight, available for 85 female dogs, was used as phenotype for a second analysis. We identified two significantly associated loci on chromosome 10 (p = 4.5 × 10⁻⁷) and chromosome 31 (p = 2.5 × 10⁻⁶). The most associated SNPs within these loci were located within the introns of the PRKCE and CADM2 genes, respectively. PRKCE has been shown to play a role in regulation of adipogenesis whilst CADM2 has been associated with body weight in multiple human GWAS. In summary, we identified credible candidate loci explaining part of the genetic inheritance for hip dysplasia and body weight in Labrador retrievers with strong candidate genes in each locus previously implicated in the phenotypes investigated.
Introduction
Canine genome wide association studies (GWAS) have been proven to be a powerful tool to identify genetic loci associated with both simple and complex inherited conditions in dogs1,2,3. Hip dysplasia (HD) occurs commonly in dogs and has a major impact on animal welfare and life expectancy for the affected dogs4. The disease is considered heritable with an estimated heritability of between 0.2 and 0.6 and a presumed polygenic etiology5,6,7. However, environmental factors such as excessive food intake and rapid weight gain in growing animals as well as certain types of physical activities can increase the risk of developing clinical disease8,9. Treatment for clinical disease includes pain management, physiotherapy, and surgical orthopedic procedures10,11. Due to the heritability of the disease, screening dogs within high-risk breeds, such as German shepherds and Labrador retrievers, prior to breeding has been a major focus from kennel clubs and dog breeders as this has been shown to reduce frequency of moderate and severe HD12,13. Screening for HD is done by radiographic examination of the hip joint with the legs extended and abducted whilst the animal is heavily sedated or anaesthetized to allow for relaxation of the joint. Radiographic images are subsequently graded based on a standardized radiographic scoring scheme. The procedure for radiographic examination and subsequent grading has been standardized within the Fédération Cynologique Internationale (FCI)14. It has been shown that there is a good correlation between the radiographic evaluation of hip conformation and the development of clinically detectable HD later in life. Hence, selected breeding based on HD screening can be expected to reduce the prevalence of HD over time4,12,13. However, due to the complexity and presumed polygenic inheritance of HD as well as environmental factors influencing the phenotypic development, radiographic screening of breeding stock is not a warranty for unaffected offspring. Hence, other predictive measures such as genetic testing combined with estimated breeding values (EBVs) would provide more robust tools for breeding strategies against HD12.
Multiple studies have investigated the genetic cause of HD in dogs by GWAS varying in the number of SNPs used, the breed of interest and the phenotypic HD classification15,16,17,18,19,20. Although there is overlap between risk loci identified between some studies, and some studies investigate previously identified risk alleles in independent populations, no studies so far have validated that genetic markers can be used as a complement or as an alternative to radiographic screening. Several published genetic studies have focused on Labrador retrievers, as this is a popular breed which has been shown to have a higher risk of developing HD than some other breeds4,6,15,18,19,21,22. However, a genetic test based on a previous GWAS study in Labrador retrievers failed to correlate with the HD score when tested in an independent Labrador retriever cohort15,23.
Body weight or body size are highly heritable but are complex traits as evidenced by studies both in humans and animals24,25,26. The Labrador retriever is a dog breed which is known to be food motivated and at risk of developing obesity27,28. Previously, a deletion affecting the POMC gene was found to be associated with body weight and food motivation in Labrador retrievers29. As obesity is rarely inherited as a monogenic trait, it is likely that additional genetic loci play a role for these traits in Labradors30.
The aim of this study was to perform GWAS analyses on Labrador retrievers to identify genetic risk loci for HD and body weight based on Swedish Kennel Club (SKK) registered phenotypic data. In addition, color phenotypes were included as examples of simple Mendelian inherited phenotypes, to show proof of the method used for correction of population structure and data inflation in this cohort.
Results
GWAS analysis using color as the dependent phenotype
Genotyping data and color phenotypes were available for 209 SKK registered Labrador retrievers consisting of 205 females and 4 males (supplementary file S1). As a proof of concept, we performed a GWAS analysis using color as the dependent variable. This was performed to confirm that known genetic loci could be identified using this dataset and to show that the linear mixed model was able to correct for population structure and data inflation. We evaluated the population structure within the genotyped dogs by drawing a multidimensional scaling (MDS) plot depicting the two first dimensions (C1 and C2) and reflecting the color phenotype for each individual dog (Supplementary Fig. S1). The MDS plot showed that there is some population structure within the genotyped dogs with an unequal distribution of the brown phenotype across the dimensions.
We performed two separate GWAS analyses using color as the dependent phenotype. The first analysis compared black versus yellow dogs. This analysis included 148 black and 38 yellow Labrador retrievers with 115,072 SNPs passing data filtering. A basic association test correctly identified the MCR1 locus on chromosome 5 as the most associated locus (chr5: 62,870,500, pBlack/yellow = 1.4 × 10⁻²²), however, the results were inflated with a lambda value of \(\uplambda\)=1.39, as seen on the QQ-plot (Supplementary Fig. S2a and b). A subsequent analysis, using a linear mixed model, corrected for the data inflation with a resulting lambda value of \(\uplambda\) =0.96 and also correctly identified the MCR1 locus (chr5:64,358,997, pBlack/yellow = 1.49 × 10⁻²⁸), (Supplementary Fig. S2c and d).
The second analysis was performed comparing 148 black against 22 brown Labrador retrievers. A basic association test correctly identified the TYRP1 locus as the most associated locus (chr11:33,578,561, pblack/brown = 1.8 × 10–38). However, the results were inflated with a lambda value of \(\uplambda\) =3.06, as visualized on the QQ-plot (Supplementary Fig. S3a,b). Applying a linear mixed model resulted in a mild overcorrection of the inflation with a lambda value of \(\uplambda\) = 0.90 with the most associated locus (chr11:33,578,561, pblack/brown = 7.0 × 10–40) still being identified as the TYRP1 locus (Supplementary Fig. S3c,d).
The “chip heritability”, i.e. the percentage of the phenotypic variation, that could be explained by the genetic variation in the genotyping data (PVE), was calculated for each trait using GEMMA31. This resulted in PVEblack/yellow = 0.96 +/− 0.16(SE) and the PVEblack/brown = 0.93 +/− 0.12(SE), which is in alignment with expectations for the inheritance of these color traits32.
Having showed that the linear mixed model was able to correct for genomic inflation, whilst correctly identifying the color loci, we applied this analytical method to analyze our data with HD grading and body weight as the dependent variables.
GWAS analysis using the numerical HD score as the dependent variable
Genotyping data and matched numerically translated HD scores, as described in the materials and methods, were available for 209 SKK registered Labrador retrievers representing 205 females and 4 males. All individuals and 114,854 SNPs passed the quality control and filtering. An MDS plot showing the two first dimensions (C1 and C2), reflecting the numerical translated score of the included dogs, is shown in Fig. 1a together with a summary of the scores (Fig. 1b). As previously observed, the MDS plot shows some evidence of population structure that could affect the analytical process. A basic GWAS association test was performed in PLINK using the numerically translated HD value as the dependent continuous variable33. The analysis identified the strongest association to a locus on chromosome 24, with some degree of data inflation reflected in the QQ-plot and the lambda value \(\uplambda\) =1.31 (Fig. 2a,b). A linear mixed model was applied correcting for the inflation, yielding a lambda value of \(\uplambda\) =1.05 (Fig. 2c). A single significant locus was identified on chromosome 24, represented by five significantly associated SNPs, reaching the LD-corrected Bonferroni threshold (Fig. 2d, supplementary Table 1). The three strongest associated SNPs (chr24:25,406,999, chr24:25,417,878, chr24:25,465,028) were equally associated (pHD = 4.3 × 10⁻⁷), in complete LD (R2 = 1.0), and are located within the NDRG3 gene (Fig. 2e,f). One of these SNPs at chr24:25,465,028 is positioned in the splice donor position -3 of exon 4 in NDRG3. When evaluating the LD structure surrounding the most associated SNPs we found a 0.7 MB locus (chr24:24,945,587–25,656,879) in high LD (R2 > 0.8) with the most associated SNPs. This region encodes multiple candidate genes (EPB41L1, AAR2, DLGAP4, MYL9, TGIF2, ENSCAFG00000029848, NDRG3, DSN1, SOGA1, C20orf118 and SAMHD1) and the locus has previously been associated with HD in a GWAS performed in German shepherds and in a targeted study validating selected HD associated SNPs in Labrador retrievers22,34. A list of nominally significant loci was generated based on deviation from the expected p-value (supplementary file S2).
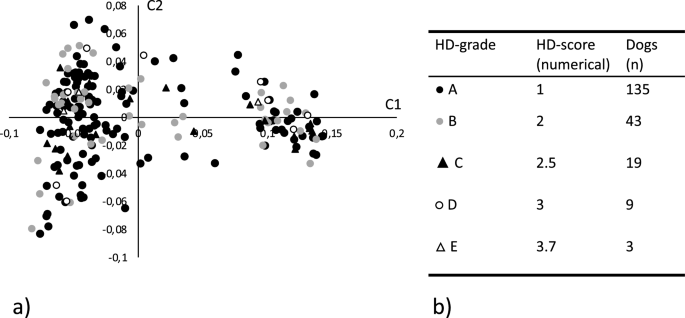
(a) Multidimensional scaling plot showing the genetic distance between the 209 genotyped Labrador retrievers in a two-dimensional space. Each datapoint represents an individual dog and the shape and color of the datapoint reflects the hip dysplasia (HD) score for the individual. Filled circle Represents individuals with grade A HD score (Normal hip score A). Grey circle represents individuals with grade B HD score (Normal hip score B). Filled triangle Represents individuals with grade C HD score (Mild hip dysplasia). Open circle Represents individuals with grade D HD score (Moderate hip dysplasia). Open triangle \(\uprho\) represents individuals with grade E HD score (Severe hip dysplasia). (b) Summary of the actual and numerically translated HD score and the number of individuals in each category of the study population.

GWAS analysis based on hip dysplasia scores in 209 Labrador retrievers. (a) QQ-plot showing the expected versus the observed p-value from the basic association test. (b) Manhattan plot showing the genetic position across the 39 chromosomes versus the −log10 transformed p-value from the basic association test. (c) QQ-plot showing the expected versus the observed p-value from the linear mixed model association test. (d) Manhattan plot showing the genetic position across the 39 chromosomes versus the −log10 transformed p-value from the linear mixed model association test. The red line delineates the Bonferroni significance threshold. The blue line delineates a nominal significance threshold based on the deviation of the QQ-plot from the expected p-value. (e) LD plot reflecting the pairwise R2 between SNPs in a 2,000 kb window centered around the most associated SNP from association analysis. (f) Closer view of the associated locus on chromosome 24 reflecting the LD structure in relation to the most associated SNP (g) Annotated genome view of the area covering the three most associated SNPs on chromosome 24 which are in complete LD and are positioned within the coding and non-coding part of the NDRG3 gene.
The percentage of phenotypic variability explained by the dataset, as calculated by GEMMA, was PVEHD = 0.36 +/− 0.22(SE), which is in alignment with the previously reported heritability for HD in Labrador retrievers7. Body weight at the time of HD scoring was available for a subset of individuals n = 89. We examined if there was any difference in the body weight between the HD score groups however, we did not find any significant difference between groups p = 0.26 (Supplementary Fig. S4).
Evaluation of EBVHD in relation to the associated genotype on chromosome 24
Estimated breeding value is an indirect prediction of the genetic merit of a trait and can be used to predict the likelihood of an individual passing on a genetic trait to its offspring. The EBV for HD (EBVHD) was available for 205 of the 209 genotyped dogs. To validate the association between the identified risk genotype and HD status, we investigated if there was a difference in the EBVHD between different genotype groups (Fig. 4a). The EBVHD was compared between dogs that did not carry the risk allele and dogs that were either heterozygous or homozygous for the risk allele. As data was not normally distributed, as determined by a normality testing, Kruskal–Wallis and Dunn’s multiple comparison test was used to compare the EBVHD between groups. We found that there was a significant difference between the mean EBVHD in the groups (p = 0.003) (Table 1). When performing intergroup comparisons, we found that dogs that were homozygous for the risk allele had significantly lower (i.e. worse) EBVHD than dogs that did not carry the risk allele (p = 0.0023) or dogs that were heterozygous for the risk allele (p = 0.023) (Fig. 4a).

GWAS analysis based on the body weight of 85 female Labrador retrievers. (a) QQ-plot showing the expected versus the observed p-value from the basic association test. (b) Manhattan plot showing the genetic position across the 39 chromosomes versus the −log10 transformed p-value from the basic association test. (c) QQ-plot showing the expected versus the observed p-value from the linear mixed model association test. (d) Manhattan plot showing the genetic position across the 39 chromosomes versus the −log10 transformed p-value from the linear mixed model association test. The red line delineates the Bonferroni significance threshold. (e) Closer view of the associated locus on chromosome 10 reflecting the LD structure in relation to the most associated SNP (f) Closer view of the associated locus on chromosome 31 reflecting the LD structure in relation to the most associated SNP (g) Annotated genome view of the locus on chromosome 10 delimited by the most associated SNP and the two SNPs in highest LD with the associated SNP. (h) Annotated genome view of the area covered by the four most associated SNPs on chromosome 31 which are equally associated and in complete LD.
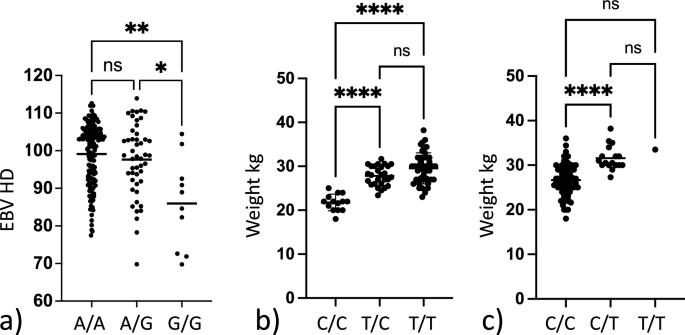
Box plots showing differences in phenotypic variables dependent on genotype. (a) Box plot showing the difference in mean estimated breeding value for HD (EBVHD) between dogs homozygous non risk (A/A) heterozygous risk (A/G) and homozygous risk (G/G) for the SNP chr24:25,406,999 associated with hip dysplasia. Significant difference is observed within the dataset. Group-wise comparison shows that homozygous risk individuals have a significantly lower (i.e. worse) EBVHD than other dogs. (b) Box plot showing the difference in mean body weight between dogs homozygous non risk (C/C) heterozygous risk (C/T) and homozygous risk (T/T) for the SNP chr10:48,367,568 associated with increased body weight. Significant difference is observed within the dataset. With group wise comparison homozygous non risk individuals have a significantly lower body weight than the other groups. (c) Box plot showing the difference in mean body weight between dogs being homozygous non risk (C/C) heterozygous risk (C/T) and homozygous risk (T/T) for the SNP chr31:1,938,609 associated with increased body weight. Significant difference is observed within the dataset. With group wise comparison homozygous non risk individuals have a lower body weight than heterozygous risk carriers. Not significant (ns) = p-value > 0.05, * = p-value ≤ 0.05, ** = p-value ≤ 0.01, *** = p-value ≤ 0.001, **** = p-value ≤ 0.0001.
GWAS analysis using body weight as the dependent phenotype
Body weight measured at the time of HD scoring was available for 89 dogs, 85 females and 4 males. As body weight differs significantly between males and females, we excluded the 4 males from the dataset to avoid an imbalanced sex bias24. To evaluate the effect of age on body weight, we performed a simple linear regression test comparing age and body weight. We did not find any correlation between increasing age and body weight (R2 = 0.0003 and p = 0.87 in the female dogs) (supplementary Fig. S5). We evaluated the population structure within the genotyped dogs by drawing an MDS plot depicting the two first dimensions (C1 and C2) and depicting dogs by weight groups. As previously seen the population structure is still observed in this smaller dataset (Supplementary Fig. S6). It is also noted that the weight categories are not equally distributed across the plot. GWAS analysis was performed using body weight as a continuous variable. After filtering and quality control, data from 85 dogs and 113,822 SNPs were included in the analysis. A basic association test was used to identify a locus on chromosome 10 as the most associated locus. However, the results were highly inflated with a lambda value of \(\uplambda\) =3.18 (Fig. 3a,b). A second analysis using a linear mixed model, markedly reduced the inflation and resulted in a lambda value of \(\uplambda\) =1.04. Two loci, on chr10:48,367,568, pBW = 4.5 × 10⁻⁷ and on chr31:1,938,609, pBW = 2.5 × 10⁻⁶, were identified with SNPs reaching the LD corrected Bonferroni threshold (Fig. 3c,d). The most associated SNP on chromosome 10 is located within an intron of the PRKCE gene, a gene previously linked to adipogenesis and body weight35,36. The locus on chromosome 10 is a narrow locus (Fig. 3e). The SNPs in highest LD with the locus defining SNP (R2 > 0.6) defines a 220 kb region containing the PRKCE and EPAS1 genes (Fig. 3g). The locus on chromosome 31 included four equally associated SNPs in complete LD (R2 = 1.0) covering a 180 kb region spanning the CADM2 gene (Fig. 3f,h), which is a gene that has been linked to obesity in multiple human studies looking at body composition in both children and adults37,38,39. In the NHGRI-EBI GWAS catalogue, BMI is listed as the most common trait associated with CADM240. Evaluation of the LD structure surrounding the SNP marking the locus, showed a 450 kb locus in high LD (R2 > 0.8) with CADM2 being the only gene located in the region.
The percentage of phenotypic variability explained by the dataset in relation to body weight, as calculated by GEMMA, was PVEWEIGHT = 0.94 + /- 0.31(SE).
Relationship between body weight and genotype for the two associated loci
To evaluate the effect of genotype on weight we performed a one-way ANOVA analysis evaluating the difference between body weight in relation to the genotype for the two associated loci. We found that there was a significant difference in mean weight between the genotype groups representing the two risk loci on chromosome 10 pBW10 = 3.2 × 10⁻¹² and chromosome 31 pBW31 = 2.4 × 10⁻⁶ (Table 1). Further, there was a significant difference in weight between dogs not carrying the risk allele on chromosome 10 and dogs being either heterozygous pCC/CT = 4.4 × 10⁻⁸ or homozygous pCC/TT = 6.7 × 10⁻¹¹ for the risk allele. A significant difference between the weight of dogs not carrying the risk allele and dogs being heterozygous for the risk allele on chromosome 31 pCC/CT = 3.5 × 10⁻⁶, was also found. However, only one dog was homozygous for the risk allele on chromosome 31 and hence no further meaningful statistical testing could be performed for homozygosity of this risk allele. Finally, a combined analysis was performed looking at the difference of body weight in dogs not carrying any risk alleles on chromosome 10 and chromosome 31 and dogs carrying different combinations of risk alleles for the two loci on chromosome 10 and chromosome 31 (Table 2 and Fig. 5). A statistically significant difference in body weight between dogs not carrying any risk alleles and dogs carrying any combination of risk alleles for the two associated loci on chromosome 10 and chromosome 31 was found.
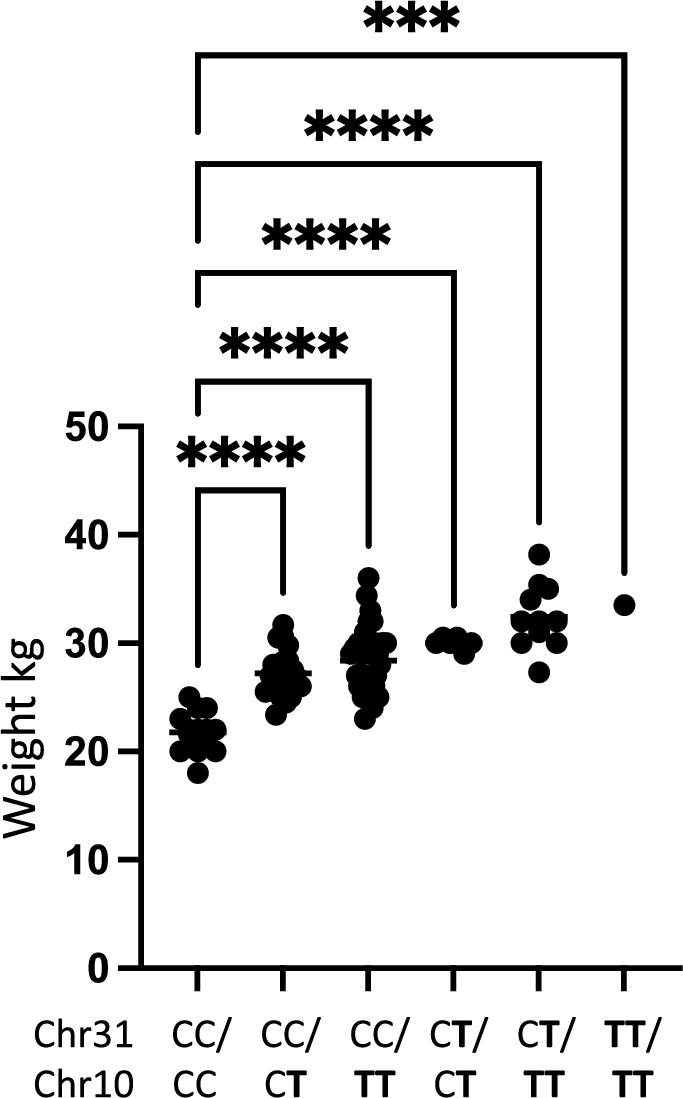
Boxplot illustrating the difference in weight between different groups. Labels indicate the genotype for the dogs in each group as reflected in Table 2 with T being the risk allele for each locus.
Discussion
In this study a GWAS investigating the genetic association of HD and body weight in Labrador retrievers based on SKK registered phenotypic data, was performed. This identified a locus on chromosome 24 associated with HD scores in Labrador retrievers. Subsequently we evaluated if the EBVsHD calculated by the SKK were different between groups either not carrying the risk allele or being hetero- or homozygotic for the risk allele. The EBVHD was found to be lower (i.e. worse) in individuals carrying the risk allele, with the most significant effect observed in the group of individuals homozygous for the risk allele compared to the heterozygotes and non-carriers. The identified risk locus contains three equally associated SNPs in complete LD located within the NDGR3 gene. NDGR3 is a gene which has been shown to be strongly expressed in osteoarthritic joint cartilage in humans and is proposed to play a role in the hypoxia mediated development and progression of osteoarthritis41,42. A locus adjacent to the NDRG3 locus on chromosome 24 has previously also been shown to be associated with HD in dogs. Fels & Distl (2014) performed a GWAS on German shepherds comparing 96 controls (dogs graded as normal, A or B, at screening) with 96 cases representing HD grade C–E, based on the FCI protocol34. In that study, in which a smaller and less dense SNP panel with 127 k SNPs was used, the most associated locus identified in the study was found on chromosome 24 with the most significant SNP being located at chr24:25,973,438, in the vicinity of the locus identified in our current study. That study validated the risk locus by genotyping the SNP in a cohort of 843 German shepherds including 277 non-dysplastic dogs and showed that the risk allele frequency was higher in the dysplastic group with an odds ratio of 4.7 (95% CI 3.72–5.94). In a more recent study by Mikkola et al. from 2021, a panel of 46 SNPs including the chr24:25,973,438 SNP were evaluated in 1600 dogs from 10 different breeds22. The study showed that the risk allele chr24:25,973,438, was associated with an increased odds ratio (OR = 1.87, 95% CI 1.07–3.28) of having HD in Labrador retrievers22. Finally, a study using a whole genome sequencing GWAS approach with phenotypes based on breed disease frequency rather than individual phenotypes, identified a locus overlapping with the current locus on chromosome 24. The locus was shown to be associated with anterior cruciate ligament rupture, elbow dysplasia and hip dysplasia in different breeds, including Labrador retrievers17. Overlap between the loci identified in these studies and the current study has been summarized in supplementary Fig. S7. With these previous studies in mind, the identified locus in the current study most likely has implications for HD in Labrador retrievers, though further functional and epidemiological validation studies are warranted to confirm the risk association and validate putative functional variants.
In our study, two loci significantly associated with body weight in female Labrador retrievers were identified. Subsequent testing showed that there is a significantly higher body weight in the group of individuals carrying either one or two copies of the risk allele in either locus. This was also confirmed when looking at the two risk loci combined. The risk locus on chromosome 10 is a narrow locus with the most associated SNP located in the PRKCE gene. This gene was identified as a novel locus associated with body weight and BMI in a large-scale human study investigating anthropometric traits36. The associated SNPs on chromosome 31 are located within the CADM2 gene. A knockout of the CADM2 gene was shown to protect against obesity in mouse models and CADM2 has been identified as a risk locus for increased BMI in multiple human studies37,39,40,43. Further, evaluation of genotype dependent differential expression of CAMD2 in different brain regions, including hypothalamus, has been shown to correlate with genotype in identified human CADM2 risk alleles, validating their effect on gene expression44. With the comparative evidence for the CADM2 gene’s role in obesity, this is a strong candidate locus for weight regulation in Labrador retrievers, which should be explored further to potentially understand the genetic cause of obesity within this dog breed.
The PVE explained by the data was calculated for all traits in this study. The PVE differed between the investigated phenotypes. Though the PVE was within the expected range for the HD and color association, it was higher than expected for the weight association, reflecting that body weight is a highly heritable trait for which a large proportion of the variation can be explained by genetics. Taking the confidence intervals into account, the PVE is not far from the heritability described for body weight within different dog breeds24. As we only had body weight and not body condition score, part of the weight phenotype in our study likely reflects dog size rather than solely obesity, which can explain the high PVE for this trait.
There are certain strengths and limitations in this study. We used a conservative threshold for determining significance, by using the significance threshold established by Bonferroni correction based on the number of independent SNPs in the dataset. Other GWAS studies have used different thresholds such as nominal significance based on deviation of the observed p-value from the expected p-value based on the Q-Q plot2. Here we employed a conservative threshold increasing the risk of missing possible loci not meting the conservative cut-off. However, the SNPs marking additional putative loci have been summarized in Supplementary file 2. In the vicinity of these SNPs it is observed that there are many additional candidate genes for future exploration. A strength of the current study is the high-quality phenotypic data being registered systematically in the SKK database and being collected in a stringent manner. However, the current study population only consisted of 31 dogs with HD scores C or worse, and a larger dataset with more severely affected individuals could have increased the power of detection. Another limitation is the inclusion of only female dogs in the weight analysis. This was done to avoid a strong bias towards the X chromosome, which is commonly found when performing an analysis including individuals of both sexes unless the X chromosome is discarded from the analysis45. We used body weight and not body condition score, or another more accurate measure of obesity, in this study and hence we cannot exclude that the weight reflects general larger body size and not necessarily obesity. Nevertheless, the associated loci identified have previously been associated with body mass and body weight in humans and animals.
In conclusion, this study identified genetic loci significantly associated with HD and body weight in Swedish Labrador retrievers. The identified loci intersected promising candidate genes with known function related to the observed phenotypes. Further validation studies should be performed in the future to fully understand the functional consequences of the risk SNPs and to identify putative causal variants.
Materials and methods
Sample collection and phenotypes
Ethylenediaminetetraacetic acid (EDTA) preserved blood samples were collected from Labrador retrievers as part of two studies investigating the genetic predisposition to severe uterine infection (pyometra) and atopic dermatitis in Swedish Labrador retrievers. As most samples were collected as part of the pyometra study, the dataset has an overrepresentation of females. Phenotypic data consisting of color, weight, HD score and individual HD estimated breeding value for HD (EBVHD), was extracted from the SKK registry based on the individual dog’s registration number. The EBVHD reflects the likelihood of the dog passing on HD to their offspring and are expressed in relation to the breed average which is set at 100. Values above 100 reflect better than breed average and a decreased propensity to pass on HD to offspring, whilst values below 100 reflect worse than breed average and an increased propensity to pass on HD to offspring. HD scores based on the official protocol of the FCI with grades A–E were available for 204 dogs. Scores A and B represent normal (non-dysplastic) hip joints, C mild HD, D moderate HD and E severe HD. The scores were translated into a numerical value based on the scale presented by Malm et al.46. HD scores were available for 204 dogs based on the current FCI approved system. However, for a subset of five individuals the hips were scored based on an older Swedish scoring system which was translated into the FCI approved system12,46.
DNA extraction
Genomic DNA was extracted from EDTA blood using the QIASymphony robot (Qiagen, Hilden, Germany) together with the QIAamp DNA Blood Midi Kit (Qiagen, Hilden Germany).
Genome-wide genotyping
Genomic DNA from each dog was genotyped using the Illumina 170 K CanineHD BeadChip based on the CanFam3.1 (Illumina, San Diego, CA, USA)47. Genotyping of samples was performed at the Centre National de Genotypage (France) and NeoGen Genomics genotyping platform (NeoGen Genomics, Lincoln, NE, USA).
Data filtering and visualization of population structure
Data filtering, sex confirmation and visualisation of population structure was performed using the software PLINK v1.90 33. SNPs with a minor allele frequency (MAF) of less than 5% and SNPs which failed to be genotyped in more than 5% of samples were removed (–maf 0.05, –geno 0.05). Individuals with more than 5% genotyping data missing were removed (–mind 0.05). A sex check was performed to assure that the registered sex overlapped with the genotype predicted sex. A MDS plot was generated, and the first two dimensions (C1-C2) were plotted against each other to visualize population structure.
GWAS analysis and visualization
A basic association test was performed with each phenotype using PLINK v1.9033. To account for cryptic relatedness and population structure, a univariate mixed model GWAS analysis was performed using the Genome-wide Efficient Mixed Model Association (GEMMA) software48. The software was used with a centered genotype matrix and Wald test statistics for statistical analysis. QQ-plots and Manhattan plots were generated in RStudio 2022.07.2 using the software package Fastman 49,50. The significance threshold for each association was determined using an LD corrected Bonferroni significance threshold based on the number of SNPs that were not in near-complete LD as determined by evaluating SNPs within 100 kb windows with an R2 > 0.9 as calculated by PLINK v1.90 (–indep 100 10 10)51. The proportion of phenotypic variance explained by the genotyping data (Chip heritability) was calculated for each linear mixed model analysis using GEMMA48.
Additional statistical testing
Statistical testing was performed evaluating differences between phenotypes grouped by associated risk genotype. First, the dependent variables were tested to evaluate if they followed a normal distribution by a D’Agostino-Pearson test. For variables that followed a normal distribution, a one-way ANOVA analysis was performed to evaluate if there were significant differences within the dataset. This was followed by a Tukey’s multiple comparison test to evaluate the difference between individual genotypes, adjusting p-values for multiple testing. The EBVHD was not normally distributed in its native or log transformed format. Hence, differences in EBVHD between genotype groups were tested using a non-parametric Kruskal–Wallis test followed by a Dunn’s multiple comparison test, adjusting p-values for multiple testing. Linear regression analysis was used to evaluate any correlation between age and body weight. Graphical visualisation and analysis of the statistical tests was performed in Prism v. 10.0.2.
Human GWAS comparison
The NHGRI-EBI GWAS catalog was used to evaluate if genes in the associated loci had been implicated in human studies investigating similar phenotypes40.
Ethical approval
All blood samples included in this study were collected with owners informed written consent. Samples were collected in agreement with relevant guidelines and regulations. Ethical approval was granted by the regional animal ethics committee Uppsala ethics committee on animal experiments (Uppsala djurförsöksetiska nämnd) reference numbers: Dnr C12/15, D318/9, C139/9. Methods are reported in accordance with the ARRIVE guidelines.
Data availability
Phenotypic and genotyping data can be downloaded at SciLifeLab https://doi.org/10.17044/scilifelab.25334122.
References
Arendt, M. et al. The ABCC4 gene is associated with pyometra in golden retriever dogs. Sci. Rep. 11, 16647. https://doi.org/10.1038/s41598-021-95936-1 (2021).
Arendt, M. L. et al. Genome-wide association study of golden retrievers identifies germ-line risk factors predisposing to mast cell tumours. PLoS Genet. 11, e1005647. https://doi.org/10.1371/journal.pgen.1005647 (2015).
Karlsson, E. K. et al. Efficient mapping of mendelian traits in dogs through genome-wide association. Nat. Genet. 39, 1321–1328. https://doi.org/10.1038/ng.2007.10 (2007).
Malm, S. et al. Association between radiographic assessment of hip status and subsequent incidence of veterinary care and mortality related to hip dysplasia in insured Swedish dogs. Prev. Vet. Med. 93, 222–232. https://doi.org/10.1016/j.prevetmed.2009.09.017 (2010).
King, M. D. Etiopathogenesis of canine hip dysplasia, prevalence, and genetics. Vet. Clin. North Am. Small Anim. Pract. 47, 753–767. https://doi.org/10.1016/j.cvsm.2017.03.001 (2017).
Wood, J. L., Lakhani, K. H. & Rogers, K. Heritability and epidemiology of canine hip-dysplasia score and its components in Labrador retrievers in the United Kingdom. Prev. Vet. Med. 55, 95–108. https://doi.org/10.1016/s0167-5877(02)00090-9 (2002).
Wang, S. et al. Genetic correlations of hip dysplasia scores for Golden retrievers and Labrador retrievers in France Sweden and the UK. Vet. J. 226, 51–56. https://doi.org/10.1016/j.tvjl.2017.07.006 (2017).
Sallander, M. H., Hedhammar, A. & Trogen, M. E. Diet, exercise, and weight as risk factors in hip dysplasia and elbow arthrosis in Labrador Retrievers. J. Nutr. 136, 2050S-2052S. https://doi.org/10.1093/jn/136.7.2050S (2006).
Krontveit, R. I., Nodtvedt, A., Saevik, B. K., Ropstad, E. & Trangerud, C. Housing- and exercise-related risk factors associated with the development of hip dysplasia as determined by radiographic evaluation in a prospective cohort of Newfoundlands, Labrador Retrievers, Leonbergers, and Irish Wolfhounds in Norway. Am. J. Vet. Res. 73, 838–846. https://doi.org/10.2460/ajvr.73.6.838 (2012).
Anderson, A. Treatment of hip dysplasia. J. Small Anim. Pract. 52, 182–189. https://doi.org/10.1111/j.1748-5827.2011.01049.x (2011).
Dycus, D. L., Levine, D., Ratsch, B. E. & Marcellin-Little, D. J. Physical rehabilitation for the management of canine hip dysplasia: 2021 update. Vet. Clin. North Am. Small Anim. Pract. 52, 719–747. https://doi.org/10.1016/j.cvsm.2022.01.012 (2022).
Hedhammar, A. Swedish experiences from 60 years of screening and breeding programs for hip dysplasia-research, success, and challenges. Front. Vet. Sci. 7, 228. https://doi.org/10.3389/fvets.2020.00228 (2020).
James, H. K., McDonnell, F. & Lewis, T. W. Effectiveness of canine hip dysplasia and elbow dysplasia improvement programs in six UK pedigree breeds. Front. Vet. Sci. 6, 490. https://doi.org/10.3389/fvets.2019.00490 (2019).
Wang, S., Friedrich, J., Strandberg, E., Arvelius, P. & Wiener, P. Methods to improve joint genetic evaluation of canine hip dysplasia across BVA/KC and FCI screening schemes. Front Vet Sci 7, 386. https://doi.org/10.3389/fvets.2020.00386 (2020).
Bartolome, N. et al. A genetic predictive model for canine hip dysplasia: Integration of Genome Wide Association Study (GWAS) and candidate gene approaches. PLoS One 10, e0122558. https://doi.org/10.1371/journal.pone.0122558 (2015).
Mikkola, L. et al. Genetic dissection of canine hip dysplasia phenotypes and osteoarthritis reveals three novel loci. BMC Genom. 20, 1027. https://doi.org/10.1186/s12864-019-6422-6 (2019).
Binversie, E. E., Momen, M., Rosa, G. J. M., Davis, B. W. & Muir, P. Across-breed genetic investigation of canine hip dysplasia, elbow dysplasia, and anterior cruciate ligament rupture using whole-genome sequencing. Front. Genet. 13, 913354. https://doi.org/10.3389/fgene.2022.913354 (2022).
Sanchez-Molano, E. et al. Quantitative trait loci mapping for canine hip dysplasia and its related traits in UK Labrador Retrievers. BMC Genom. 15, 833. https://doi.org/10.1186/1471-2164-15-833 (2014).
Lavrijsen, I. C. et al. Genome wide analysis indicates genes for basement membrane and cartilage matrix proteins as candidates for hip dysplasia in Labrador Retrievers. PLoS One 9, e87735. https://doi.org/10.1371/journal.pone.0087735 (2014).
Mikkola, L. I. et al. Novel protective and risk loci in hip dysplasia in German Shepherds. PLoS Genet. 15, e1008197. https://doi.org/10.1371/journal.pgen.1008197 (2019).
Phavaphutanon, J. et al. Evaluation of quantitative trait loci for hip dysplasia in Labrador Retrievers. Am. J. Vet. Res. 70, 1094–1101. https://doi.org/10.2460/ajvr.70.9.1094 (2009).
Mikkola, L. et al. An across-breed validation study of 46 genetic markers in canine hip dysplasia. BMC Genom. 22, 68. https://doi.org/10.1186/s12864-021-07375-x (2021).
Bruun, C. S., Bank, A., Strom, A., Proschowsky, H. F. & Fredholm, M. Validation of DNA test for hip dysplasia failed in Danish Labrador Retrievers. Anim. Genet. 51, 617–619. https://doi.org/10.1111/age.12951 (2020).
Strandberg, E. et al. Heritability and genetic trend of body weight in dogs of different breeds in Sweden. J. Anim. Sci. 101, 1. https://doi.org/10.1093/jas/skad173 (2023).
Yengo, L. et al. Meta-analysis of genome-wide association studies for height and body mass index in approximately 700000 individuals of European ancestry. Hum. Mol. Genet. 27, 3641–3649. https://doi.org/10.1093/hmg/ddy271 (2018).
Wright, K. M. et al. Age and diet shape the genetic architecture of body weight in diversity outbred mice. Elife 11, 1. https://doi.org/10.7554/eLife.64329 (2022).
McGreevy, P. D. et al. Labrador retrievers under primary veterinary care in the UK: Demography, mortality and disorders. Canine Genet. Epidemiol. 5, 8. https://doi.org/10.1186/s40575-018-0064-x (2018).
Raffan, E., Smith, S. P., O’Rahilly, S. & Wardle, J. Development, factor structure and application of the Dog Obesity Risk and Appetite (DORA) questionnaire. PeerJ 3, e1278. https://doi.org/10.7717/peerj.1278 (2015).
Raffan, E. et al. A deletion in the canine POMC gene is associated with weight and appetite in obesity-prone labrador retriever dogs. Cell Metab. 23, 893–900. https://doi.org/10.1016/j.cmet.2016.04.012 (2016).
Garcia-Marin, L. M. et al. Phenome-wide screening of GWAS data reveals the complex causal architecture of obesity. Hum. Genet. 140, 1253–1265. https://doi.org/10.1007/s00439-021-02298-9 (2021).
Zhou, X. A unified framework for variance component estimation with summary statistics in genome-wide association studies. Ann. Appl. Stat. 11, 2027–2051. https://doi.org/10.1214/17-AOAS1052 (2017).
Schmutz, S. M., Berryere, T. G. & Goldfinch, A. D. TYRP1 and MC1R genotypes and their effects on coat color in dogs. Mamm. Genome 13, 380–387. https://doi.org/10.1007/s00335-001-2147-2 (2002).
Purcell, S. et al. PLINK: A tool set for whole-genome association and population-based linkage analyses. Am. J. Hum. Genet. 81, 559–575. https://doi.org/10.1086/519795 (2007).
Fels, L. & Distl, O. Identification and validation of quantitative trait loci (QTL) for canine hip dysplasia (CHD) in German Shepherd Dogs. PLoS One 9, e96618. https://doi.org/10.1371/journal.pone.0096618 (2014).
Webb, P. R., Doyle, C. & Anderson, N. G. Protein kinase C-epsilon promotes adipogenic commitment and is essential for terminal differentiation of 3T3-F442A preadipocytes. Cell Mol. Life Sci. 60, 1504–1512. https://doi.org/10.1007/s00018-003-2337-z (2003).
Tachmazidou, I. et al. Whole-genome sequencing coupled to imputation discovers genetic signals for anthropometric traits. Am. J. Hum. Genet. 100, 865–884. https://doi.org/10.1016/j.ajhg.2017.04.014 (2017).
Heitkamp, M. et al. Obesity genes and weight loss during lifestyle intervention in children with obesity. JAMA Pediatr. 175, e205142. https://doi.org/10.1001/jamapediatrics.2020.5142 (2021).
Vourdoumpa, A., Paltoglou, G. & Charmandari, E. The genetic basis of childhood obesity: A systematic review. Nutrients 15, 1. https://doi.org/10.3390/nu15061416 (2023).
Speliotes, E. K. et al. Association analyses of 249,796 individuals reveal 18 new loci associated with body mass index. Nat Genet 42, 937–948. https://doi.org/10.1038/ng.686 (2010).
Sollis, E. et al. The NHGRI-EBI GWAS Catalog: knowledgebase and deposition resource. Nucl. Acids Res. 51, D977–D985. https://doi.org/10.1093/nar/gkac1010 (2023).
Chen, L., Wang, Y., Li, S., Zhou, W. & Sun, L. High expression of NDRG3 in osteoarthritis patients. Arthroplasty 3, 1. https://doi.org/10.1186/s42836-020-00064-2 (2021).
Park, K. C., Lee, D. C. & Yeom, Y. I. NDRG3-mediated lactate signaling in hypoxia. BMB Rep. 48, 301–302. https://doi.org/10.5483/bmbrep.2015.48.6.080 (2015).
Morris, J. et al. Genetic variation in CADM2 as a link between psychological traits and obesity. Sci. Rep. 9, 7339. https://doi.org/10.1038/s41598-019-43861-9 (2019).
Yan, X. et al. Cadm2 regulates body weight and energy homeostasis in mice. Mol. Metab. 8, 180–188. https://doi.org/10.1016/j.molmet.2017.11.010 (2018).
Plassais, J. et al. Analysis of large versus small dogs reveals three genes on the canine X chromosome associated with body weight, muscling and back fat thickness. PLoS Genet. 13, e1006661. https://doi.org/10.1371/journal.pgen.1006661 (2017).
Malm, S., Fikse, W. F., Danell, B. & Strandberg, E. Genetic variation and genetic trends in hip and elbow dysplasia in Swedish Rottweiler and Bernese Mountain Dog. J. Anim. Breed Genet. 125, 403–412. https://doi.org/10.1111/j.1439-0388.2008.00725.x (2008).
Lindblad-Toh, K. et al. Genome sequence, comparative analysis and haplotype structure of the domestic dog. Nature 438, 803–819. https://doi.org/10.1038/nature04338 (2005).
Zhou, X. & Stephens, M. Genome-wide efficient mixed-model analysis for association studies. Nat. Genet. 44, 821–824. https://doi.org/10.1038/ng.2310 (2012).
R: A Language and Environment for Statistical Computing (R Foundation for Statistical Computing, 2021).
Paria, S. S., Rahman, S. R. & Adhikari, K. fastman: A fast algorithm for visualizing GWAS results using Manhattan and Q-Q plots. bioRxiv, 2022.2004.2019.488738 (2022). https://doi.org/10.1101/2022.04.19.488738
Hayward, J. J. et al. Complex disease and phenotype mapping in the domestic dog. Nat. Commun. 7, 10460. https://doi.org/10.1038/ncomms10460 (2016).
Funding
Open access funding provided by Uppsala University. Funding was provided by Agria SKK research fund, grant no. N2019-0017.
Author information
Authors and Affiliations
Contributions
M.L.A. planned the study with input from Å.H., K.L.T. and S.M. K.L.T., R.H. and V.D.M. provided genotyping data. M.L.A. and I.N.K. analyzed the data. S.M. provided phenotypic information and S.M., E.S., K.L.T. and Å.H. contributed to the data interpretation. M.L.A. drafted the paper and all authors edited the paper.
Corresponding author
Ethics declarations
Competing interests
The authors declare no competing interests.
Additional information
Publisher's note
Springer Nature remains neutral with regard to jurisdictional claims in published maps and institutional affiliations.
Rights and permissions
Open Access This article is licensed under a Creative Commons Attribution 4.0 International License, which permits use, sharing, adaptation, distribution and reproduction in any medium or format, as long as you give appropriate credit to the original author(s) and the source, provide a link to the Creative Commons licence, and indicate if changes were made. The images or other third party material in this article are included in the article's Creative Commons licence, unless indicated otherwise in a credit line to the material. If material is not included in the article's Creative Commons licence and your intended use is not permitted by statutory regulation or exceeds the permitted use, you will need to obtain permission directly from the copyright holder. To view a copy of this licence, visit http://creativecommons.org/licenses/by/4.0/.
About this article

Cite this article
Kieler, I.N., Persson, S.M., Hagman, R. et al. Genome wide association study in Swedish Labrador retrievers identifies genetic loci associated with hip dysplasia and body weight. Sci Rep 14, 6090 (2024). https://doi.org/10.1038/s41598-024-56060-y
Received:
Accepted:
Published:
DOI: https://doi.org/10.1038/s41598-024-56060-y
Comments
By submitting a comment you agree to abide by our Terms and Community Guidelines. If you find something abusive or that does not comply with our terms or guidelines please flag it as inappropriate.
