
Abstract
Phenotypic variation among populations is thought to be generated from spatial heterogeneity in environments that exert selection pressures that overcome the effects of gene flow and genetic drift. Here, we tested for evidence of isolation by distance or by ecology (i.e., ecological adaptation) to generate variation in early life history traits and phenotypic plasticity among 13 wood frog populations spanning 1200 km and 7° latitude. We conducted a common garden experiment and related trait variation to an ecological gradient derived from an ecological niche model (ENM) validated to account for population density variation. Shorter larval periods, smaller body weight, and relative leg lengths were exhibited by populations with colder mean annual temperatures, greater precipitation, and less seasonality in precipitation and higher population density (high-suitability ENM values). After accounting for neutral genetic variation, the QST–FST analysis supported ecological selection as the key process generating population divergence. Further, the relationship between ecology and traits was dependent upon larval density. Specifically, high-suitability/high-density populations in the northern part of the range were better at coping with greater conspecific competition, evidenced by greater postmetamorphic survival and no difference in body weight when reared under stressful conditions of high larval density. Our results support that both climate and competition selection pressures drive clinal variation in larval and metamorphic traits in this species. Range-wide studies like this one are essential for accurate predictions of population’s responses to ongoing ecological change.
Introduction
Understanding the processes generating variation in ecologically important traits among populations is a central aim of evolutionary ecology. The genetic variation underlying traits can be neutral, that is, with little to no effect on fitness or under natural selection (Holderegger et al. 2006). The simplest model explaining patterns of genetic variation is isolation by distance (IBD), where variation arises from gradual genetic drift and limited gene flow between geographically distant populations (Wright 1943). Much theoretical and empirical evolutionary work has demonstrated the relative importance of IBD in nature (see Whitlock and Phillips 2000). Intraspecies variation can also arise from local adaptation when spatial heterogeneity in the environment results in strong selection pressures overcoming the effects of gene flow and genetic drift (e.g., Schemske and Bierzychudek 2007). Environmental selection pressures can also limit dispersal or breeding between populations to cause genetically distinct, isolated populations (isolation by environment (IBE); Nosil et al. 2005; Wang and Bradburd 2014; Wang and Summers 2010). Phenotypic plasticity, in which environmentally sensitive genotypes can produce alternative phenotypes, has received substantial support in recent research as an important additional process for generating among-population phenotypic variation (DeWitt and Scheiner 2004; Van Buskirk 2017). Often, little is known about the relative contributions of these processes governing interpopulation trait variation across large latitudinal or environmental gradients that make up a species’ range (Lomolino and Heaney 2004), despite the need for better resolution of species’ responses to ongoing ecological change to develop adaptive conservation strategies (Rissler 2016).
Recent advances in spatial modeling have provided opportunities to disentangle processes generating population differentiation. Ecological niche models (ENMs), which leverage the wealth of publicly available species occurrence data and geospatial referenced climate and landscape data, allow researchers to explore where populations and suitable habitats have, do, and may exist in the future by generating predictions of species occurrence (Elith et al. 2011; Phillips et al. 2006). Thus, ENMs provide a framework in which genetic variation can be quantitatively related to multiple ecological parameters. Studies have documented correlations between ENM estimates of habitat suitability and range-wide phenotypic variance (e.g., Cordero and Epps 2012), yet despite substantial support for the utility of niche modeling and spatial statistics in understanding genetic population differentiation across a species range (see review in Thomassen et al. 2010), this approach has yet to be widely applied to understand ecological adaption in quantitative traits across species ranges.
Advances in genetics have also helped to disentangle the evolutionary processes driving intraspecific phenotypic variation. One method used to determine whether phenotypic variation is due to neutral processes such as genetic drift or by selection is comparing interpopulation variation of quantitative traits (QST) to differentiation at neutral genetic markers (FST; Spitze 1993). QST values greater than FST are interpreted as evidence for divergent natural selection, and when values are similar, selection and genetic drift cannot be differentiated (Leinonen et al. 2013a; Whitlock 2008). For species where population genetic data are available, this can be a powerful technique to assess the relative strength of local adaptation and genetic drift in contributing to the divergence of phenotypic traits. When QST estimates vary in concert with specific environmental characteristics, forces of selection could be identified (e.g., Hangartner et al. 2012; Richter-Boix et al. 2013). We suggest that as global change rapidly perturbs the rate and scale of evolutionary and ecological processes, there is an opportunity to combine well-established methods in quantitative genetics and landscape ecology to better elucidate the factors driving trait variation and population divergence.
Geographic clines in amphibians provide an interesting context in which to study factors driving trait variation because amphibian life history is strongly influenced by the external environment (Wilbur and Collins 1973). In this study, we focused on wood frogs (Rana sylvatica) because they occupy a wide range of ecological niches and have demonstrated morphological differences in the wild and under common garden conditions. Previous work has demonstrated population divergence of multiple species in the genus Rana (see review in Morrison and Hero 2003). For example, the moor frog (Rana arvalis) displays phenotypic divergence along a pH gradient, likely due to divergent selection (Hangartner et al. 2012). Orizaola et al. (2010) found adaptive plasticity in the pool frog (Rana lessonae) in response to colder temperatures in populations from high altitudes. The well-studied common frog (Rana temporaria) displays phenotypic variation linked to adaptations to several environmental variables (e.g., Laugen et al. 2003; Lindgren and Laurila 2009; Merilä et al. 2000; Muir et al. 2014; Palo et al. 2003; Richter-Boix et al. 2013). In addition, this species has shown adaptive plasticity in response to important selective pressures such as temperature, pond drying, or low food availability (e.g., Dahl et al. 2012; Lind and Johansson 2011; Richter‐Boix et al. 2015). Altogether, many ranid species appear to display local adaptation and adaptive plasticity to environmental gradients; however, whether these traits are derived from covarying ecological selective gradients acting in concert is a challenge that can be addressed with spatial modeling approaches.
Studies in wood frogs have shown population differentiation in larval life history traits (e.g., larval period, body weight at metamorphosis), suggesting that these traits are affected by nongenetic parental effects, genetic differences among populations, or both (Berven 1982b; Berven and Gill 1983). In the wild, populations of wood frogs have smaller adult body sizes in colder climates and at higher latitudes (Davenport and Hossack 2016; Martof and Humphries 1959; Sheridan et al. 2018). However, previous common garden experiments (Berven 1982b; Berven and Gill 1983) were limited to only a few populations, restricting the ability to infer an ecological gradient, without measures of genetic differentiation; thus, we cannot conclusively distinguish variation derived from local adaptation or genetic drift. Indeed, gene flow appears restricted by geographic distance and landscape resistance among wood frog populations spanning the eastern USA (using both of the genetic distance metrics, linearized FST [r = 0.245; P = 0.018] and cGD [r = 0.140; P = 0.033]; Duncan et al. 2015). In addition, Duncan et al. (2015) found lower genetic diversity in populations in lower habitat suitability along the southern edge of the range, presumably because populations are smaller and more isolated. However, whether this cline in neutral genetic diversity is indicative of population differentiation due to local adaptation still remains an open question. Here, we combine the use of ENMs with QST analyses to test whether variation in early life history traits and phenotypic plasticity among 13 wood frog populations along a climatic gradient spanning 1200 km from the eastern core to the southeastern limit of the species range are driven by local adaptation or genetic drift.
Materials and methods
Study system
Wood frogs have an extensive distribution, which reaches as far south as Alabama, USA, and extends north to the Arctic Circle from Alaska to Newfoundland, Canada (Dorcas and Gibbons 2008; Powell et al. 2016). This wide range encompasses a broad spectrum of climate conditions across ~32° latitude, from extreme cold near the Arctic Circle to high heat and humidity in the southern United States, where annual mean air temperatures span from −7 to 17 °C (Davenport and Hossack 2016). The wood frog’s range can be split into two clades: an eastern clade that encompasses the Appalachian Mountains, the southern American Midwest, Québec, and the Maritime provinces, and a western clade that encompasses the northern American Midwest, the Great Lakes region and western Canada (Lee-Yaw et al. 2008). We focused the current study on the eastern clade to control for evolutionary history.
Characterizing ecological suitability
To derive a comprehensive measure of putative climate and ecological factors exerting selective pressures on wood frog populations, we implemented an ecological niche modeling approach using the program Maxent version 3.3.3 (Phillips et al. 2006). Ecological niche modeling estimates the relative probability of species occurrence; thus, to capture variation in wood frog density across the range, we incorporated an additional analysis to confirm that the probability of occurrence relates to density (see below).
We modeled ecological suitability using site localities obtained from VertNET (www.vertnet.org) and GBIF (GBIF.org. 2014), and then defined a polygon encompassing the entire eastern range in Arc-GIS v10.3. After removing non-georeferenced occurrences, we were left with 1412 unique occurrence points. For the environmental layers in the ENM, we started with 19 bioclimatic variables plus altitude (Hijmans et al. 2005). Environmental variables were clipped to North America to avoid overfitting of the model by placement of pseudoabsence point localities. All variables were then reprojected to the Albers equal-area conic projection, so every cell on the gridded map would represent the same amount of geographic space. Because the bioclimatic variables are potentially correlated, we checked for correlations in and removed variables which were correlated at higher than 0.75 (Dormann et al. 2013). Seven environmental variables remained: elevation, mean annual temperature, mean diurnal range, temperature annual range, mean temperature of wettest quarter, precipitation seasonality, and annual mean precipitation. Unique occurrence records and environmental layers were then used to generate a logistic output, which consists of a gridded map with each cell having a value of relative probability of occurrence, a correlate of habitat suitability, between zero and one where higher values reflect more suitable conditions for the wood frog. We ran 20 replicates and auto-features (option that automates the task of choosing feature types using an algorithm based on sample size), and model fit was assessed with AUC. Jackknife analysis was performed to assess individual environmental layer importance and contribution. With ecological suitability values in mind, we chose putative wood frog populations to compare performance within the common garden experiment (described below).
Although in most cases local abundance and ENM suitability are positively related (Weber et al. 2017), we validated that our ENM reflects density of wood frog populations by extracting habitat suitability estimates for 2451 localities where wood frog call surveys were performed from 1999 to 2019. We obtained datasets through the North American Amphibian Monitoring Program (https://www.usgs.gov/centers/pwrc/science/north-american-amphibian-monitoring-program; 2001–2016) and FrogWatch (https://frogwatch.fieldscope.org/). The intensity of calling male wood frogs has been found to directly correlate with the number of egg masses, thus providing an index of effective population size (Stevens and Paszkowski 2004). Because these data span two decades, they provide a better estimate of population density than one year’s count of egg masses, which significantly varies within populations among years. The survey uses an ordinal factor for estimating the intensity of frog calls (see methods in Weir 2001); therefore, we analyzed the correlation between ENM value and calling intensity using an ordered logistic regression in R (version 3.6.1 (R Core Team 2020); function polr in the package MASS (Venables and Ripley 2002); and the plot function with Effect in the package effects (Fox and Weisberg 2019). We found that ecological suitability was associated with calling intensity in acoustic survey datasets (t = 4.965, P < 0.001); specifically, the probability of hearing the highest score for calling intensity (3 = full chorus of overlapping calls) increased with ENM value, and the probability of hearing the lowest score (1 = individuals can be counted, space between calls) decreased with ENM value (Fig. S1). This suggests that the ecological suitability measure derived from our ENM accurately reflects the density of wood frog populations on the landscape. Therefore, throughout our analyses of phenotypic variance and IBE, we use ecological suitability as an index of both the climatic gradient and population density across our study populations.
Common garden experiment
The experiment was conducted in an indoor aquatic animal facility that was maintained at 14.8 °C (range 12.5–18 °C) with a 13L/11D light cycle (using full-spectrum lights). We chose 15–16 °C as the temperature was intermediate within ranges experienced across populations of interest to this study (0–22 °C in New York, Lenker et al. 2014; 8–26 °C in Virginia, Rice and Jung 2004). Plastic tanks were prepared by allowing treated spring water (NovAqua Plus Water Conditioner; Kordon, Hayward, CA, USA) and dry leaf litter to condition in tanks for 7 days before animals were added (oak and maple leaves collected in Pullman, WA, USA, sorted to remove macro invertebrates).
We collected eggs (within 1 day of fertilization) from each of 13 populations ranging in habitat suitability from 0.131 to 0.693 (see Tables S1 and S2 for locations and permitting information in Supplementary Information; Fig. 1). At each site, we haphazardly selected 200 eggs (20 eggs each from 10 clutches) to capture genetic variation across families. Eggs were shipped overnight on ice to Washington State University (WSU), WA, USA; eggs arrived at WSU asynchronously because breeding dates ranged from January to March across the latitudinal gradient with more northern populations breeding later in the year. Because we did not breed adults in the laboratory, we cannot rule out any maternal or early environmental effects on phenotypic patterns; however, we did our best to standardize shipping and treatment of populations. Once eggs arrived, they were incubated in pond water combined with treated tap water in an environmental chamber at 11 °C until ca. 95% of eggs had hatched.

Ecological suitability values are represented as a color gradient with darker shades representing higher suitability values. IUCN range limits for wood frogs are represented by a dashed line. See Table S1 in Supplemental Materials for specific geographic locations of each site.
To examine the contribution of plasticity to population variance in developmental traits, populations were compared at high and low larval density. From each population, 80 hatchlings were haphazardly selected and placed in one 200 L plastic tank (1 tadpole/2.5 L; hereafter “low-density”) and 40 hatchlings were placed in one 37 L plastic tank (1 tadpole/0.925 L; hereafter “high-density”). Of the 13 populations raised at low-density, 12 were also reared at high-density. Note that each population had one replicate tank for each treatment to maximize the number of population comparisons. Besides larval density, tanks also differed in food availability to replicate physiologically stressful conditions for this species (Crespi and Warne 2013). High-density tanks received 0.5 L of leaf litter at the start of the experiment and 1 g of crushed alfalfa pellets twice a week, compared to low-density tanks which received 2 L of leaf litter at the start and 5 g of crushed alfalfa pellets twice a week. The high-density tanks needed water changes weekly to maintain quality by replacing half from a reservoir of conditioned spring water, whereas the 200 L tanks maintained high water quality without water changes. We checked water quality using Tetra Easy Strips (Spectrum Brands; Blacksburg, VA) and nitrate and nitrite levels were below detection, and ammonia levels stayed below 0.25 mg/L. High-density tanks were maintained on a shelf unit in the same room as the low-density tanks and were rotated weekly to eliminate shelf effect.
Midway through the experiment, we counted tadpoles to assess mortality. Because densities varied at this point, ranging from about half to all surviving, we added supplementary animals from the same population that were held in separate small plastic tanks to maintain stocking densities, thereby minimizing differences in growth and developmental rates that result from differences in density (Berven and Gill 1983). These supplemental animals were marked with elastomers for identification (Warne and Crespi 2015) so they could be excluded from subsequent data analyses. Survival to the midway census and to metamorphosis varied among populations but was not related to population ecological suitability (Poisson regression: P = 0.88 and P = 0.8, respectively; see Table S1 for variation in survival to metamorphosis and variation in sample size for metamorphic traits). When forelimbs emerged at metamorphic climax (Gosner stage 42, Gosner 1960), animals were removed from tanks and housed individually in a 750 mL plastic container with one end elevated such that 0.5 cm of water was at the low end.
When an individual had less than 2 mm of tail remaining (Gosner stage 46), it was blotted dry, weighed to nearest 0.01 g, and placed in a plastic bag to measure snout-vent length (SVL) and femur length to the nearest 0.01 mm. Weight at metamorphosis and larval period are important life history traits for amphibians (Semlitsch et al. 1988; Wilbur and Collins 1973) and previous common garden experiments of wood frogs show differences among populations (Berven 1982a; Berven and Gill 1983). Because other amphibian species display geographic variation in leg length (Alho et al. 2011; Laugen et al. 2005), we compared femur to SVL ratios among populations. Note that this trait is highly correlated with body weight and SVL, but we could not use the residuals of the linear regression of femur length on SVL because the slopes varied among populations (see Fig. S2).
Statistical analyses
Analyses were performed in R version 3.6.1 (R Core Team 2020). To determine whether traits varied by ecological suitability and larval density, we used univariate linear mixed models of each trait (larval period, weight at metamorphosis, growth rate, and femur–SVL ratio), with an interaction between ENM suitability and larval density (high or low), fit with population as a random variable. In all models, we included the average temperature history of each individual (average temperature over larval period) because the room temperature fluctuated throughout the experiment.
To test the relative importance of divergent natural selection and neutral genetic processes in trait divergence, we compared the population structure of quantitative phenotypic trait variation (QST) to neutral genetic variation, FST (Kawakami et al. 2011; Leinonen et al. 2013b; reviewed in Merilä and Crnokrak 2001; QST: Spitze 1993). We calculated pairwise quantitative trait divergence, QST (Spitze 1993), for body weight at metamorphosis, larval period length, and femur–SVL ratio adjusted for the effect of average temperature during the larval period by using the residuals of each trait against temperature in QST estimates; these adjustments were made to remove the effect of factors reflective of experimental conditions. Note, these QST estimates are in essence PST (Leinonen et al. 2006), because we could not perform a full-sib design with this large number of populations and two larval density treatments. QST estimates may therefore be biased by early environmental effects (at egg laying), maternal or nonadditive genetic effects. We used the equation QST = σ2B/(σ2B + 2σ2W), and the between (B) and within (W) population variance components were calculated using REML in linear regressions with the lme4 package (Bates et al. 2015). We used pairwise population FST values derived from 12 microsatellite loci for the 13 populations in this analysis from Duncan et al. (2015), which showed moderate population differentiation (range: 0.043–0.106). If QST values are no different from neutral FST values, then trait divergence among populations could be achieved by genetic drift alone, while evidence for local adaptation is determined as QST values significantly exceeding FST values (Whitlock 2008).
To test the null hypothesis that QST estimates were no different than the expected QST distribution of possible values expected for a neutrally evolving trait, we followed the approach of Whitlock and Guillaume (2009). We first examined correlations among pairwise QST values for each trait against FST values using Mantel tests. Then, we tested whether the QST–FST estimates for each trait differed from neutral expectations using the R script provided by Richter-Boix et al. (2013) and Lind et al. (2011), which simulates the distribution of QST–FST values to compare with the observed global QST–FST values. If observed global QST–FST values significantly exceed 95% of the simulated distributions, the null hypothesis of neutral variation can be rejected.
If traits are locally adapted to ecological conditions (i.e., IBE model), we would expect phenotypic variation to have a stronger association with an ecological gradient than geographic distance alone (i.e., IBD model). As described above, ecological distance was calculated as the absolute difference in ecological suitability values between sites derived from our ENM, while geographic distance was calculated as the geodesic distance between coordinates using the geodist package (Padgham and Sumner 2020). Before testing IBD and IBE models, we first tested for evidence of gene flow along the ecological gradient by comparing the pairwise FST matrix and ecological distance matrix while accounting for the correlation in geographic distance using a partial Mantel test (100,000 permutations; package ncf (Bjornstad 2020)). Note that multicollinearity can cause high rates of type-I errors in partial Mantel tests (Kierepka and Latch 2015; Raufaste and Rousset 2001); however, at moderate correlation strengths between independent matrices, Castellano and Balletto (2002) estimated lower error rate using the partial Mantel test than simple Mantel tests. Despite this caveat, partial Mantel tests continue to be a standard approach to partial out geographic distance from ecological distance when assessing the influence of IBE (Shafer and Wolf 2013; Wang and Bradburd 2014). To compare models of IBE and IBD, we used Mantel tests (100,000 permutations; vegan package (Oksanen et al. 2019) of pairwise QST and pairwise differences in QST–FST against both geographic and ecological distance. Due to the correlation between geographic and ecological distance (Mantel’s r = 0.623, P < 0.001; populations further apart tend to have greater climatic differences), we then performed partial Mantel tests (100,000 permutations; package ncf) which allows comparisons among two variable matrices while accounting for a third (Mantel 1967), to determine which variable best explains phenotypic divergence.
Lastly, because wood frogs have density-dependent development (Wilbur 1976) and higher ecological suitability scores are predicted to have greater population density (see above), we were interested in determining whether populations vary in density-dependent development across populations. For the 12 populations which were also reared at a higher density, we conducted separate analyses testing IBE and IBD models for the same traits expressed under high-density conditions. We also compared survival to 3 months post metamorphosis using a mixed effects Cox model (package coxme; Therneau 2018) with population as a random variable and the interaction between larval density and ecological suitability as fixed effects.
Results
Defining the ecological gradient
ENM predictions for the probability of wood frog population occurrence/ density over the eastern USA are mapped in Fig. 1. The percent contribution and permutation importance values for the six bioclimatic layers and altitude are presented in Table S3. The environmental variable with highest gain when used in isolation is precipitation seasonality, and the variable that decreases the gain the most when it is omitted is mean annual temperature. The mean annual temperature of our sites ranges from 8.8 to 14.1 °C, and the precipitation seasonality ranges from 9.8 to 18% (see maps showing only these variables in Figs. S3 and S4). The predicted relative probability of occurrence was greatest (>0.5) when precipitation seasonality was <20% CV, mean annual temperature was between 4 and 10 °C, and mean annual precipitation was between 700 and 1200 mm. The minimum probability (<0.1) was predicted when precipitation seasonality was >60% CV, temperature was >14 °C and <−7 °C, and precipitation was <400 mm. The AUC value for the model was 0.897 ± 0.014 (SD).
Phenotypic variation along the ecological gradient
Phenotypic traits measured at metamorphosis varied with ecological suitability depending on larval density (Fig. 2; Table 1). When comparing populations at low larval density, those from higher suitability sites had shorter larval periods, smaller body weights at metamorphosis, and shorter femur ratios than those from lower suitability sites. Specifically, the larval period was on average 23 days (24%) longer and frogs were 0.23 g (29%) larger in body weight when comparing the populations from the lowest suitability to the highest (0.1–0.7). In response to high larval density, low-suitability populations exhibited similarly long larval periods, but much lower body weight compared to their low-density counterparts, whereas the high-suitability populations were similarly sized at metamorphosis after only slightly longer larval period in the high-density treatment (LMER interaction: P = 0.059). The smaller effect of high-density on weight at metamorphosis in high-suitability populations was achieved by faster growth rates compared to low-suitability populations. Specifically, the high-density larvae from the lowest suitability population exhibited a 66% slower growth rate, while the highest suitability population only had 38% slower growth rate compared to their low-density counterparts. Across both densities, femur–SVL ratio was negatively related to ecological suitability scores. We also found low-suitability compared to high-suitability populations suffered lower postmetamorphic survival when reared at high-density (Fig. 2; Fig. S5), in that there was an interaction between ecological suitability score and larval density on survival to 90 days (12 populations; ENM × larval density interaction: exp(β) = 5.403, z = 2.27, P = 0.023; ENM: exp(β) = 0.246, z = −1.45, P = 0.037, larval density: exp(β) = 0.260, z = −4.29, P < 0.001).
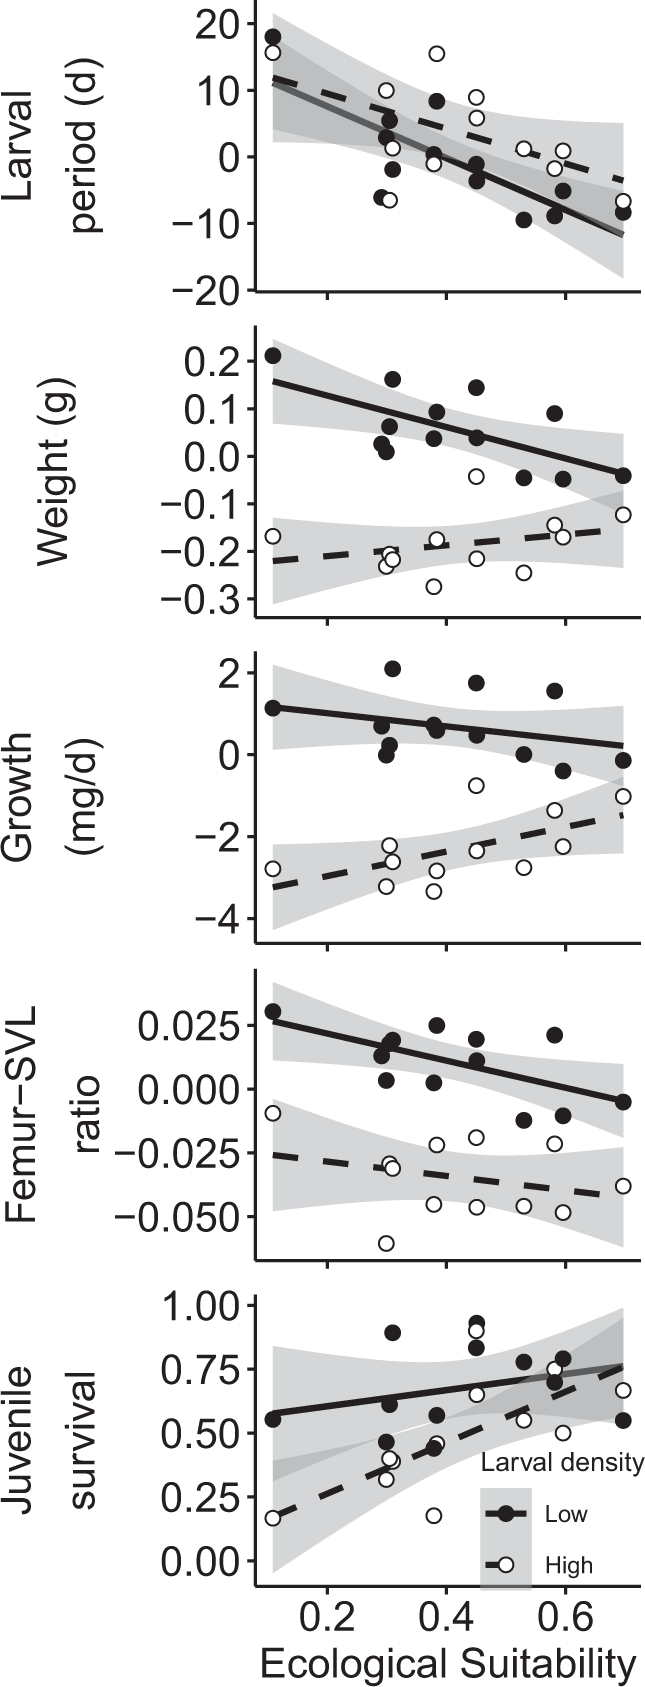
The fitted partial regression means, adjusted for covariance in average temperature by ENM values for the natal pond for each trait (13 and 12 populations with 47–86 and 5–24 frogs/population in low-density and high-density, respectively). Diagonal lines (solid and dashed for low-density and high-density, respectively) and shading indicate linear regressions and 95% confidence intervals (shaded area).
Ecologically mediated natural selection
We found that FST was not correlated with ecological distances when geographic distance is accounted for (Mantel r = 0.133, P = 0.255), as expected for neutral genetic markers. Evidence for local adaptation was exhibited in four traits at low-density. Specifically, larval period, growth, weight, and femur–SVL ratio (P < 0.001) displayed greater QST values than FST, because the observed global QST–FST values were significantly above 95% of the simulated neutral distribution (Fig. 3). Only QST values for weight at low-density were correlated with FST values, thus we performed a partial mantel test and found when accounting for variation in FST, QST values were related to ecological distance (r = 0.385, P = 0.010).

Histograms of simulated QST–FST distributions for each trait represent the null hypothesis of neutral variation, while the arrow indicates observed global QST–FST values for each trait. Only low-density treatment shown, but high-density individuals show the same trends for each trait.
Of the traits in which we compared phenotypic divergence (QST–FST), larval period and body weight at low larval density were related to both ecological and geographic distance among populations, while variation in femur–SVL ratio was only related to ecological distance (Mantel tests, Table 2, Fig. 4). When reared at high-density, phenotypic variation appears unrelated to either ecological or geographic distance, except larval period, which exhibited an IBD effect. While accounting for correlations with geographic distance, QST–FST pairwise differences of larval period, weight, and femur–SVL ratio were correlated with ecological distance at low-density (partial mantel tests; Table 3). At high-density, however, IBD explained variation in larval period, and variation in weight was negatively associated with ecological distance.

Points are pairwise QST–FST values, calculated using fitted partial regression means adjusted for covariance in average temperature, and lines represent linear regressions, compared at low-density (filled points, solid lines) and high-density (open points, dashed lines). Red horizontal lines indicate at or below which phenotypic variance is not due to natural selection (QST = FST).
Discussion
Population differentiation is a result of interactions between genetic, nongenetic parental effects, and environmental factors that lead to variation in fitness and phenotypes (Mitchell-Olds et al. 2007). Disentangling the relative contributions of neutral and selective processes is necessary for accurate predictions of population and species responses to rapid global change. Previous work demonstrated population variation in heritable, fitness-linked traits (Berven and Gill 1983), and genetic diversity among wood frog populations (Duncan et al. 2015), but whether these patterns were due to largely neutral or selective processes was unknown. Our QST–FST analysis of animals from 13 populations spanning 1200 km and 7° of latitude reared in common garden conditions showed, after accounting for neutral genetic variation, larval period, body weight, and femur–SVL ratio are locally adapted traits. Using spatially explicit ecographic data and partial Mantel tests, we showed that variation in these traits was more strongly associated with an ecological gradient representing both climate and population density than geographic distance, supporting the IBE hypothesis. Further, the relationship between ecology and metamorphic traits was dependent upon larval density. Larvae from higher suitability/higher density populations were less sensitive to density-dependent development; in that larval growth, body weight at metamorphosis and postmetamorphic survival were conserved despite greater conspecific competition. These findings support the hypothesis that wood frog populations are under selection from several climactic gradients that comprise the ecological niche in addition to population density.
Climate imposes constraints on amphibian development, such as hydroperiod length of the larval environment, driving local adaptation in growth and development rates (Berven and Gill 1983; Denver 1997; Smith-Gill and Berven 1979). Many northern ranging ectotherm species appear under selection to complete larval development before the onset of winter, shown by northern populations developing faster when reared in a common environment (reviewed in Conover and Schultz 1995; e.g., Orizaola et al. 2010). Previous observations in wild wood frog populations and under common garden conditions in three geographically separated populations found those from higher latitudes generally had shorter larval periods (Berven and Gill 1983), suggesting that wood frogs display countergradient variation similar to other anurans (Orizaola et al. 2010). We expand these previous findings by demonstrating that clinal variation in larval period is related to several climactic variables. Unlike body weight, larval period was not affected by high larval density, similar to findings in other ranid species exposed to other environmental stressors (e.g., Laurila et al. 2002; Merilä et al. 2000). Because body size mediates a multitude of physiological and ecological processes (Peters and Peters 1986), this trait is generally positively associated with fitness, but life history theory predicts that directional selection for increased body size will be countered by trade-offs with developmental time (Kingsolver and Pfennig 2004; Roff 1980). Our study suggests stronger selection on weight at metamorphosis than larval period in wood frogs, similar to general trends among taxa (Kingsolver and Diamond 2011). Therefore, selection from growing season constraints may cause a trade-off between larval period and body weight. Because weight at metamorphosis in our common garden reflected the geographic variation in adult body weights (i.e., negatively correlated with latitude; Davenport and Hossack 2016), this trait likely confers fitness advantages under climate and density constraints across the range of this species.
Previous researchers have hypothesized several nonmutually exclusive mechanisms to explain clinal patterns of amphibian body size that depend on either climate (temperature and humidity) or resources (limited by growing season or competition), based on general trends among (Olalla-Tárraga and Rodríguez 2007) and within species (Adams and Church 2008; Ashton 2002; Laugen et al. 2005). In one analysis of body size comparisons among North American anurans, wood frogs were outliers to the trend of relatively larger body sizes of species with more northern ranges (see Laugen et al. 2005 and references therein for more species that do not follow this trend), and authors suggest their freezing tolerance adaptation explains why they oppose this trend (Amado et al. 2019). This freezing tolerance hypothesis is supported by a comparison between adult frogs from Alaska and Ohio, in which physiological freeze tolerance adaptations were associated with smaller body size (Costanzo et al. 2013). Studies across multiple insect species that show larger individuals within and between populations freeze at higher temperatures than smaller individuals, suggesting larger bodied ectotherms may experience a shorter active season (reviewed in Hahn et al. 2008). In addition, Fitzpatrick et al. (2019) demonstrated that winter energy expenditure for adult wood frogs was negatively related to body size through mechanistic modeling. Further research that systematically tests wood frog winter energy expenditures within and between populations is needed to support the freeze tolerance hypothesis, which could explain why wood frogs and mink frogs (Rana septentrionalis), a closely related sympatric species that does not freeze but instead hibernates below the frostline, display opposite geographic body size clines (Schueler 1975).
Conversely, the water conservation hypothesis proposes larger amphibians conserve more water per unit of body surface than smaller individuals (Gouveia and Correia 2016); thus, according to this hypothesis we would predict larger amphibians in warmer climates. In support of this hypothesis, we found that weight at metamorphosis was larger for wood frogs from populations with lower suitability habitats where the potential evapotranspiration rate is greater due to warmer annual temperatures and more precipitation seasonality. Further, population variation in critical thermal maximums of wood frogs appears strongly influenced by variation in body size (Manis and Claussen 1986). In addition to larger body sizes, shorter extremities can reduce water loss in some environmental conditions (Alho et al. 2011; Allen 1877); this hypothesis is not supported by our findings because femur–SVL ratios are larger in warmer, drier climates, however this trait appears under selection by ecology. Note that femur–SVL ratios are correlated with body size and weight, therefore selection may be acting on all or only one of these traits. Mechanistic models similar to Fitzpatrick et al. (2019) could test for geographic variation in potential dehydration stress across the wood frog range and determine the relative roles of energy expenditure during winter and water loss in the summer in driving local adaptations found in our study.
In their study of wood frog body size changes as the climate warmed over the 20th century, Sheridan et al. (2018) suggested climate may not be the main driver of size evolution, and alluded to the potential role of population density regulating body size changes. Density-dependent resource availability is a selective pressure that drives smaller body sizes, as seen in experimental evolution of Drosophila (reviewed in Mueller 1997; e.g., Santos et al. 1997) and in theoretical models that incorporate feedback between density-dependent larval growth and size-dependent survival on population structure (Chaparro-Pedraza and de Roos 2020). In support of this, we found smaller frogs originating from greater population density regions of the range. This suggests that wood frogs may experience higher size-dependent mortality in high-suitability/high-density landscapes, which drives greater density in the larval habitat, thus triggering a faster developmental rate to escape increased larval competition. Indeed, Davenport and Hossack (2016) found in range-wide surveys that wood frog populations in northern latitudes consist of smaller females that lay smaller but a greater number of eggs. This could result in greater larval density in northern latitudes, and given our finding of similar survival of northern (generally high suitability) populations raised at high-density and low-density, juvenile density could also be greater. Because one previous study suggested that survival and reproductive fitness of adults was negatively correlated with juvenile and adult density (Berven 2009), future work should examine whether populations across this gradient vary in the sensitivity of adult reproductive fitness to population density. Altogether, we posit that climate and competition are intertwined selection pressures driving evolution in this species.
Wood frog populations also exhibited a loss of plasticity in growth rate and weight at metamorphosis in response to varying larval density in populations of high suitability/density, whereas populations from low suitability/density showed a strong reduction in these traits with high-density. Other ranid species also appear to be under selection for rapid development at the expense of plasticity, for example, populations of R. temporaria from high desiccation risk environments (Laurila et al. 2002). It is possible that consistently high densities over generations have been selected for a loss of plasticity in these traits, along with the changes in behavioral, biochemical, or physiological traits that allow them to adaptively respond to high-density conditions (Pigliucci 2001). This is supported by higher postmetamorphic survival of frogs from high-density compared to low-density regions of the range when raised at high larval density. For this reason, we also consider the carryover effect of a reduction in weight with high-density exhibited by low-suitability/density populations to reflect maladaptive plasticity. High-suitability populations perhaps have some physiological adaptations to cope with high-density, such as a reduction of the stress response (e.g., a lack of the typical glucocorticoid response to density observed in a population from the high suitability/density region of the range; Belden et al. 2007). Conversely, high-density could be more stressful to low-suitability populations at the southern extent of the range where animals may not experience high larval densities. This is supported by lower heterozygosity and allelic richness in low-suitability compared to high-suitability populations (Duncan et al. 2015), and therefore, they may not have the needed adaptive genetic variation for an evolutionary response. At the low-suitability range edges, inbreeding depression could cause a loss in individual fitness and, consequently, the reduced tolerance of low-suitability populations to environmental stress (Bijlsma and Loeschcke 2012). Additional work is needed to demonstrate that wood frog populations differ in juvenile/adult size-dependent mortality and physiological responses to larval crowding; however, our findings suggest that population structure feedback could cause the interpopulation variation in weight at metamorphosis.
Altogether, divergence in wood frog larval period and weight at metamorphosis are best explained by the combination of climate-related and demographic hypotheses: shorter growing seasons in high-suitability regions limit developmental timing, a greater need for water conservation in low-suitability areas selects for higher weight, and population density selects for lower weight and lower sensitivity to density-dependent development. Further, clinal variation in metamorphic traits found here appear directly related to the gradient found in adult body size (Davenport and Hossack 2016), not surprisingly given that weight at metamorphosis is related to adult weight in two populations (Berven 1990). Future studies will need to determine whether variation in traits found in this study confer variation in fitness at adult stages at varying climate and population density conditions. These environment-dependent results add to the growing acknowledgement that QST–FST comparisons under only one environmental condition may be misleading (e.g., Laurila et al. 2002; Richter-Boix et al. 2010), and quantitative genetics studies should include varying biotic and abiotic gradients to better understand natural selection. Although this experiment was conducted at one temperature and photoperiod length and could not separate nongenetic parental and genetic effects, the high-resolution range-wide variation in phenotypic plasticity and fitness-linked traits presented here is critical for predicting species’ responses to ongoing ecological change (Rissler 2016). These findings suggest that the pressure of higher density could pose a significant hurdle for populations in southern regions migrating north when the southern edge becomes less habitable. Future work employing recent advances such as sequencing SNPs (e.g., RADseq) or transcript abundance (transcriptional QST) would be able to detect loci or gene expression differences underlying local adaptations found in our study. Statistical approaches for genomic data such as environmental association analysis, redundancy analysis, or latent factor mixed models would also be able to discern thresholds where climate-mediated selection is likely to be strong.
Data availability
All data used in our analyses are deposited in the Dryad Digital Repository (https://doi.org/10.5061/dryad.gf1vhhmnp).
References
Adams DC, Church JO (2008) Amphibians do not follow Bergmann’s rule. Evol: Int J Org Evol 62(2):413–420
Alho J, Herczeg G, Laugen A, Räsänen K, Laurila A, Merilä J (2011) Allen’s rule revisited: quantitative genetics of extremity length in the common frog along a latitudinal gradient. J Evol Biol 24(1):59–70
Allen JA (1877) The influence of physical conditions in the genesis of species. Radic Rev 1:108–140
Amado TF, Bidau CJ, Olalla-Tárraga MÁ (2019) Geographic variation of body size in New World anurans: energy and water in a balance. Ecography 42(3):456–466
Ashton KG (2002) Do amphibians follow Bergmann’s rule? Can J Zool 80(4):708–716
Bates D, Maechler M, Bolker B, Walker S (2015) Fitting linear mixed-effects models using lme4. J Stat Softw 67(1):1–48. https://doi.org/10.18637/jss.v067.i01
Belden LK, Rubbo MJ, Wingfield JC, Kiesecker JM (2007) Searching for the physiological mechanism of density dependence: does corticosterone regulate tadpole responses to density? Physiol Biochem Zool 80(4):444–451
Berven KA (1982a) The genetic basis of altitudinal variation in the wood frog Rana sylvatica II. An experimental analysis of larval development. Oecologia 52(3):360–369
Berven KA (1982b) The genetic basis of altitudinal variation in the wood frog Rana sylvatica. I. An experimental analysis of life history traits. Evolution 36(5):962–983
Berven KA (1990) Factors affecting population fluctuations in larval and adult stages of the wood frog (Rana sylvatica). Ecology 71(4):1599–1608
Berven KA (2009) Density dependence in the terrestrial stage of wood frogs: evidence from a 21-year population study. Copeia 2009(2):328–338
Berven KA, Gill DE (1983) Interpreting geographic-variation in life-history traits. Am Zool 23(1):85–97
Bijlsma R, Loeschcke V (2012) Genetic erosion impedes adaptive responses to stressful environments. Evol Appl 5(2):117–129
Bjornstad ON (2020) ncf: spatial covariance functions. R package version 1.2-9. https://cran.r-project.org/package=ncf
Castellano S, Balletto E (2002) Is the partial Mantel test inadequate? Evolution 56(9):1871–1873
Chaparro-Pedraza PC, de Roos AM (2020) Density-dependent effects of mortality on the optimal body size to shift habitat: Why smaller is better despite increased mortality risk. Evolution 74(5):831–841
Conover DO, Schultz ET (1995) Phenotypic similarity and the evolutionary significance of countergradient variation. Trends Ecol Evol 10(6):248–252
Cordero GA, Epps CW (2012) From desert to rainforest: phenotypic variation in functionally important traits of bushy-tailed woodrats (Neotoma cinerea) across two climatic extremes. J Mamm Evol 19(2):135–153
Costanzo JP, do Amaral MCF, Rosendale AJ, Lee RE (2013) Hibernation physiology, freezing adaptation and extreme freeze tolerance in a northern population of the wood frog. J Exp Biol 216(18):3461–3473
Crespi EJ, Warne RW (2013) Environmental conditions experienced during the tadpole stage alter post-metamorphic glucocorticoid response to stress in an amphibian. Integr Comp Biol 53(6):989–1001
Dahl E, Orizaola G, Nicieza AG, Laurila A (2012) Time constraints and flexibility of growth strategies: geographic variation in catch‐up growth responses in amphibian larvae. J Anim Ecol 81(6):1233–1243
Davenport JM, Hossack BR (2016) Reevaluating geographic variation in life‐history traits of a widespread Nearctic amphibian. J Zool 299(4):304–310
Denver RJ (1997) Environmental stress as a developmental cue: corticotropin-releasing hormone is a proximate mediator of adaptive phenotypic plasticity in amphibian metamorphosis. Horm Behav 31(2):169–179
DeWitt TJ, Scheiner SM (2004) Phenotypic plasticity: functional and conceptual approaches. Oxford University Press, New York, NY USA
Dorcas ME, Gibbons JW (2008) Frogs and Toads of the Southeast. University of Georgia Press, Athens, GA, USA
Dormann CF, Elith J, Bacher S, Buchmann C, Carl G, Carré G et al. (2013) Collinearity: a review of methods to deal with it and a simulation study evaluating their performance. Ecography 36(1):27–46
Duncan SI, Crespi EJ, Mattheus NM, Rissler LJ (2015) History matters more when explaining genetic diversity within the context of the core–periphery hypothesis. Mol Ecol 24(16):4323–4336
Elith J, Phillips SJ, Hastie T, Dudík M, Chee YE, Yates CJ (2011) A statistical explanation of MaxEnt for ecologists. Diversity Distrib 17(1):43–57
Fitzpatrick MJ, Zuckerberg B, Pauli JN, Kearney MR, Thompson KL, Werner LC et al. (2019) Modeling the distribution of niche space and risk for a freeze‐tolerant ectotherm, Lithobates sylvaticus. Ecosphere 10(7):e02788
Fox J, Weisberg S (2019) An R Companion to Applied Regression, 3rd Edition. Sage, Thousand Oaks, CA
GBIF.org (2014) GBIF Occurrence Download. https://doi.org/10.15468/dl.e3k4ag
Gouveia SF, Correia I (2016) Geographical clines of body size in terrestrial amphibians: water conservation hypothesis revisited. J Biogeogr 43(10):2075–2084
Hahn DA, Martin AR, Porter SD (2008) Body size, but not cooling rate, affects supercooling points in the red imported fire ant, Solenopsis invicta. Environ Entomol 37(5):1074–1080
Hangartner S, Laurila A, Rasanen K (2012) Adaptive divergence in moor frog (Rana arvalis) populations along an acidification gradient: inferences from Q(st) -F(st) correlations. Evolution 66(3):867–881
Hijmans R, Cameron S, Parra J, Jones P, Jarvis A, Richardson K (2005) WorldClim version 1.3. University of California, Berkeley
Holderegger R, Kamm U, Gugerli F (2006) Adaptive vs. neutral genetic diversity: implications for landscape genetics. Landsc Ecol 21(6):797–807
Kawakami T, Morgan TJ, Nippert JB, Ocheltree TW, Keith R, Dhakal P et al. (2011) Natural selection drives clinal life history patterns in the perennial sunflower species, Helianthus maximiliani. Mol Ecol 20(11):2318–2328
Kierepka E, Latch E (2015) Performance of partial statistics in individual‐based landscape genetics. Mol Ecol Resour 15(3):512–525
Kingsolver JG, Diamond SE (2011) Phenotypic selection in natural populations: what limits directional selection? Am Naturalist 177(3):346–357
Kingsolver JG, Pfennig DW (2004) Individual-level selection as a cause of cope’s rule of phyletic size increase. Evolution 58(7):1608–1612
Laugen AT, Laurila A, Jönsson KI, Söderman F, Merilä J (2005) Do common frogs (Rana temporaria) follow Bergmann’s rule? Evol Ecol Res 7(5):717–731
Laugen AT, Laurila A, Räsänen K, Merilä J (2003) Latitudinal countergradient variation in the common frog (Rana temporaria) development rates–evidence for local adaptation. J Evol Biol 16(5):996–1005
Laurila A, Karttunen S, Merila J (2002) Adaptive phenotypic plasticity and genetics of larval life histories in two Rana temporaria populations. Evolution 56(3):617–627
Lee-Yaw JA, Irwin JT, Green DM (2008) Postglacial range expansion from northern refugia by the wood frog, Rana sylvatica. Mol Ecol 17(3):867–884
Leinonen T, Cano JM, Mäkinen H, Merilä J (2006) Contrasting patterns of body shape and neutral genetic divergence in marine and lake populations of threespine sticklebacks. J Evol Biol 19(6):1803–1812
Leinonen T, McCairns RJ, O’Hara RB, Merila J (2013a) Q(ST)-F(ST) comparisons: evolutionary and ecological insights from genomic heterogeneity. Nat Rev Genet 14(3):179–190
Leinonen T, McCairns RS, O’hara RB, Merilä J (2013b) Q ST–F ST comparisons: evolutionary and ecological insights from genomic heterogeneity. Nat Rev Genet 14(3):179
Lenker MA, Savage AE, Becker CG, Rodriguez D, Zamudio KR (2014) Batrachochytrium dendrobatidis infection dynamics vary seasonally in upstate New York, USA. Dis Aquat Organ 111(1):51–60
Lind M, Johansson F (2011) Testing the role of phenotypic plasticity for local adaptation: growth and development in time‐constrained Rana temporaria populations. J Evol Biol 24(12):2696–2704
Lind MI, Ingvarsson PK, Johansson H, Hall D, Johansson F (2011) Gene flow and selection on phenotypic plasticity in an island system of Rana temporaria. Evolution 65(3):684–697
Lindgren B, Laurila A (2009) Physiological variation along a geographical gradient: is growth rate correlated with routine metabolic rate in Rana temporaria tadpoles? Biol J Linn Soc 98(1):217–224
Lomolino MV, Heaney LR (2004) Frontiers of biogeography: new directions in the geography of nature. Sinauer Associates, Sunderland, MA, USA
Manis ML, Claussen DL (1986) Environmental and genetic influences on the thermal physiology of Rana sylvatica. J Therm Biol 11(1):31–36
Mantel N (1967) The detection of disease clustering and a generalized regression approach. Cancer Res 27(2 Part 1):209–220
Martof BS, Humphries RL (1959) Geographic variation in the wood frog Rana sylvatica. Am Midl Naturalist 61(2):350–389
Merilä J, Crnokrak P (2001) Comparison of genetic differentiation at marker loci and quantitative traits. J Evol Biol 14(6):892–903
Merilä J, Laurila A, Laugen AT, Räsänen K, Pahkala M (2000) Plasticity in age and size at metamorphosis in Rana temporaria‐comparison of high and low latitude populations. Ecography 23(4):457–465
Mitchell-Olds T, Willis JH, Goldstein DB (2007) Which evolutionary processes influence natural genetic variation for phenotypic traits? Nat Rev Genet 8(11):845–856
Morrison C, Hero JM (2003) Geographic variation in life‐history characteristics of amphibians: a review. J Anim Ecol 72(2):270–279
Mueller LD (1997) Theoretical and empirical examination of density-dependent selection. Annu Rev Ecol Syst 28(1):269–288
Muir AP, Biek R, Thomas R, Mable BK (2014) Local adaptation with high gene flow: temperature parameters drive adaptation to altitude in the common frog (Rana temporaria). Mol Ecol 23(3):561–574
Nosil P, Vines TH, Funk DJ (2005) Reproductive isolation caused by natural selection against immigrants from divergent habitats. Evolution 59(4):705–719
Oksanen J, Blanchet FG, Kindt R, Legendre P, Minchin PR, O’hara R et al. (2019) vegan: Community Ecology Package. R package version 2.5-6. https://CRAN.R-project.org/package=vegan
Olalla-Tárraga MÁ, Rodríguez MÁ (2007) Energy and interspecific body size patterns of amphibian faunas in Europe and North America: anurans follow Bergmann’s rule, urodeles its converse. Glob Ecol Biogeogr 16(5):606–617
Orizaola G, Quintela M, Laurila A (2010) Climatic adaptation in an isolated and genetically impoverished amphibian population. Ecography 33(4):730–737
Padgham M, Sumner MD (2020) geodist: fast, dependency-free geodesic distance calculations. R package version 0.0.6. https://CRAN.R-project.org/package=geodist
Palo JU, O’Hara RB, Laugen AT, Laurila A, Primmer CR, Merila J (2003) Latitudinal divergence of common frog (Rana temporaria) life history traits by natural selection: evidence from a comparison of molecular and quantitative genetic data. Mol Ecol 12(7):1963–1978
Peters RH, Peters RH (1986) The ecological implications of body size, vol 2. Cambridge University Press, New York, NY, USA
Phillips SJ, Anderson RP, Schapire RE (2006) Maximum entropy modeling of species geographic distributions. Ecol Model 190(3-4):231–259
Pigliucci M (2001) Phenotypic plasticity: beyond nature and nurture. Johns Hopkins University Press, Baltimore, MA, USA
Powell R, Conant R, Collins JT (2016) Peterson field guide to reptiles and amphibians of eastern and central North America. Houghton Mifflin Harcourt, New York, NY, USA
R Core Team (2020) R: a language and environment for statistical computing. R Foundation for Statistical Computing. Vienna, Austria. https://www.R-project.org/
Raufaste N, Rousset F (2001) Are partial Mantel tests adequate? Evolution 55(8):1703–1705
Rice KC, Jung RE (2004) Water-quality and amphibian population data for Maryland, Washington, DC, and Virginia, 2001–2004. US Geological Survey
Richter-Boix A, Quintela M, Kierczak M, Franch M, Laurila A (2013) Fine-grained adaptive divergence in an amphibian: genetic basis of phenotypic divergence and the role of nonrandom gene flow in restricting effective migration among wetlands. Mol Ecol 22(5):1322–1340
Richter-Boix A, Teplitsky C, Rogell B, Laurila A (2010) Local selection modifies phenotypic divergence among Rana temporaria populations in the presence of gene flow. Mol Ecol 19(4):716–731
Richter‐Boix A, Katzenberger M, Duarte H, Quintela M, Tejedo M, Laurila A (2015) Local divergence of thermal reaction norms among amphibian populations is affected by pond temperature variation. Evolution 69(8):2210–2226
Rissler LJ (2016) Union of phylogeography and landscape genetics. Proc Natl Acad Sci USA 113(29):8079–8086
Roff D (1980) Optimizing development time in a seasonal environment: the ‘ups and downs’ of clinal variation. Oecologia 45(2):202–208
Santos M, Borash DJ, Joshi A, Bounlutay N, Mueller LD (1997) Density‐dependent natural selection in Drosophila: evolution of growth rate and body size. Evolution 51(2):420–432
Schemske DW, Bierzychudek P (2007) Spatial differentiation for flower color in the desert annual Linanthus parryae: was Wright right? Evol: Int J Org Evol 61(11):2528–2543
Schueler FW (1975) Geographic variation in the size of Rana septentrionalis in Quebec, Ontario, and Manitoba. J Herpetol 9(2):177–185
Semlitsch RD, Scott DE, Pechmann JHK (1988) Time and size at metamorphosis related to adult fitness in Ambystoma talpoideum. Ecology 69(1):184–192
Shafer AB, Wolf JB (2013) Widespread evidence for incipient ecological speciation: a meta‐analysis of isolation‐by‐ecology. Ecol Lett 16(7):940–950
Sheridan JA, Caruso NM, Apodaca JJ, Rissler LJ (2018) Shifts in frog size and phenology: testing predictions of climate change on a widespread anuran using data from prior to rapid climate warming. Ecol Evol 8(2):1316–1327
Smith-Gill SJ, Berven KA (1979) Predicting amphibian metamorphosis. Am Naturalist 113(4):563–585
Spitze K (1993) Population structure in Daphnia obtusa: quantitative genetic and allozymic variation. Genetics 135(2):367–374
Stevens CE, Paszkowski CA (2004) Using chorus-size ranks from call surveys to estimate reproductive activity of the wood frog (Rana sylvatica). J Herpetol 38(3):404–410
Therneau TM (2020) coxme: Mixed effects cox models. R package version 2.2-16. https://CRAN.R-project.org/package=coxme
Thomassen HA, Cheviron ZA, Freedman AH, Harrigan RJ, Wayne RK, Smith TB (2010) Spatial modelling and landscape‐level approaches for visualizing intra‐specific variation. Mol Ecol 19(17):3532–3548
Van Buskirk J (2017) Spatially heterogeneous selection in nature favors phenotypic plasticity in anuran larvae. Evolution 71(6):1670–1685
Venables W, Ripley B (2002) Modern Applied Statistics with S. 4th Edition. Springer, New York, NY, USA
Wang IJ, Bradburd GS (2014) Isolation by environment. Mol Ecol 23(23):5649–5662
Wang IJ, Summers K (2010) Genetic structure is correlated with phenotypic divergence rather than geographic isolation in the highly polymorphic strawberry poison‐dart frog. Mol Ecol 19(3):447–458
Warne RW, Crespi EJ (2015) Larval growth rate and sex determine resource allocation and stress responsiveness across life stages in juvenile frogs. J Exp Zool A Ecol Genet Physiol 323(3):191–201
Weber MM, Stevens RD, Diniz‐Filho JAF, Grelle CEV (2017) Is there a correlation between abundance and environmental suitability derived from ecological niche modelling? A meta‐analysis. Ecography 40(7):817–828
Weir L (2001) NAAMP unified protocol: call surveys. North American Amphibian Monitoring Program. Patuxtent Wildlife Research Center, Patuxtent, MA, USA
Whitlock MC (2008) Evolutionary inference from QST. Mol Ecol 17(8):1885–1896
Whitlock MC, Guillaume F (2009) Testing for spatially divergent selection: comparing QST to FST. Genetics 183(3):1055–1063
Whitlock MC, Phillips PC (2000) The exquisite corpse: a shifting view of the shifting balance. Trends Ecol Evol 15(9):347–348
Wilbur HM (1976) Density‐dependent aspects of metamorphosis in Ambystoma and Rana sylvatica. Ecology 57(6):1289–1296
Wilbur HM, Collins JP (1973) Ecological aspects of amphibian metamorphosis. Science 182(4119):1305–1314
Wright S (1943) Isolation by distance. Genetics 28(2):114
Acknowledgements
The authors would like to thank the Powdermill Nature Reserve, Cheaha State Park, Amicalola State Park, K. Engbrecht, B. Zale, N. Mattheus, J. Petranka, J. Pechmann, W. Meshaka, R. W. Van Devender, L. Belden, L. Johnson, M. Rubbo, D. Patrick, M. Hunter, J. O’Boyle, J. Davis, G. Lipps, J. Snodgrass, K. Barnett, J. Gilhen, J. Zane, and S. Brady for help with site identification and/or collecting samples. The authors would also like to thank K. Westby and H. Anderson for assisting with the common garden experiment, and J. Ullman and the WSU College of Engineering for use of their facilities. Protocols were approved under WSU ASAF #04167-004. This research was supported by NSF grants BCS 1026841 to LJR and BCS 1134687 to EJC. All appropriate collecting permits were obtained from state and federal agencies (listed in Table S2 in Supplementary Information). One of the authors now serves at the U.S. National Science Foundation. The views expressed in this paper do not necessarily reflect those of the U.S. National Science Foundation or the United States government.
Author information
Authors and Affiliations
Contributions
LJR and EJC conceived the idea and designed methodology. SID, JC, and EHLS executed the experiment and collected data. EHLS, EJC, SID, and TS analyzed the data. All authors contributed critically to the drafts and gave final approval for publication.
Corresponding author
Ethics declarations
Conflict of interest
The authors declare that they have no conflict of interest.
Additional information
Publisher’s note Springer Nature remains neutral with regard to jurisdictional claims in published maps and institutional affiliations.
Associate editor: Rowan Barrett
Supplementary information
Rights and permissions
About this article

Cite this article
Le Sage, E.H., Duncan, S.I., Seaborn, T. et al. Ecological adaptation drives wood frog population divergence in life history traits. Heredity 126, 790–804 (2021). https://doi.org/10.1038/s41437-021-00409-w
Received:
Revised:
Accepted:
Published:
Issue Date:
DOI: https://doi.org/10.1038/s41437-021-00409-w
