


« Prev Next »

Comparative genomics is a field of biological research in which the genome sequences of different species — human, mouse, and a wide variety of other organisms from bacteria to chimpanzees — are compared. By comparing the sequences of genomes of different organisms, researchers can understand what, at the molecular level, distinguishes different life forms from each other. Comparative genomics also provides a powerful tool for studying evolutionary changes among organisms, helping to identify genes that are conserved or common among species, as well as genes that give each organism its unique characteristics.
What Is a Genome Made Of?
Although living creatures look and behave in a myriad of ways, all of their genomes consist of DNA, the chemical chain that harbors the genes that code for thousands of different kinds of proteins. Within DNA are the instructions sufficient to make an organism and the means by which organisms pass information along to their offspring. Remarkably, this information is coded by only four nucleotides: adenosine (A), cytosine (C), guanine (G), and thymine (T). Understanding the order of these nucleotides in linear DNA molecules has been an active pursuit since the discovery of DNA’s double-helical structure (Watson et al. 1953). As such, DNA sequencing has emerged as a fundamental approach to molecular biology research. The power of DNA sequencing as a research tool has spurred the dramatic advancement of DNA sequencing technology, which is allowing ever more genomes to be sequenced and making comparative genomics an accessible focal point for the study of any form of life.
What Genomes Have Been Sequenced?
In addition to sequencing the three billion letters in the human “genetic instruction book” (Lander et al. 2001), researchers involved in the International Human Genome Project (HGP) sequenced the genomes of a number of important model organisms. These include chimpanzee (Lander et al. 2005), mouse (Waterston et al. 2002), rat (Gibbs et al. 2004), two puffer fish (Jaillon et al. 2004; Aparicio et al. 2002), fruit fly (Adams et al. 2000), two sea squirts (Dehal et al. 2002; Small et al. 2007), two roundworms (Stain et al. 2003; Stein et al. 1998), baker's yeast (Goffeau et al. 1996), and the bacterium Escherichia coli (Blattner et al. 1997). Since the completion of the HGP, sequence drafts of the chicken (Blattner et al. 2004), cow (Elsik et al. 2009), dog (Lindblad-Toh et al. 2005), honey bee (Lindblad-Toh et al. 2006), sea urchin (Sodergren et al. 2006) and rhesus macaque monkey (Gibbs et al. 2007) (to name just a few) have also been established.
How Are Genomes Compared?
A simple comparison of the general features of genomes such as genome size, number of genes, and chromosome number presents an entry point into comparative genomic analysis. Data for several fully-sequenced model organisms is shown in Table 1. The comparisons highlight some striking findings. For example, while the tiny flowering plant Arabidopsis thaliana has a smaller genome than that of the fruit fly Drosophila melanogaster (157 million base pairs v. 165 million base pairs, respectively) it possesses nearly twice as many genes (25,000 v. 13,000). In fact A. thaliana has approximately the same number of genes as humans (~25,000). Thus, a very early lesson learned in the "genomic era" is that genome size does not correlate with evolutionary status, nor is the number of genes proportionate to genome size.
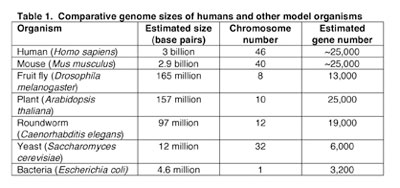
Table 1: Comparative genome sizes of humans and other model organisms

Figure 1: Conserved segments in the human and mouse genome
Human chromosomes, with segments containing at least two genes whose order is conserved in the mouse genome as color blocks. Each color corresponds to a particular mouse chromosome. Centromeres, subcentromeric heterochromatin of chromosomes 1, 9 and 16, and the repetitive short arms of 13, 14, 15, 21 and 22 are in black. (International Human Genome Sequencing Consortium; Lander, E. S. et al. 2001)
Comparison of discrete segments of genomes is also possible by aligning homologous DNA from different species. An example of such an alignment is shown in Figure 2, where a human gene (pyruvate kinase: PKLR) and the corresponding PKLR homologs from macaque, dog, mouse, chicken, and zebrafish are aligned. Regions of high DNA sequence similarity with human across a 12-kilobase region of the PKLR gene are plotted for each organism. Notice the high degree of sequence similarity between human and macaque (two primates) in both PKLR exons (blue) as well as introns (red) and untranslated regions (light blue) of the gene. In contrast, the chicken and zebrafish alignments with human only show similarity to sequences in the coding exons; the rest of the sequence has diverged to a point where it can no longer be reliably aligned with the human DNA sequence. Using such computer-based analysis to zero in on the genomic features that have been preserved in multiple organisms over millions of years, researchers are able to locate the signals that represent the location of genes, as well as sequences that may regulate gene expression. Indeed, much of the functional parts of the human genome have been discovered or verified by this type of sequence comparison (Lander et al. 2001) and it is now a standard component of the analysis of every new genome sequence.

Figure 2: Human PKLR gene region compared to the macaque, dog, mouse, chicken, and zebrafish genomes
Numbers on the vertical axis represent the proportion of identical nucleotides in a 100-bp window for a point on the plot. Numbers on the horizontal axis indicate the nucleotide position from the beginning of the 12-kilobase human genomic sequence. Peaks shaded in blue correspond to the PKLR coding regions. Peaks shaded in light blue correspond to PKLR mRNA untranslated regions. Peaks shaded in red correspond to conserved non-coding regions (CNSs), defined as areas where the average identity is > 75%. Alignment was generated using the sequence comparison tool VISTA (http://pipeline.lbl.gov).

Figure 3: Comparisons of genomes at different phylogenetic distances serve to address specific questions.
At closer phylogenetic distances (50–200 million years of divergence), both functional and non-functional DNA is found within the conserved segments. In these cases, the functional sequences will show signatures of selection by virtue of their sequences having changed less, or more slowly than, non-functional DNA. Moreover, beyond the ability to discriminate functional from non-functional DNA, comparative genomics is also contributing to the identification of general classes of important DNA elements, such as coding exons of genes, non-coding RNAs, and some gene regulatory sites.
In contrast, very similar genomes separated by about 5 million years of evolution (such as human and chimpanzee) are particularly useful for finding the sequence differences that may account for subtle differences in biological form. These are sequence changes under directional selection, a process whereby natural selection favors a single phenotype and continuously shifts the allele frequency in one direction. Comparative genomics is thus a powerful and promising approach to biological discovery that becomes more and more informative as genomic sequence data accumulate.
What Are the Benefits of Comparative Genomics?
Dramatic results have emerged from the rapidly developing field of comparative genomics. Comparison of the fruit fly genome with the human genome reveals that about sixty percent of genes are conserved (Adams et al. 2000). That is, the two organisms appear to share a core set of genes. Researchers have also found that two-thirds of human genes known to be involved in cancer have counterparts in the fruit fly.
In addition to its implications for human health, comparative genomics may benefit the broader animal world and ecological studies as well. As sequencing technology grows easier and less expensive, it will find wide applications in agriculture, biotechnology, and zoology as a tool to tease apart the often-subtle differences among animal and plant species. Such efforts might also lead to the rearrangement of our understanding of some branches of the evolutionary "tree of life," as well as point to new strategies for conserving rare and endangered species.
References and Recommended Reading
Adams, M. D., Celniker, S. E. et al. The genome sequence of Drosophila melanogaster. Science 287, 2185-2195 (2000).
Aparicio, S., Chapman, J. et al, Whole-genome shotgun assembly and analysis of the genome of Fugu rubripes. Science 297, 1301-1310 (2002).
Blattner, F. R., Plunkett, G. et al. The complete genome sequence of Escherichia coli K-12. Science 277, 1453-1462 (1997).
Blattner, F. R., Plunkett, G. et al. Sequence and comparative analysis of the chicken genome provide unique perspectives on vertebrate evolution. Nature 432, 695-716 (2004).
Deha, P., Satou, Y. et al. The draft genome of Ciona intestinalis: insights into chordate and vertebrate origins. Science 298, 2157-2167 (2002).
Elsik, C. G., Tellam, R. L. et al. The genome sequence of taurine cattle: a window to ruminant biology and evolution. Science 324, 522-528 (2009).
Gibbs, R. A,. Rogers, J. et al. Evolutionary and biomedical insights from the rhesus macaque genome. Science 316, 222-234 (2007).
Gibbs, R. A., Weinstock, G. M. et al. Genome sequence of the Brown Norway rat yields insights into mammalian evolution. Nature 428, 493-521 (2004).
Goffeau, A., Barrell, B. G. et al. Life with 6000 genes. Science 274, 546, 563-547 (1996).
Jaillon, O., Aury, J. M. et al. Genome duplication in the teleost fish Tetraodon nigroviridis reveals the early vertebrate proto-karyotype. Nature 431, 946-957 (2004).
Lander, E. S., Linton, L. M. et al. Initial sequencing and analysis of the human genome. Nature 409, 860-921 (2001).
Lander, E. S., Linton, L. M. et al. Initial sequence of the chimpanzee genome and comparison with the human genome. Nature 437, 69-87 (2005).
Lindblad-Toh, K., Wade, C. M. et al. Genome sequence, comparative analysis and haplotype structure of the domestic dog. Nature 438, 803-819 (2005).
Lindblad-Toh, K., Wade, C. M. et al. Insights into social insects from the genome of the honeybee Apis mellifera. Nature 443, 931-949 (2006).
Small, K. S., Brudno, M. et al. A haplome alignment and reference sequence of the highly polymorphic Ciona savignyi genome. Genome Biol 8, R41 (2007).
Sodergren, E., Weinstock, G. M. et al. The genome of the sea urchin Strongylocentrotus purpuratus. Science 314, 941-952 (2006).
Stein, L. D., Bao, Z. et al. The genome sequence of Caenorhabditis briggsae: a platform for comparative genomics. PLoS Biol 1, E45 (2003).
Stein, L. D., Bao Z. et al. Genome sequence of the nematode C. elegans: a platform for investigating biology. The C. elegans Sequencing Consortium. Science 282, 2012-2018 (1998).
Waterston, R.H., Lindblad-Toh, K., et al. Initial sequencing and comparative analysis of the mouse genome. Nature 420:520-562 (2002).
Watson, J.D., Crick, F.H. Molecular structure of nucleic acids; a structure for deoxyribose nucleic acid. Nature 171(4356):737-738 (1953).


