Volume 14
-
No. 12 December 2019
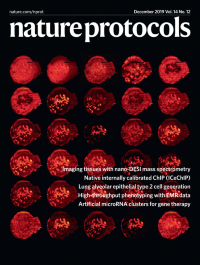
High spatial resolution imaging of biological tissues using nanospray desorption electrospray ionization mass spectrometry (nano-DESI).This protocol enables sensitive and quantitative imaging of lipids and metabolites in tissue sections with high throughput and spatial resolution. Hundreds of high-quality ion images were obtained from a single uterine section with a resolution of better than 10 µm.
See Yin et al.
-
No. 11 November 2019
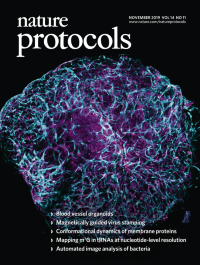
Human blood vessel organoidConfocal image of a blood vessel organoid derived from human pluripotent stem cells, immunostained with CD31 to visualize endothelial networks (cyan) and PDGFR-b to label pericytes (magenta).
See Wimmer et al.
-
No. 10 October 2019
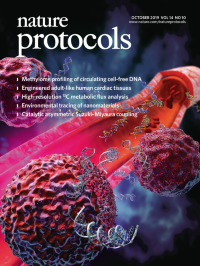
Plasma cell-free DNA methylomesArtist’s impression of cancer cells releasing cell-free DNA (cfDNA) in the bloodstream. In this issue, Shen et al. provide the cfMeDIP-seq protocol for methylome profiling of plasma cfDNA.
See Shen et al.
-
No. 9 September 2019
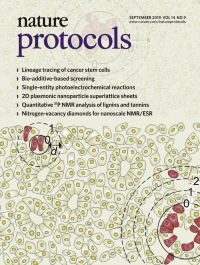
Clonal tracing in established colon cancer tissue using marker-independent fluorescent labellingSchematic drawing of red fluorescent clones within established colon cancer tissue and the method to determine the maximum distance (d max) of cells within a clone, which is used to distinguish individual clones. The numbers in the circles indicate distance in cell diameters.
See Lenos et al.
-
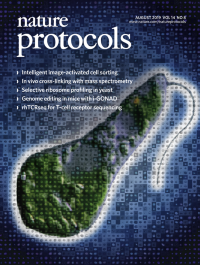
No. 8 August 2019
Mosaic of a single Euglena gracilis cellMosaic of a single Euglena gracilis cell composed of numerous E. gracilis cell images acquired by the intelligent image–activated cell sorting machine.
[Correction: This text was previously published with an incorrect title, and the first line of text on the thumbnail of the cover was also incorrect; both have now been amended.]
See Isozaki et al.
-
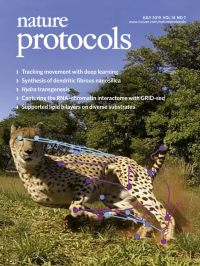
No. 7 July 2019
A running cheetah with DeepLabCutImage of a cheetah ‘in the wild’ with markerless tracking of user-defined parts made with DeepLabCut, an open-source toolbox for deep-learning-based animal-pose estimation provided by Nath et al.
See Nath et al.
-
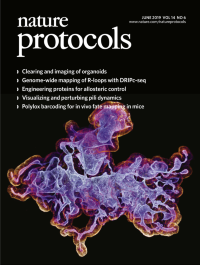
No. 6 June 2019
3D confocal image of a human colon organoid.Image of a human colon organoid immunolabeled for F-actin and E-cadherin and captured in 3D using the easy-to-use and fast protocol provided by Dekkers et al. in this issue of Nature Protocols.
See Dekkers et al.
-
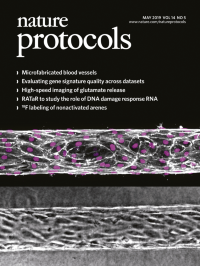
No. 5 May 2019
Microfabricated blood vesselsPhase contrast (left) and immunostained micrographs (right) of perfusable human engineered microvessels used to investigate vascular barrier function. Immunostaining for VE-cadherin (white) and nuclei (magenta) demonstrates the formation of endothelial cell–cell adherens junctions that regulate the permeability of the vessel in response to flow.
See Polacheck et al.
-
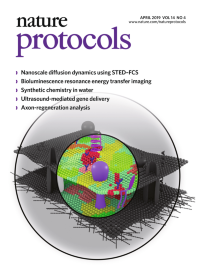
No. 4 April 2019
Nanoscale diffusion dynamics using STED–FCSSeeing nanoscale organization through a STED doughnut. Nanoscale membrane heterogeneity is investigated using a combination of super-resolution STED microscopy and fluorescence correlation spectroscopy.
See Sezgin et al.
-
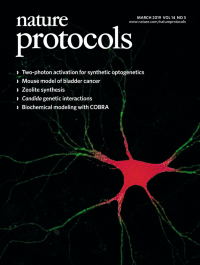
No. 3 March 2019
Two-photon activation for synthetic optogeneticsSynthetic optogenetics provides a method to interrogate neuronal signaling. Depicted is a cultured hippocampal neuron (green) photostimulated by near-infrared light patterned by computer-generated holography (red and pattern).
See Carmi et al.
-
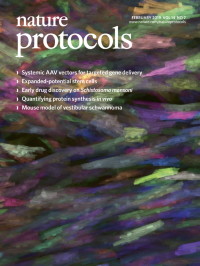
No. 2 February 2019
Systemic AAV vectors for targeted gene deliveryMulticolor labeling of cardiac muscle with systemic AAVs. Three fluorescent proteins (mTurquoise2, mNeonGreen, and mRuby2) were separately packaged into AAV-PHP.S and systemically codelivered to a wild-type mouse at 3.3 × 10¹¹ vector genomes (vg) per virus (1 × 10¹² vg total). Gene expression in the heart was evaluated 11 d later. Individual cardiomyocytes can be easily distinguished from one another.
See Challis et al.
-
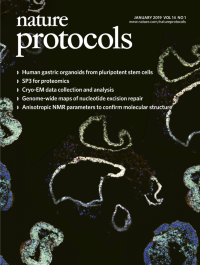
No. 1 January 2019
Human gastric organoids from pluripotent stem cellsHuman-pluripotent-stem-cell-derived fundic gastric organoids and antral organoids at day 20 of culture. The images show immunofluorescent staining of the organoids for the markers GATA4 (green), PDX1 (red) and CDH1/E-cadherin (white), as well as the nuclear stain DAPI (blue).
See Borda et al.