Volume 13
-
No. 12 December 2018
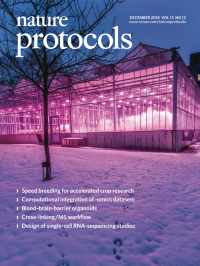
Speed breeding for accelerated crop researchSpeed-breeding technology to fast-track crop research and breeding. The photo shows a large-scale speed-breeding facility that uses controlled temperature and extended photoperiods provided by LEDs to rapidly cycle crops all year round.
See Ghosh et al.
-
No. 11 November 2018
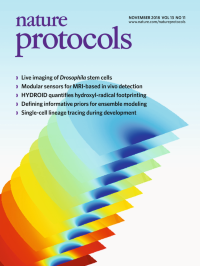
Live imaging of Drosophila stem cellsMathematical modeling of glucose consumption in a conventional setup for imaging of the Drosophila germarium. The color-coded scale shown here indicates the glucose concentration relative to the initial concentration in Schneider's insect medium, and the image shows the temporal evolution of the glucose concentration in 1-h intervals up to 10 h. The culture underwent rapid glucose depletion.
See Reilein et al.
-
No. 10 October 2018
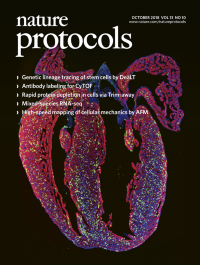
Genetic lineage tracing of stem cells by DeaLTA fluorescent image of Kit-CreER;IR1 mouse heart section immunostained with TNNI3 (cardiomyocyte marker; red), ZsGreen (lineage tracing reporter; green) and DAPI (nuclei; blue).
See He et al.
-
No. 9 September 2018
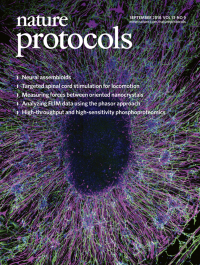
Neural assembloidsA fluorescent image of a 3D human cortical spheroid (hCS) derived from induced pluripotent stem cells that was plated on a glass coverslip and immunostained with antibodies against MAP2 (neurons; green), GFAP (glial lineage cells; purple) and DAPI (nucleiI, blue).
See Sloan et al.
-
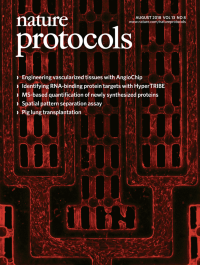
No. 8 August 2018
Engineering vascularized tissues with AngioChipA fluorescent image of an AngioChip scaffold with a built-in endothelialized network immunostained for CD31.
See Zhang et al.
-
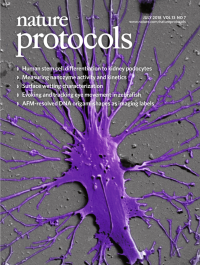
No. 7 July 2018
Human stem cell differentiation to kidney podocytesMature post-mitotic kidney podocyte differentiated from human induced pluripotent stem cells. The scanning electron microscopy image shows the development of primary and secondary foot processes in the stem cell-derived podocyte.
See Samira Musah et al.
-
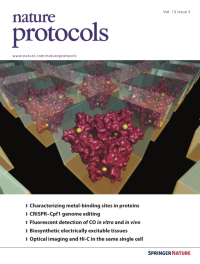
No. 5 May 2018
The cover image depicts a two-dimensional cubic lattice that conceptually mimics a crystal lattice in protein crystals. A protein structure (galactoside O-acetyltransferase; PDB 5V0Z) is shown here in dark red, with possible metal-binding sites highlighted in yellow. The image related to the protocol by Handing et al. (doi:10.1038/nprot.2018.018) was designed by Kasia Handing, Heping Zheng and David Cooper. Cover design by Erin Dewalt.
-
No. 4 April 2018
A 3D cardiac microchamber derived from human induced pluripotent stem cells that are engineered to spatially differentiate and organize into distinct tissue types, as indicated by the differential expression pattern of cardiac troponin T (red) and SM22 (green). Nuclei are stained blue. Image taken from the protocol by Ma et al. doi:10.1038/nprot.2018.006. Cover design by Jamel Wooten.
-
No. 3 March 2018
A forebrain organoid derived from human induced pluripotent stem cells at day 52 in culture, immunostained with CTIP2 (a neuronal marker; red), PKC-λ (adherens junction marker for neural stem cells; green) and DAPI (nuclei marker; blue). Image taken from the protocol by Ming et al. doi:10.1038/nprot.2017.152. Cover design by Jamel Wooten.
-
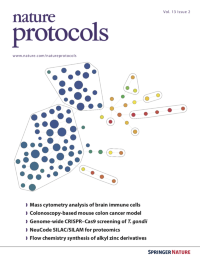
No. 2 February 2018
Clusters of the main immune cell populations in the naive mouse brain compartment, including the parenchyma, meninges and choroid plexus. This SPADE plot depicts the various populations with color gradient indicating the median intensity of the CD45 marker. Identification of specific populations was performed based on the expression of multiple markers, as indicated for each cell type. Image taken from the protocol by Korin et al. doi:10.1038/nprot.2017.155. Cover design by Jamel Wooten.
-
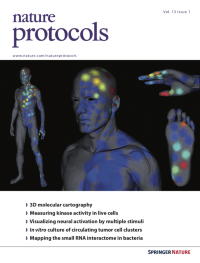
No. 1 January 2018
Three-dimensional molecular maps showing the localization of two compounds used in beauty products, sodium lauryl ether sulfate (left) and kaurenoic acid (middle), on the skin of a healthy human being. Also shown are molecular maps for sinapic acid, a food additive (upper right), and C18-sphingosine, a cell membrane phospholipid (lower right). Intensities of each molecule are represented with a color scale from blue (low intensity) to red (high intensity). Image taken from the protocol by Theodore Alexandrov et al. doi:10.1038/nprot.2017.122. Cover design by Jamel Wooten.