
Abstract
Covalent addition of nitric oxide (NO) to Cys-sulfur in proteins, or S-nitrosylation, plays pervasive roles in the physiological and pathophysiological modulation of mammalian protein functions. Knowledge of the specific protein Cys residues that undergo NO addition in different biological settings is fundamental to understanding NO-mediated signal transduction. Here, we describe in detail an MS-based proteomic protocol for facile, high-throughput and unbiased discovery of SNO-Cys residues in proteins from complex biological samples. The approach, termed SNOSID (SNO-Cys site identification), can be used to identify endogenous and chemically induced S-nitrosylation sites in proteins from tissues or cells. Identified SNO-Cys sites may provide insights into novel mechanisms and proteins that mediate NO bioactivities in health and disease. SNOSID builds on the biotin-switch method for covalent addition of disulfide-linked biotin at S-nitrosylation sites on proteins. Biotinylated proteins are then subjected to trypsinolysis and the resulting biotin-tagged peptides are affinity-captured on streptavidin-agarose. After selective elution with β-mercaptoethanol, the peptides are sequenced using nanoflow liquid chromatography tandem mass spectrometry (nLC-MS/MS). Validation that identified peptide ions as originating from authentic NO-Cys-containing precursor proteins can be provided by establishing that these peptide ions are absent from control samples where S–NO bonds were subjected to prior photolysis, using a UV transilluminator. The protocol requires approximately 2 days for sample processing, including the incubation time for proteolysis. An additional 1–2 days is needed for sample analysis by nLC-MS/MS and data analysis/interpretation.
Introduction
NO is a reactive radical species that is produced by NO synthases (NOSs), a family of enzymes encoded by three distinct genes in mammals. Remarkably, NO has been implicated in the physiological regulation of virtually every major mammalian system, including cardiovascular, respiratory, gastrointestinal, renal, neuronal, endocrine, reproductive and host defense. These different bioactivities result from covalent addition of NO to target proteins.
An extensive literature has documented the pre-eminence of NO addition to Cys-sulfur (i.e., in terms of its ubiquity and the diversity of cell regulatory functions in which it is implicated) as a mediator of cell signaling1. It is worth noting that covalent attachment of NO to proteins is modulated by changes in the intracellular milieu, as well as by changes in the NO biosynthesis—this contrasts starkly with mechanisms of conventional signaling molecules, which are preformed, vesiculated and act by lock-and-key (non-covalent) binding to cell surface receptors2.
Relative to O-phosphorylation, the discovery of S-nitrosylation sites on proteins has been quite challenging, primarily owing to the inherent chemical instability of the S–NO bond. S–NO bond instability can result in the failure to detect some authentic S-nitrosylation sites (i.e., due to decomposition of SNO-Cys sites during analysis) and false identification of others (i.e., creation of non-native SNO-Cys sites by transnitrosation reactions that can occur during analysis). These limitations have largely thwarted approaches that would seek to comprehensively inventory cellular proteins that undergo reversible S-nitrosylation and specify their cognate SNO-Cys modification sites. Indeed, the specification of SNO-Cys modification sites in the past has been a laborious task, tackled on a protein-by-protein basis, involving the iterative mutation of putative SNO-Cys sites followed by biochemical/functional assessment of the altered proteins.
Here, we describe a step-by-step protocol for the application of an unbiased proteomic method that was recently shown to identify predominant S-nitrosylation sites on Cys residues in complex protein mixtures3. This method, termed SNOSID, allows for proteome-wide S-nitrosylation site identification by building on the approach of Jaffrey et al.4 for substitution of covalently attached biotin on protein Cys residues that were formerly S-nitrosylated. The substitution of biotin serves to both mark the relevant Cys-sulfur atoms for identification and provide an affinity tag for the purification of cognate peptides. Indeed, after trypsinolysis, biotinylated peptides are efficiently captured on streptavidin-agarose beads, selectively eluted and then sequenced using nLC coupled to (MS/MS).
Figure 1 provides a schematic representation of the SNOSID protocol—indicated step numbers correspond to those listed in PROCEDURE. The initial steps for purifying SNO peptides by the SNOSID protocol are as previously reported for purifying SNO proteins4: (i) complete blocking of free protein thiols by methylthiolation using S-methylmethanethiosulfonic (MMTS); (ii) selective reduction of S–NO bonds on Cys residues with ascorbate, generating new thiols at sites where NO had been; and (iii) disulfide bond linkage of biotin to the new thiols using N-[6-(biotinamido)hexyl]-3′-(2′-pyridyldithio) propionamide (biotin-HPDP). Biotinylated proteins are then subjected to complete trypsinolysis, and the resulting biotinylated peptides are affinity-captured on streptavidin-agarose. This is followed by reduction of the disulfide linker between the peptide-Cys and its biotin tag using β-mercaptoethanol, which gently releases the peptides in their thiol-unmodified form. We found that the mild conditions employed for peptide elution do not result in a detectable contamination of the eluate with peptides from endogenous biotin-containing proteins or from Cys-free peptides that may bind and elute nonspecifically from streptavidin-agarose3.

See the text for procedural details.
Controls
Several controls are useful for the validation of results obtained using the SNOSID protocol. First, a positive control serves to verify that a particular SNOSID experiment, as performed, would successfully identify peptides (formerly containing Cys-NO residues) if present at a sufficient level in a given sample. Thus, the positive control serves to distinguish a failed experiment from a negative result. The positive control may be a pure SNO-Cys-containing reference protein or a defined SNO-protein mixture that is analyzed either as a stand-alone sample (external control) or spiked into all study samples (internal control). Although the internal positive control design would potentially be most telling (providing a validation of results for each study sample, rather than each complete experiment), in practice the internal control is often undesirable owing to a loss in MS detection sensitivity for unknowns. Notably, the introduction of pure SNO protein(s) can result in an unacceptable suppression of the ionization of relatively lower abundance (formerly) SNO peptides in the study samples. A convenient positive control may be created by S-nitrosation of a portion of each study sample by treatment with a low concentration of an NO-donor compound (e.g., 2–10 μM GSNO) for comparison with results from an untreated study sample that is analyzed in tandem.
Two types of negative controls are important to confirm the origin of each identified peptide ion in a study sample from a bona fide SNO-Cys-containing protein. First, it should be established that detection of the peptide ion is eliminated by omission of ascorbate from the biotin-HPDP reaction buffer—this finding would satisfy the expectation that S–NO bond reduction is required for ion detection. Second, it should be established that detection of the peptide ion is suppressed (or abolished) when protein S–NO bonds are selectively decomposed. Previously, incubation with an excess quantity of a low molecular weight thiol (e.g., 5 mM dithiothreitol (DTT)) was used to selectively denitrosylate protein thiols3—the rationale being that the low molecular weight thiol can serve in transnitrosation reactions as an acceptor of NO from proteins. An alternative and highly selective approach for decomposition of S–NO bonds takes advantage of the well-established ability of S–NO bonds, but not S–S bonds, to undergo photodissociation. Thus, one can pre-expose an aliquot of each sample to UV light (S–NO AbsMAX = 330–340 nm) to photodissociate protein S–NO bonds. MS ion signals that originate from authentic SNO proteins will predictably be suppressed by UV illumination, whereas false-positive signals that do not originate from SNO proteins would predictably be unaffected. S–NO bond photolysis has traditionally been achieved in laboratories equipped for biophysical techniques by exposing samples to UV illumination from a laser or high-intensity mercury vapor lamp. To preclude the need for a specialized illumination apparatus to perform the SNOSID protocol, we found that a common UV transilluminator (normally employed to visualize DNA fluorescence on ethidium bromide-treated agarose gels) will suffice to effect homolytic cleavage of S–NO bonds on protein Cys-sulfur residues.
It has been suggested in two recent reports that some protein S–S bonds may be susceptible to reduction by ≥10 mM ascorbate, potentially resulting in their false-positive identification as S–NO sites by the biotin-switch technique5,6. Arguing against the possibility that ascorbate can directly reduce disulfide bonds, it can be said that this reaction is thermodynamically unfavorable (the redox potential of cystine/cysteine is 340 mV, whereas the redox potential of dehydroascorbate/ascorbic acid is 58 mV (see ref. 7)). Thus, the possibility that ascorbate can reduce S–S bonds on its own is questionable and awaits mechanistic validation. In any case, the proposed ascorbate concentration used in the SNOSID analysis detailed herein is only 2 mM, lower than that suggested to give rise to false-positive SNO-Cys site detection. Importantly, the disappearance of a putative SNO-Cys peptide ion after photolysis by UV light can provide strong evidence that the ion originates from a genuine protein S-nitrosylation site. Further evidence that an identified “endogenous” protein SNO-Cys site arises from NOS-derived NO can be provided by results of additional experiments that assess whether detection of the cognate ion is attenuated when NO biosynthesis is suppressed. Thus, when an experimental design allows, NO synthesis may be suppressed by pretreatment of animals or cells with a selective pharmacological inhibitor of NOS (e.g., Nω-methyl-L-arginine) or by silencing expression of the appropriate NOS isoform using genetic or RNA interference approaches. Inasmuch as the mammalian genome encodes three distinct NOS genes, investigators should be aware of the possibility that knockout of a single NOS gene may be compensated by overexpression of an alternative NOS gene, complicating the interpretation of experimental results.
Limitations
Despite its utility in identifying SNO-Cys modification sites in proteins, the SNOSID method is constrained by several limitations. First, the method relies on identification of an SNO-Cys using MS/MS-based sequence information inferred from a single peptide ion. High-confidence “one-hit-wonders” are not as prevalent as one would wish, and many peptide ions will predictably be unidentified owing to either insufficient or excessive m/z peaks in their MS/MS spectrum. Second, limited sensitivity can be a significant issue, even with the 1 g of recommended starting tissue/cells. This relatively large amount of biomass is a particular problem for studies that require cells to be grown in culture. Moreover, despite the relatively large amount of starting tissue required, identification of endogenous protein SNO-Cys sites may still be restricted to a modest group of the most abundant endogenous SNO proteins contained in the study tissue. Of course, this problem will undoubtedly wane as innovations in biological MS lead to commercial instruments with greater sensitivity, precision and mass accuracy. Third, the SNOSID method may preferentially identify particular subsets of all SNO-Cys sites, that is, those that (a) contain S–NO bonds in a context that most efficiently withstand in vitro denitrosylation and (b) are particularly susceptible to reduction by low concentrations of ascorbate. A final concern is that some protein disulfide bonds may be falsely identified as SNO-Cys5,6 when relying only on the “traditional” biotin-switch criteria, that is, signal loss when ascorbate treatment is omitted from the procedure. However, such false-positive signals should be readily recognized by their resistance to photolysis and NO inhibition strategies (pharmacological and/or genetic), as noted above.
Materials
Reagents
-
Unless otherwise stated, all chemicals were purchased from Sigma Chemical Co.
-
Acetone
Caution
Acetone is highly flammable.
-
Biotin-HPDP (Pierce). Prepare a 20 mM (100 ×) biotin-HPDP stock solution in dimethylformamide and store in 0.5 ml aliquots at −80 °C
-
MMTS (Aldrich, cat. no. 208795-10G)
-
DTT
-
Ascorbic acid
-
β-Mercaptoethanol
-
Sequencing-grade modified trypsin (e.g., L-(tosylamido-2-phenyl) ethyl chloro-methyl ketone-modified trypsin from Sigma (dimethylated), cat. no. T656, or Promega, cat. no. V5111 7)
-
Neocuproine
-
Complete protease inhibitor cocktail tablets (Roche Diagnostics)
-
Phenylmethylsulfonyl fluoride (PMSF)
-
Streptavidin-agarose (purchased as a 1:1 suspension from Sigma, cat. no. S1638)
-
Trifluoroacetic acid (TFA)
Caution
Corrosive, handle with care.
-
HPLC-grade acetonitrile (J.T. Baker Chemicals)
-
Formic acid
Caution
Corrosive, handle with care.
-
Phosphate-buffered saline (PBS; 138 mM NaCl, 2.6 mM KCl, 1.5 mM KH2PO4 (anhydrous), 6.3 mM Na2HPO4 (anhydrous), pH 7.4)
-
Lysis buffer (see REAGENT SETUP)
-
Blocking buffer (20 mM Tris-HCl, pH 7.7, 2.5% (w/v) SDS, 1 mM EDTA, 0.1 mM neocuproine)
-
Resuspension buffer (20 mM Tris-HCl, pH 7.6)
-
Incubation buffer (20 mM Tris-HCl, pH 7.7, 1 mM EDTA, 0.4% Triton X-100)
-
Bicarbonate buffer (5 mM ammonium bicarbonate in 20% acetonitrile)
-
Wash buffer (incubation buffer supplemented with 600 mM NaCl)
-
HPLC solvent A (0.1% formic acid in 3% acetonitrile, 96.9% dH2O)
Critical
Use HPLC-grade water of the highest purity available (>18 MΩ resistance). The solvents should be degassed, preferably using a continuous online vacuum degassing module.
-
HPLC solvent B (0.1% formic acid in 90% acetonitrile, 9.9% dH2O)
Critical
Use HPLC-grade water of the highest purity available (>18 MΩ resistance). The solvents should be degassed, preferably using a continuous online vacuum degassing module.
Equipment
-
SpeedVac
-
UV transilluminator
-
Silanized microcentrifuge tubes
-
55 °C shaking incubator
-
Nanospray capillary emitters (15 μm diameter, 75 μm long; New Objective)
-
Capillary LC columns packed with C18 resin. The present example uses 75-μm diameter, 150 mm long columns from Agilent Technologies
Reagent setup
-
Lysis buffer 50 mM Tris-HCl, pH 7.5, 1 mM EDTA, 150 mM NaCl, 0.4% Triton X-100 and 0.1 mM neocuproine. Just before homogenization of the tissue, add 1 tablet of protease inhibitor cocktail to 50 ml of lysis buffer.
-
Animal tissue or cultured cells for which protein S -nitrosylation site identification is the goal The protocol detailed herein was optimized using 1 g of PBS-washed rat cerebellum as the starting material (Pel-Freez). Other animal tissues and cultured cells may be similarly analyzed; however, optimization of the conditions for homogenization (Step 1), thiol-blocking (Step 5) and biotinylation (Step 8) may be necessary.
Equipment setup
-
LC-MS/MS analysis High-resolution nLC coupled to a tandem mass spectrometer. We use an Agilent 1100 series capillary LC system coupled to an Agilent XCT ultra ion trap mass spectrometer, configured for data-dependent data acquisition (Agilent Technologies). Other rapid duty-cycle ion trap MS systems may be substituted, particularly those with two-dimensional ion trap geometries that afford enhanced sensitivity over predecessor instruments with three-dimensional ion trap designs.
-
nLC-MS/MS is employed for peptide parent ion (MS) and daughter ion (MS/MS) analysis. The resulting MS data are used to search an in silica tryptic digest of the appropriate SwissProt or TREMBL protein databases (rat, in the example below) to deduce best-fit peptide sequences and identify source proteins.
-
Set up a 0.3 × 5 mm Zorbax 300SB-C18 sample-enrichment column, at a flow rate of 10 μl min−1. Peptides are resolved on a 3.5 μM particle size, 0.075 × 150 mm Zorbax 300SB-C18 analytical column at a flow rate of 0.3 μl min−1, employing a gradient of 15–40% solvent B for 50 min, followed by 40–85% solvent B for 30 min. The LC column eluate is introduced into an ion trap MS by electrospray ionization using a 15 μm diameter silica emitter needle. Precursor ion mass spectra are acquired at 0.5 s intervals in positive-ion mode, with automated data-dependent MS/MS on the four most intense ions from each precursor MS scan. The fragmentation amplitude is 1.15 V, MS scan rates are 8,100 m/z per second, capillary voltage is 1,800 V and the skimmer voltage is 30 V.
Critical
Analysis of peptide precursor and daughter ions by nLC-MS/MS will vary in details, depending on the particular nLC-MS/MS system employed. Although the equipment setup described above (and previously used for reported results3) calls for the use of separate C18 capillary enrichment and resolving columns, as well as a separate emitter needle, superior results have since been obtained using an Agilent laser-scribed “chip-column” in which these three components are merged on a single silicon wafer stack. In our hands, the minimal dead volume of the chip column provides markedly improved chromatographic resolution (i.e., sharper peaks), enhanced sensitivity and expanded SNO-peptide identifications, relative to more traditional capillary nLC column-based separations described herein. Nonetheless, as the chip column requires a specialized “Chip-cube” apparatus for coupling the chip column to an MS/MS system, and this coupling is currently restricted to only Agilent MS instruments, we describe the use of a conventional nLC system for its wider availability to those who may apply the SNOSID protocol.
Database searching A search engine for the analysis of peptide ion fragmentation (MS/MS) data to deduce the amino-acid sequence and ascertain the goodness-of-fit is required. We use a server running Spectrum Mill software, which is recommended (Agilent Technologies). Computers running Mascot or other comparable MS/MS analytical software should provide similar MS/MS-based peptide identifications and, if used as a complement to Spectrum Mill, are likely to yield an expanded array of SNO-peptide hits.
Using Spectrum Mill software (Agilent), raw MS/MS spectra are processed to extract MS/MS spectra that can be assigned to at least two y- or b-series ions, and only the extracted spectra are searched against a desired database (e.g., SwissProt). Key search parameters that we use for the analysis of ion trap data are typically a minimum matched peak intensity of 50%, a precursor mass tolerance of 2.0 Da and a product mass tolerance of 0.6 Da. The maximum number of missed cleavages allowed is one. The cutoff score that we commonly use for peptide identification in a Spectrum Mill is a score ≥10.0 and SPI% (the percentage of assigned spectrum intensity of total spectrum intensity) ≥70%. While the statistical analysis of experimental data is best left to the investigator's aims, our practice has been to perform five replicate experiments and consider SNO peptides detected in three or more experiments as “hits” with greatest evidence. Searching the MS/MS peptide ion data against a reverse (nonsense) database of predicted tryptic peptide fragment ions can be used to estimate the frequency of false-positive peptide identifications for any given Spectrum Mill cutoff score.
Procedure
Modified biotin-switch assay
-
1
Wash 1 g of flash-frozen tissue or freshly harvested cells three times in 10 ml of ice-cold PBS. Homogenize the tissue in 10 ml of ice-cold lysis buffer, using a glass pestle and 10 strokes in a Dounce homogenizer.
Note that this homogenization protocol was established using rat cerebellum, which is readily disrupted. For disruption of other tissue types, especially those rich in connective tissue and muscle fiber, mechanical homogenization or sonication may provide improved SNO-protein recovery. Nonetheless, as harsh disruption conditions will also promote the loss of labile SNO proteins, it would be best to adapt the tissue disruption conditions for optimal SNOSID, balancing recovery efficiency against degradative losses. For this purpose, optimization of conditions may be facilitated by preparing a quantity of the tissue of interest that is rendered SNO-protein-rich (i.e., by pretreatment with a transnitrosating agent such as S-nitrosoglutathione; 100 μM for 30 min at room temperature (RT, 22 °C) in dark) and by subjecting equivalent amounts of tissue to a range of durations and intensities of mechanical disruption. The most rigorous assessment of the extent of SNOSID would be ascertained by comparing the number of control-validated SNOSID results (for controls see below) for each extraction condition, comparing SNO-enriched with unmodified tissues.
Critical Step
To minimize photo- and thermo-decomposition of S-nitrosothiols during analysis, all procedures before completion of protein biotinylation (Step 7 below) should be performed at 4 °C under subdued light, preferably in the dark.
-
2
Centrifuge homogenates at 4,000 r.p.m. (Sorvall H6000A rotor, 4,654g) for 15 min at 4 °C and discard the pellet comprising cell debris. Assay the protein concentration rapidly using bovine serum albumin as a standard—an expected protein concentration when starting with 1 g cerebellum is 10 mg ml−1 (in 10 ml total volume). Dilute samples with lysis buffer to diminish the final protein concentration to 0.8–1.0 mg ml−1.
Critical Step
Tissue extracts should be kept on ice, under subdued light, in aluminum foil-wrapped conical tubes. Protein concentrations should be determined as swiftly as possible to minimize decomposition of protein S–NO bonds.
-
3
When in vitro S-nitrosylation of protein thiols is an experimental goal (e.g., to serve as a positive control for the analysis of endogenous protein S-nitrosylation sites or for the identification of preferred protein S-nitrosylation by an NO-donating chemical), lysates may be incubated with the desired nitrosylating agent. In the example below (Fig. 2, upper panel), cerebellum lysates (0.8–1.0 mg ml−1; 40 ml) were incubated at 37 °C for 30 min with gentle agitation in lysis buffer containing either 0 μM (upper panel) or 5 μM (lower panel) of the transnitrosating agent GSNO. Notably, this concentration of GSNO is in the range of physiological levels detected in rat cerebellum, estimated at 6–8 μM (ref. 8).
Figure 2: Representative results from a SNOSID analysis of rat cerebellum. 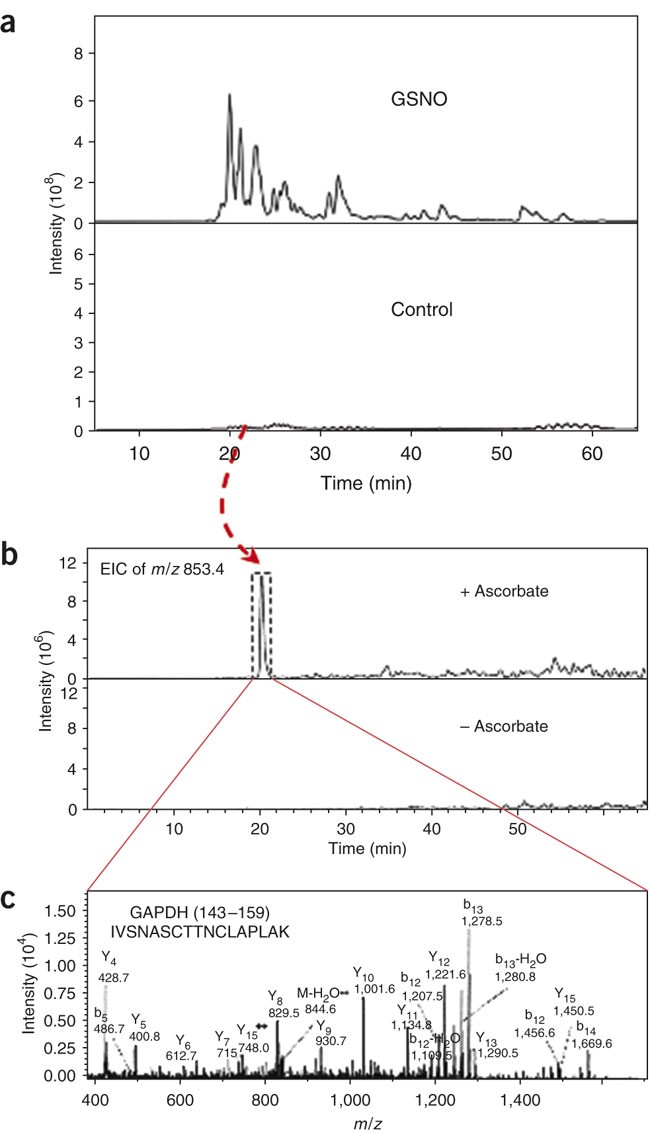
(a) NanoLC-MS/MS analysis showing base peak chromatograms of eluted peptide ions (MS mode) as a function of time, with increasing % acetonitrile in the mobile phase. SNOSID analysis was performed on a rat cerebellum lysate (13 mg total protein) before (control; lower panel) and 30 min after treatment with 5 μM GSNO at RT (GSNO; upper panel). Note the presence of low levels of peptide ions before GSNO treatment and the increase in ion abundance after treatment. (b) Identification of an endogenous SNO-Cys peptide in control (untreated) cerebellum. A single chromatographic peak was detected in the extracted ion chromatography at m/z 853.4, corresponding to the expected m/z values for a doubly charged SNO peptide IVSNASCTTNCLAPLAK from GAPDH (residues 143–159). Note that the detection of this m/z 853.4 ion required an ascorbate reduction on the SNOSID procedure. (c) Extensive b- and y-ion assignments of MS/MS spectra from m/z 853.4 confirm that GAPDH143–159 is the identity. Definitive MS/MS-based identification of five additional SNO peptide sequences were similarly obtained (data represented in this figure are derived from Hao et al.3).
-
4
Prepare a negative control by exposing half of each sample to UV illumination as described in Box 1.
-
5
Transfer irradiated and mock-irradiated samples to 250 ml capacity polypropylene centrifuge bottles. Use an additional 10 ml of lysis buffer to effect a near-quantitative transfer. Add two volumes (60 ml) of iced acetone to precipitate proteins and centrifuge at 3,000 r.p.m. (Sorvall H6000A rotor, 2,618g) for 15 min. Discard the supernatant and retain the protein pellets.
Critical Step
To diminish the chances of sample loss, confirm that the centrifuge bottles are made of polypropylene rather than polycarbonate or other acetone-soluble polymer.
-
6
Add 210 μl of MMTS to 120 ml blocking buffer (final concentration of MMTS = 20 mM). Resuspend protein pellets in 25 ml of MMTS/blocking buffer and incubate at 50 °C for 30 min with gentle agitation to block free protein thiols.
-
7
Precipitate proteins free of MMTS by addition of two volumes of iced acetone (50 ml) and pellet at 3,000 r.p.m. for 10 min.
Critical Step
Repeat two additional times for efficient MMTS removal.
-
8
Freshly prepare 0.2 mM biotin-HPDP in 100 ml resuspension buffer (using 100 × biotin-HPDP stock, see REAGENTS). Freshly prepare a 2 M ascorbic acid solution in dH2O. Solubilize protein pellets in 20 ml of biotin-HPDP-supplemented resuspension buffer. Transfer 10 ml volumes to each of two 50 ml polypropylene centrifuge tubes. To one of these samples, add 10 μl of the 2 M ascorbate solution. Allow the biotinylation reactions (± ascorbate) to proceed for 1 h at RT with gentle rotation.
Critical Step
Resuspended samples should be rapidly transferred. Note that the ascorbate-free sample provides a key control for experiment validation, that is, to confirm the prediction that ascorbate is needed for reduction of protein S–NO bonds and hence detection of MS peptide ions that formerly contained SNO-Cys.
-
9
Precipitate biotinylated proteins with two volumes of iced acetone (20 ml) and pellet proteins by centrifugation at 3,000 r.p.m. for 10 min. Resolubilize the protein pellet in 5 ml of incubation buffer.
Critical Step
It is crucial that all protein “clumps” are resuspended. Efficient resuspension may be achieved by repeated trituration through a narrow gauge needle (e.g., 26 G) fitted to a 10 ml tuberculin syringe.
-
10
Centrifuge at 3,000 r.p.m. to remove insoluble material and transfer to a 15 ml polypropylene centrifuge tube. Measure the protein concentration of samples and digest proteins overnight in modified trypsin (1:100 trypsin:sample protein (wt/wt)). Terminate the proteolysis after 16 h by adding 5 μl of a freshly prepared 500 mM PMSF solution in DMSO (final PMSF concentration, 0.5 mM).
-
11
Wash 1 ml of a 1:1 suspension of streptavidin-agarose (as provided by the manufacturer) by resuspension in 10 ml of iced PBS, followed by gravity sedimentation and decanting the supernatant—repeat this procedure one more time. Resuspend the washed streptavidin beads in 0.5 ml of incubation buffer. Add 100 μl of the streptavidin-agarose bead suspension to protein digests and incubate at RT with rotation to affinity-capture biotinylated peptides. After 1 h, pellet the beads by centrifugation at 2,000 r.p.m. (Sorvall H6000A rotor, 1,164g) for 10 min and discard the supernatant.
Caution
Confirm that the streptavidin bead slurry is homogeneous for efficient capture of biotinylated peptides.
-
12
Using 1 ml of incubation buffer, quantitatively transfer the streptavidin beads to 1.7 ml silanized microcentrifuge tubes. Microfuge the tubes at 2,000 r.p.m. and remove the supernatant by aspiration, using an 18–20 G needle. Resuspend the beads in 1 ml wash buffer and recentrifuge—repeat this wash procedure four more times. Resuspend the beads in 1 ml of bicarbonate buffer and centrifuge—repeat this wash procedure in bicarbonate buffer four more times.
-
13
Elute biotinylated peptides from the streptavidin beads by incubation with 150 μl of 100 mM β-mercaptoethanol for 5 min with gentle inversion at RT. Microcentrifuge samples at 4,000 r.p.m. for 10 min and transfer the supernatant containing eluted peptides to a fresh silanized microcentrifuge tube. Place the eluted peptides in an unheated SpeedVac and concentrate to near-dryness (30–60 min).
Critical Step
Avoid complete drying to limit sample losses and thiol oxidation.
Pause point
Samples may be stored at −80 °C (stable for months) until the day of nLC-MS/MS analysis.
-
14
Thaw and reconstitute dried samples in 20 μl of 0.1% TFA for analysis by nLC-MS/MS. Transfer 8 μl of the TFA-reconstituted peptide mixture to LC auto-injector vials for nLC-MS/MS analysis.
-
15
Perform the MS/MS analysis database searching as detailed in EQUIPMENT SETUP; manual inspection of MS/MS spectra may be helpful for validation of low-scoring computer-based peptide identifications9.

Troubleshooting
Failure to detect SNO peptide signals in positive control samples
If SNO peptides are not detected in the positive control sample, it is possible that the sample contains lower than the intended amount of SNO-Cys. The concentration of total S–NO in samples prepared for SNOSID analysis (such as in Step 3) can be determined using an NO-selective biosensor10 or using ozone chemiluminescence11 after NO dissociation is elicited by sample treatment with CuCl2 or HgCl2. Peptide detection limits of modern ion trap mass spectrometers are commonly less than 50 fmol. Allowing for inefficiencies of the SNOSID method, the successful detection of SNO-Cys may require amounts 250 fmol. If positive control samples contain <250 fmol SNO-Cys, it may be necessary to increase SNO-Cys levels by analyzing larger sample amounts (i.e., >1 g). If SNO-Cys levels in positive control samples exceed 250 fmol, consider the possibility of significant S–NO decomposition during sample processing steps (1–8) and detection limitations owing to functional deficits in the LS/MS/MS instrumentation. The major source of SNO decomposition is inadvertent photolysis, that is, not being sufficiently strict in protecting samples from light, especially sunlight, which is UV-rich. The extent of S–NO photolysis can be experimentally evaluated by comparison of results obtained when all procedures are rigorously performed in a dark room (despite the fact that routine work in a dark room is likely to be impractical) versus at the laboratory bench, where more practical light-limiting approaches are exercised.
More than 5% of SNO peptide signals are peptides that do not contain Cys
All SNO-Cys-containing peptides must contain a minimum of one Cys residue. If this expectation is not met for ≥95% of all SNO-Cys peptide “hits” identified in the positive control samples of a SNOSID experiment, then results are uninterpretable. Potential reasons for this failure include incomplete blocking with MMTS, inadequate washing of streptavidin-agarose beads before elution of “authentic” SNO peptides and insufficient stringency of the MS/MS database search criteria.
Presence of a putative SNO peptide signal in a sample not containing ascorbate
The most likely cause is failure to achieve complete blocking of free protein thiols with MMTS. Increase the MMTS concentration in blocking buffer or use less sample protein until ascorbate omission can be shown to result in signal loss. If conditions cannot be identified under which ascorbate omission elicits signal loss, then the signal may be considered to be an experimental artifact, barring independent evidence to the contrary. Notwithstanding, as the relative ability of ascorbate to reduce different protein S–NO bonds will vary with ascorbate concentration, authentic SNO-Cys residues that are resistant to reduction by 2 mM ascorbate (as used in this protocol) will fail to be appropriately validated.
Failure of UV light exposure to elicit the loss of a putative SNO peptide signal
The most likely explanation is that the observed signal does not originate from a SNO-Cys peptide. However, if the signal is attenuated in cells that are treated with a NOS-selective inhibit, or in cells that have been engineered for NOS-gene knockdown, reconsideration of the signal, as derived from a bona fide SNO-Cys, may be justified.
Timing
The entire procedure, including MS analysis and database searching, should take ∼3.5 days to complete for a total of 16 samples (note that these 16 samples may comprise a single tissue sample that is analyzed in duplicate with recommended controls, that is, duplicate samples ± GSNO treatment, ±UV photolysis and ±ascorbate treatment; 2 × 2 × 2 × 2 = 16)
-
Day 1, Steps 1–9: ∼10 h
-
Day 2, Steps 10–12:∼6 h
-
Days 3 and 4, Steps 13 and 14: ∼20 h (nLC-MS/MS analysis and data interpretation)
Anticipated results
As all authentic SNO peptides necessarily contain at least one Cys residue, a valid SNOSID experiment is predicted to find only Cys-containing peptides. In practice, low-level contamination with non-Cys-containing peptides may occur; however, this should not exceed 5% of all identified Cys-containing “hits” in a successful experiment. Bona fide peptide ions that derive from authentic SNO peptides should also fulfill the following criteria: (a) detection when ascorbate is included in the biotin-HPDP labeling step, but not when ascorbate is omitted; (b) detected in light-protected samples, but not following purposeful S–NO photolysis, following UV irradiation. Fulfillment of these two criteria provides the minimum requirement for validation of a given SNOSID experiment and verification of individual hits. The authenticity of an observed endogenous SNO peptide is most convincingly established by control experiments using either NOS-selective inhibitors or NOS-null cells/tissues to prevent NO production and to affirm that SNO peptide detection is dependent on NO biosynthesis.
Goodness-of-fit measures for the observed versus putative (in silica determined) fragmentation ions must also provide sufficient evidence to establish the peptide identity at a prescribed level of statistical certainty. A quantification of the apparent false-positive rate for each experiment can be obtained by comparing the number of peptides discovered when a given MS/MS data set is searched against in silica tryptic digests of forward (predicted open reading frames (ORFs)) and reverse (nonsense ORFs) protein databases. Using this information, one can select a cutoff score for peptide identifications based on any chosen acceptable level of false-positive “hits”, (i.e., percent of identified peptides in the reverse/forward database). In our experience, a false-positive rate of less than 5% is obtained using the recommended Spectrum Mill score cutoffs of 10.0 and 70% SPI.
Figure 2 depicts exemplary results obtained when the SNOSID protocol was applied for identification of S-nitrosylation sites in rat cerebellum. Panel a shows typical LC/MS base peak chromatograms of peptide ions, identified before and after treatment of cerebellar lysates with 5 μM GSNO and application of the SNOSID protocol. Note that before GSNO treatment, a discernible but low abundance of peptide ions was detected, consistent with a low endogenous expression of SNO proteins in rat cerebellum. After GSNO treatment, peptide ions increase markedly in abundance and distribution over the entire base peak chromatogram (compare upper and lower panels in Fig. 2a). In this experiment, SNO-Cys sites could be rigorously identified on more than 50 proteins from GSNO-treated cerebellum. Despite the relatively low apparent abundance of SNO peptides in the control setting (lower panel), endogenous SNO-Cys sites could also be detected and confirmed using the validation criteria defined above. For example, a peptide ion with m/z = 853.4 was found to elute at 20 min on the base peak chromatogram in control (untreated) samples. As shown on the extracted ion chromatograph for m/z = 853.4, detection of this species in the control sample is absolutely dependent on ascorbate treatment (denoted by inclusion in a dotted box in Fig. 2b), and detection is suppressed when cerebellum extracts are pretreated with DTT (not shown). Fragmentation of the m/z = 853.4 precursor ion results in a pattern of product ions that is unambiguously identified as the doubly charged peptide derived from glyceraldehyde phosphate dehydrogenase, comprising residues 143–159 (IVSNASCTTNCLAPLAK). Notably, GAPDH was previously shown to contain a single Cys that is prone to S-nitrosylation (Cys149) (see ref. 12) and which we observe to be present in the peptide identified using SNOSID.
References
Hess, D.T., Matsumoto, A., Kim, S.O., Marshall, H.E. & Stamler, J.S. Protein S-nitrosylation: purview and parameters. Nat. Rev. Mol. Cell Biol. 6, 150–166 (2005).
Lane, P., Hao, G. & Gross, S.S. S-nitrosylation is emerging as a specific and fundamental posttranslational protein modification: head-to-head comparison with O-phosphorylation. Sci. STKE 2001 RE1 (2001).
Hao, G., Derakhshan, B., Shi, L., Campagne, F. & Gross, S.S. SNOSID, a proteomic method for identification of cysteine S-nitrosylation sites in complex protein mixtures. Proc. Natl. Acad. Sci. USA 103, 1012–1017 (2006).
Jaffrey, S.R., Erdjument-Bromage, H., Ferris, C.D., Tempst, P. & Snyder, S.H. Protein S-nitrosylation: a physiological signal for neuronal nitric oxide. Nat. Cell Biol. 3, 193–197 (2001).
Huang, B. & Chen, C. An ascorbate-dependent artifact that interferes with the interpretation of the biotin switch assay. Free Radic. Biol. Med. 41, 562–567 (2006).
Landino, L.M., Koumas, M.T., Mason, C.E. & Alston, J.A. Ascorbic acid reduction of microtubule protein disulfides and its relevance to protein S-nitrosylation assays. Biochem. Biophys. Res. Commun. 340, 347–352 (2006).
Fasman, G. CRC Handbook of Biochemistry and Molecular Biology. 3rd edn. (CRC Press, Cleveland, OH, 1976).
Kluge, I., Gutteck-Amsler, U., Zollinger, M. & Do, K.Q. S-nitrosoglutathione in rat cerebellum: identification and quantification by liquid chromatography-mass spectrometry. J. Neurochem. 69, 2599–2607 (1997).
Chen, Y., Kwon, S.W., Kim, S.C. & Zhao, Y. Integrated approach for manual evaluation of peptides identified by searching protein sequence databases with tandem mass spectra. J. Proteome Res. 4, 998–1005 (2005).
Zhang, X. Real time and in vivo monitoring of nitric oxide by electrochemical sensors—from dream to reality. Front. Biosci. 9, 3434–3446 (2004).
Weissman, B.A. & Gross, S.S. Measurement of NO and NO Synthase. (eds. Crowley, J. et al.) (John Wiley and Sons, New York, 1998).
Hara, M.R. et al. S-nitrosylated GAPDH initiates apoptotic cell death by nuclear translocation following Siah1 binding. Nat. Cell Biol. 7, 665–674 (2005).
Author information
Authors and Affiliations
Corresponding author
Ethics declarations
Competing interests
The authors declare no competing financial interests.
Rights and permissions
About this article
Cite this article
Derakhshan, B., Wille, P. & Gross, S. Unbiased identification of cysteine S-nitrosylation sites on proteins. Nat Protoc 2, 1685–1691 (2007). https://doi.org/10.1038/nprot.2007.210
Published:
Issue Date:
DOI: https://doi.org/10.1038/nprot.2007.210
This article is cited by
-
Identification of S-nitrosylation sites based on multiple features combination
Scientific Reports (2019)
-
Mass spectrometry-based proteomics for system-level characterization of biological responses to engineered nanomaterials
Analytical and Bioanalytical Chemistry (2018)
-
Antibodies to biotin enable large-scale detection of biotinylation sites on proteins
Nature Methods (2017)
-
Global, in situ, site-specific analysis of protein S-sulfenylation
Nature Protocols (2015)
-
Resin-assisted enrichment of thiols as a general strategy for proteomic profiling of cysteine-based reversible modifications
Nature Protocols (2014)
Comments
By submitting a comment you agree to abide by our Terms and Community Guidelines. If you find something abusive or that does not comply with our terms or guidelines please flag it as inappropriate.
