
Abstract
Carbon offsets are a widely used climate policy instrument that can reduce mitigation costs and generate important environmental and social co-benefits. However, they can increase emissions if they lack integrity. We analysed the performance of one of the world’s largest nature-based offset types: human-induced regeneration projects under Australia’s carbon offset scheme. The projects are supposed to involve the human-induced regeneration of permanent even-aged native forests through changes in land management. We analysed 182 projects and found limited evidence of regeneration in credited areas. Changes in woody vegetation cover within the areas that have been credited also largely mirror changes in adjacent comparison areas, outside the projects, suggesting the observable changes are predominantly attributable to factors other than the project activities. The results add to the growing literature highlighting the practical limitations of offsets and the potential for offset schemes to credit abatement that is non-existent, non-additional and potentially impermanent.
Introduction
Carbon offsets are a widely used climate policy instrument that are considered integral to government and corporate decarbonisation plans1,2,3. Under offset schemes, projects that reduce emissions relative to counterfactual baselines receive credits, which can be used by others to offset their emissions. The benefits of offsets include that they can reduce mitigation costs, generate important environmental and social co-benefits, and reduce political resistance to carbon pricing by lowering compliance costs for facilities with carbon liabilities4,5,6.
Whether the environmental and economic benefits of offsets materialise depends on the environmental integrity of the credits. If the credits lack integrity, offsets can facilitate increases in emissions and thereby work against greenhouse gas mitigation objectives. Carbon offsets are considered to have environmental integrity when there is high confidence they represent real, additional and permanent abatement1,7,8,9. In this context, ‘realness’ refers to the extent to which credits reflect carbon removals or emission reductions that are directly attributable to the project activities1,9,10. ‘Additionality’ requires that the credited removals or emission reductions would not have occurred without the incentive provided by the offset scheme11. Permanence relates exclusively to sequestration projects and requires credited removals to persist in relevant carbon stocks like vegetation and soils9,11,12.
Research on the integrity of carbon offsets has found material issues with the realness, additionality and permanence of credited abatement, raising questions about their effectiveness in assisting decarbonisation13,14,15,16,17,18,19,20,21,22,23,24,25. Similar issues have arisen with biodiversity offsets26,27.
Carbon offsets have been a central feature of climate policy in Australia for two decades. Under a provincial mandatory carbon trading scheme (the world’s first) that operated in New South Wales and the Australian Capital Territory between 2003 and 2012 covered facilities were allowed to use offsets from designated project types to meet their emission reduction obligations28. In late 2011, a national carbon offset scheme was introduced, which was relied upon as the main Australian Government mitigation policy between 2014 and 202229. The object of the national offset scheme is to incentivise offset projects that help Australia meet its international greenhouse gas mitigation obligations29. Each credit issued under the scheme is supposed to represent abatement equivalent to one tonne of CO2.
The national offset scheme is now linked to a national mandatory carbon pricing instrument; the Safeguard Mechanism. As with the previous provincial carbon trading scheme, facilities covered by the Safeguard Mechanism can use credits issued under the offset scheme to meet their emission reduction obligations. There are no restrictions on the extent to which covered facilities can rely on offset credits to meet their obligations. The only relevant restriction is that the credits must come from projects registered under the national scheme.
The most popular project type under the national offset scheme is human-induced regeneration of permanent even-aged native forests (HIR)30. HIR projects received 37 million credits to June 2023, almost 30% of the issuances under the scheme31. The projects cover almost 42 million hectares, an area larger than Japan31. As of 30 June 2023, they were the world’s fifth largest nature-based offset type by credit issuances, and the largest when projects involving avoided emissions are excluded (Supplementary Fig. S1).
Under the applicable rules (found in the ‘HIR method’), HIR projects should involve the human-induced regeneration of permanent even-aged native forests across the entirety of the areas that are credited (‘credited areas’) (Fig. 1)30. The projects do not involve planting or direct seeding. Regeneration must be induced by the project activities from ‘the germination of in situ seed, or the growth of in situ seedlings, rootstock or lignotuber’30. The project activities can include reducing grazing pressure from livestock and feral animals, management of non-native plants, and cessation of clearing of native plant regrowth30,32,33.

In the baseline scenario (yellow ribbon), clearing, grazing and/or weeds suppress regeneration of woody plants, ensuring the credited area has predominantly non-woody cover throughout the projection period. In the project scenario (black-red ribbon), the credited area initially has predominantly non-woody cover due to the effects of clearing, grazing and/or weeds. The project involves the removal or mitigation of these suppressors, which leads to even-aged forest regeneration. The credited area should transition from predominantly non-woody cover to predominantly sparse woody cover, and then to forest cover, and retain forest cover throughout the permanence period. In the regions where HIR projects are located, credited areas should have forest cover when tree and debris biomass reaches ~7.2–11 dry metric tonnes (dmt) per hectare.
Sequestration in HIR projects is not directly measured, it is estimated as the product of the size of the credited areas and sequestration per unit area, which is modelled using the Australian Government’s Full Carbon Accounting Model34. The model uses a simple tree yield formula to estimate above-ground biomass per hectare in regenerating forests35,36,37. It assumes credited areas start with little woody biomass and grow towards their maximum woody biomass potential under native vegetation. Maximum above-ground woody biomass potential (M) is modelled spatially using a range of biophysical parameters calibrated against measurements of intact native vegetation38. The most recent calibration of the tree yield formula estimates above-ground biomass in regeneration under average climate conditions after a years to be M.e(−23.81/a) (Supplementary Fig. S2)37.
The above-ground biomass estimates from the model’s tree yield formula are partitioned into biomass and debris pools via standardised allocation ratios (e.g. root-shoot), and turnover and decomposition rates, to calculate carbon accumulation in live above- and below-ground biomass and debris39. The model includes a soil carbon module but it is not used for HIR projects; the projects are credited for increases only in live biomass and dead organic matter.
Most HIR projects are claiming to regenerate native forests by reducing grazing pressure from livestock and/or feral herbivores in arid and semi-arid ‘rangeland’ areas (<350 mm average annual rainfall) that have never been comprehensively cleared of native vegetation (Fig. 2, Supplementary Fig. S3). The location of the projects in uncleared rangelands (where there is often limited and highly variable rainfall) raises questions about the capacity of the credited areas to permanently support material additional woody biomass, and the realness, additionality and permanence of credited abatement40,41,42,43.

The 182 projects analysed in this paper in light green. Source: Australian Government. Area-based Emissions Reduction Fund (ERF) projects. Commonwealth of Australia, Canberra (2023); Department of Climate Change, Energy, the Environment and Water. National Vegetation Information System (NVIS) data products, version 6. Commonwealth of Australia, Canberra (2023); New South Wales Government. NSW State Vegetation Type Map. NSW Government, Sydney (2023); Geoscience Australia. GEODATA COAST 100K 2004. Commonwealth of Australia, Canberra (2023).
Plant growth is constrained by the availability of resources (water, nutrients, light etc.), which limit woody biomass potential under native vegetation44,45,46. In most of Australia’s uncleared rangelands, the key limiting resource is water and its availability depends on variable rainfall, which fluctuates over time-scales from months to decades47. Variations in rainfall and water availability drive changes in plant growth, including woody biomass47,48.
The primary way grazing could affect forest cover in uncleared areas is by impeding woody plant recruitment during recovery after periods of drought or fires, where cover has been lost through tree death49,50,51. For grazing to prevent the regeneration of forests in these circumstances, grazing intensity after a mortality event would need to be sufficiently intense to prevent recruitment and then be maintained over multiple decades to suppress subsequent recruitment. Grazing in Australia’s uncleared rangelands has been shown to have local, short-term effects on regeneration, but assessments over larger spatial and temporal scales show that grazing has not generally reduced tree cover52, and that the influence of grazing alone on woody plants is minimal compared to the effect of variable rainfall53,54,55.
This is illustrated through the well-documented increase in tree cover that occurred across substantial parts of Australia’s grazed eastern rangelands through the twentieth century, particularly following a series of La Niña events from the 1950s that brought above-average rainfall56,57,58,59. Similarly, more than 300,000 ha of secondary native forest is re-cleared annually in Australia in areas previously cleared for grazing39,60,61, typically on cycles of around 8–30 years53,60. This re-clearing would not be necessary if grazing was suppressing regeneration of native forests.
Because grazing does not have a material negative influence on tree cover in Australia’s rangelands, HIR projects are unlikely to regenerate permanent native forest through grazing control in uncleared areas. In some cases, reduced grazing could increase tree cover but, generally, any management-induced increases are likely to be relatively small and often short-lived (since droughts can remove excess biomass accumulated during wet times)62.
The modelling approach used to calculate abatement for HIR projects compounds the resulting integrity risks. Projects could be credited for forest regeneration that has not occurred or that does not persist. The HIR method also does not control for the over-riding impacts of rainfall on regeneration in the rangelands, creating a risk that projects will be credited for increases in tree cover that are mainly attributable to natural variations in rainfall rather than the project activities (i.e. non-additional)42,43.
Here we present the results of an analysis of HIR projects conducted using the Australian Government’s National Forest and Sparse Woody (NFSW) dataset (Version 7.0)63. The dataset provides Landsat-derived estimates of the spatial extent of three classes of woody vegetation cover across Australia over the period 1988 to 2022. The data are a near-annual time series in which 25 m grid cells are classified as either non-woody, sparse woody (sub-forest woody cover where crown cover is between 5–19%) or forest (woody vegetation ≥2 m tall with crown cover >20% over at least 0.2 ha).
The object of our analysis was to assess the performance of HIR projects using two metrics:
-
(1)
the extent of the increase in forest cover and ‘woody cover’ (areas with either forest or sparse woody cover) in the credited areas of HIR projects; and
-
(2)
the extent to which changes in forest and woody cover in the credited areas of HIR projects have mirrored trends in paired controls for each project, comprising 3 km wide buffer areas outside the project boundaries that exclude areas in other HIR projects (‘comparison areas’).
Metric (1) provides a proxy measure of the likely increases in woody biomass in the credited areas of HIR projects. When combined with data on credit issuances, it serves as an indicator of over-crediting risk (i.e. whether sequestered CO2 is likely to be materially less than credited sequestration). Metric (2) provides a measure of the extent to which changes in forest and woody cover in the credited areas of HIR projects are additional to what would otherwise have occurred (i.e. attributable to the project activities or other factors such as rainfall variability). Together, metrics (1) and (2) provide a basis on which to draw conclusions about the extent to which HIR projects have helped Australia meet its international mitigation obligations, consistent with the scheme’s objectives29.
Published estimates of the accuracy of the classifications of pixels to forest, sparse or non-woody in the NFSW dataset suggest accuracy of 95% or more for forest and non-woody classes where no change is indicated, with lower confidence for classification of sparse woody pixels (~66%)39,64. Error rates are likely to be somewhat higher for classification of changes between years, but there is also no reason to expect biases in error between credited areas and comparison areas used in our analysis. Notably, the Australian Government relies on the NFSW dataset to estimate land sector emissions and removals in its greenhouse accounts39. Greenhouse gas outcomes from changes in tree cover in Australia’s rangelands are not accounted for in Australia’s greenhouse accounts if they are not detected in the NFSW dataset. The fact that the Australian Government relies on the NFSW dataset to track reforestation and revegetation for greenhouse accounting purposes justifies its use to assess outcomes from HIR projects.
All HIR projects whose credited area location data were published as of 22 June 2023 and that were registered in or before 2018 (providing at least four data points in the NFSW time series post registration) were included in the analysis, except where they were completely surrounded by other projects or the published spatial files were corrupt65,66. The projects (n = 182) included in the analysis covered a combined area of 9.5 M ha, with their credited areas covering 3.4 M ha (Fig. 2, Table 1). The projects in the sample were registered over the period 11 December 2013 to 30 November 2018, with most (75%) registered in 2015, 2016 and 2017 (Supplementary Fig. S4).
Results
Change in forest and sparse woody cover
The analysed projects received 27.4 million credits over the period from 11 December 2013 (when the first HIR project was registered) to 30 June 2022, suggesting a substantial proportion of the credited areas should have transitioned from non-woody cover to either sparse woody or forest cover because of the human-induced forest regeneration31. This has not occurred.
Almost 50% of the credited areas had sparse woody or forest cover when the projects were registered (median woody cover 46.5% (sd 22.5%), median forest cover 12.7% (sd 12.9%)). This is problematic as it indicates that most projects are seeking to regenerate permanent even-aged native forests on land that contained material amounts of pre-existing woody vegetation. Competition from the pre-existing woody vegetation is likely to limit additional forest regeneration.
Consistent with this, there was relatively little change in woody cover in the credited areas over the study period. Almost 80% of projects (n = 143) experienced negative or negligible change in woody cover in the credited areas over the period from project registration to 2022 (Table 1, see methods for definitions of negative, negligible and positive woody cover change). Despite the absence of positive woody cover change, these 143 projects received 22.9 million credits over the period31.
At an aggregate level, woody cover increased by a mere 0.8% (28,155 ha) across the 3.4 M ha credited area: forest cover increased by 3.6% (124,852 ha); and sparse woody cover decreased by −2.8% (96,697 ha) (Supplementary Fig. 5). By comparison, gains and losses in sparse woody cover alone across Australia averaged 2.2 M ha year−1 and −2.1 M ha year−1 respectively over the period 2013–14 to 2020–2139.
The modest gain in woody cover in the credited areas after project registration continued a trend that started in the late 2000s, before the HIR method was developed (Fig. 3). The increase in woody cover in the credited areas that pre-dates the method is difficult to reconcile with the premise of the projects: that grazing was previously suppressing regeneration and that, without the projects, it would not occur (Fig. 1).

Source: Department of Climate Change, Energy, the Environment and Water. National Forest and Sparse Woody Vegetation Data (Version 7.0 - 2022 Release) (2023); Clean Energy Regulator. Emissions Reduction Fund project register. Commonwealth of Australia, Canberra (2023). The green bar shows when most (75%) of the HIR projects in the sample were registered (2015–2017).
There is a relationship between biomass in forest regeneration (above- and below-ground live biomass, litter, and dead wood) and crown cover in the forest systems where HIR projects are located67. This relationship suggests that forest cover (>20% crown cover) should be achieved when tree and debris biomass reaches 7.2 to 11 tonnes of dry matter per hectare, equivalent to 13.2–20.2 tCO2 ha−1 67. To 30 June 2022, estimated average credited sequestration in the 182 projects in the sample was 12.9 tCO2 ha−1 (median 11.5 tCO2 ha−1, sd 8.9 tCO2 ha−1)31. The estimated credited sequestration in 75 of these projects (41%) was ≥13.2 tCO2 ha−1 (mean 21.6 tCO2 ha−1, median 20.8 tCO2 ha−1, sd 6.5 tCO2 ha−1)31. This suggests that, based on the credits that have been issued, a substantial proportion of the total credited area should have already attained forest cover. However, for the 75 projects with credited sequestration ≥13.2 tCO2 ha−1, only 21% (188,880 ha) of the 898,680 ha total credited area had forest cover in 2022, and this was only a 1.8% (16,530 ha) increase relative to forest cover when the projects were registered (Fig. 4, Supplementary Fig. S6). There is a large apparent disparity between the credited and observed sequestration in the projects.

Note that under the HIR method, forest cover at project registration should be at or near 0% and reach 100% within ~10–15 years of when regeneration is modelled to have commenced. Source: Department of Climate Change, Energy, the Environment and Water. National Forest and Sparse Woody Vegetation Data (Version 7.0 − 2022 Release) (2023); Clean Energy Regulator. Emissions Reduction Fund project register. Commonwealth of Australia, Canberra (2023).
Change in woody cover relative to trends in external comparison areas
Changes in forest and sparse woody cover in credited areas were far more strongly correlated with changes in cover in comparison areas than to the timing of project registration. Table 2 presents standardised coefficients from hierarchical regression models predicting annual cover changes in credited areas as a function of cover changes in comparison areas and a variable indicating whether the year of observation was before or after project registration. The coefficients for comparison areas are many times larger than those for project registration. Project registration did have a statistically significant effect for forest cover change, but not for woody cover change. While statistically significant, the identified effect of project registration on forest cover was small, being equivalent to ~0.5% per year following project registration.
The extent to which changes in forest and sparse woody cover within credited areas have mirrored changes in comparison areas suggests the limited changes observed within the credited areas are largely non-additional. As shown in Figs. 3, 5 (Supplementary Table S1, Fig. S7), there was a strong correlation between forest and sparse woody cover changes in the credited areas and comparison areas over the period before projects were first registered. Post registration, the correlation was maintained, suggesting factors other than the project activities (most likely rainfall variability) have been the dominant influence on woody cover changes.
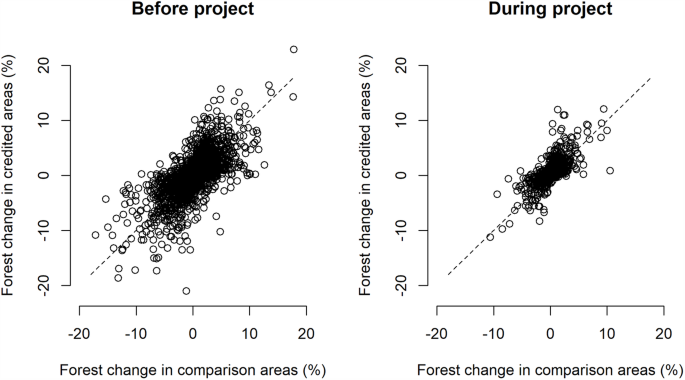
Dashed lines indicate 1:1. Source: Department of Climate Change, Energy, the Environment and Water. National Forest and Sparse Woody Vegetation Data (Version 7.0 − 2022 Release) (2023); Clean Energy Regulator. Emissions Reduction Fund project register. Commonwealth of Australia, Canberra (2023).
It is important to note that, while changes in forest and sparse woody cover relative to external comparison areas provide a useful indicator of the impact of project activities, they should not be construed as the only indicator of project effectiveness. HIR projects are credited on the basis that even-aged native forest is regenerating across the entirety of the credited area and that, within ~10–15 years of when regeneration is modelled to have commenced, all of the credited area will have forest cover. The modest gain in woody cover observed within credited areas, and small effect of project registration on forest cover change, suggest this is unlikely to occur.
Discussion
Reforestation, avoided forest conversion and improved forest management have the potential to generate substantial amounts of low-cost abatement, while providing important biodiversity and other co-benefits68,69. Carbon offset schemes can incentivise these activities and reduce the economic cost of decarbonisation. However, the benefits of these nature-based offsets are contingent on offset projects being credited only for real, additional and permanent increases in relevant carbon stocks. Our findings suggest that HIR projects in Australia’s uncleared rangelands do not meet this requirement.
There was only a small positive overall increase in forest cover (3.6%), and negligible increase in combined sparse woody and forest cover (0.8%), across the combined 3.4 Mha credited area, where the 182 assessed projects are supposedly regenerating permanent even-aged native forests. Despite the absence of material increases in woody cover, the projects received 27.4 million credits over the study period31; 22.9 million credits were issued to projects whose woody cover declined or was largely stagnant.
Given the levels of credited sequestration, the changes in woody cover should be readily apparent, beyond the levels of classification error in the underlying data, which is likely to be in the order of 5–10%39,64. A substantial proportion of the credited areas should have already attained forest cover and, at the very least, there should have been large increases in sparse woody cover that go well beyond changes observed in the external comparison areas. Neither has occurred.
Trends in forest and woody cover in the credited areas largely mirrored fluctuations in comparison areas, both before and after project registration. Regression models of changes in forest and woody cover in the credited areas identified far smaller effects for project registration than for cover changes in comparison areas. The results suggest the changes in forest and woody cover in the credited areas were largely non-additional, presumably because they reflect rainfall variability rather than responses to project activities47,48,52,53,54,55.
The small increases in forest and woody cover, and the small effect of project registration relative to variation in cover in the comparison areas, suggest HIR projects have done little to help Australia meet its international mitigation obligations, both in absolute terms and relative to credit issuances39. The underperformance is accentuated by the fact that, to date, the Australian Government alone has spent ~AU$300 million in purchasing credits from HIR projects and is contractually committed to purchase a further ~AU$1.2 billion70,71.
The results add to the growing literature highlighting the practical limitations of offsets and the potential for offset schemes to credit abatement that is non-existent, non-additional, and potentially impermanent13,14,15,16,17,18,19,20,21,22,23,24,25. They also serve as a reminder of why offsets are considered a high-risk policy instrument10,72,73.
Offsets are high-risk because of two factors: likelihood of error and the consequences when they occur. There is a high probability of error in the design and administration of the rules and processes that are intended to ensure credits are issued only for real, additional and permanent abatement. This is due to multiple factors, including the uncertainties associated with determining counterfactual baselines (what would net emissions have been within the project boundaries in the absence of the incentive provided by the scheme?) and the errors inherent in the measurement of emissions and removals from often dispersed sources and sinks72,74,75. Other pertinent factors that contribute to the likelihood of errors include the difficulty in overcoming adverse selection when seeking to exclude non-additional projects74,76, and the persistent tension within offset schemes to lower the stringency of measurement protocols to reduce transaction costs and thereby promote participation77.
Regardless of the cause, where errors occur and result in the issuance of low integrity credits, their use can lead to worse climate outcomes. This is because offsets are a permission to pollute, issued on the premise that the offset project has abated one tonne of emissions. Hence, when the credited abatement is not real, additional and permanent, offsets can enable an increase in emissions from a polluter with no offsetting emission reduction elsewhere.
The high-risk nature of offsets is why they are deprioritised in the ‘mitigation hierarchy’ that is often used in biodiversity-related regulatory approval processes78; they are supposed to be a last resort reserved for when all other viable avoidance and mitigation options have been exhausted. The risk also provides the basis for the principle that offsets credits should only be used where there is high confidence the credits are likely to represent real, additional and permanent abatement11,29,72,73.
The root cause of the integrity issues with HIR projects is that credited areas have been allowed to be located in areas where native vegetation has not previously been comprehensively cleared, where the capacity to permanently increase forest carbon stocks is generally likely to be small, and in semi-arid and arid rangeland areas where there is substantial natural variability, which makes it difficult to separate the impacts of project activities from rainfall-induced changes11. The integrity problems with HIR projects have been compounded by the use of a modelled approach to the estimation of sequestration and allowing the model to be used in circumstances it was not calibrated for (i.e. to estimate regeneration on sites that contain material amounts of pre-existing woody vegetation)30,37.
Despite the risks, and the evidence of their limitations, carbon offsets are seen as indispensable by many policymakers; as evidenced through the Paris Agreement’s Article 6.4 Mechanism, the Carbon Offsetting and Reduction Scheme for International Aviation and other similar initiatives8,79. With the commitment to their continued use, the challenge for policymakers is to demonstrate that offset schemes can have integrity.
The experience with HIR projects provides two generalisable lessons. First, that sequestration-related offsets are inappropriate for use in situations where the relevant carbon stocks are likely to be at or near their maximum sustainable potentials and where natural variability in the stocks is materially larger than the likely effects of management change. Second, care needs to be taken where models are used to estimate carbon stocks to ensure they are applied appropriately and with due regard to the need for conservativism.
Australia’s experience with HIR projects also highlights the importance of transparency11,80. From January 2013 until June 2023, no data on the location of credited areas were published under the scheme, which shielded projects from scrutiny. At the time of writing, proponents were still not required to publish offset reports or audit reports, or information on how they have modelled sequestration. Proponents are also not required to undertake any direct measurements of biomass in HIR projects and, where biomass measurements are voluntarily undertaken, they are not required to be published. Effective offset schemes require constant scrutiny and critical assessment, including from third parties. This cannot be provided without the public release of all information that is necessary for the proper evaluation of the performance and integrity of offset projects11.
Methods
HIR projects included in sample
As at 10 December 2023, there were 469 registered HIR projects. Up until April 2023, it was unlawful for the Clean Energy Regulator to publish data on the location of credited areas. Following changes to the law in April 2023, the Regulator first published credited area location data for 223 HIR projects on 6 June 2023.
To be included in the sample for the analysis, projects had to have published credited area location data and at least 4 years of data in the NFSW time series post the year they were registered (n = 191). This was to ensure there was a valid basis for determining the response of woody vegetation to the project activities. In addition, projects were excluded from the sample if they were completely surrounded by other projects (n = 4). These projects were excluded because it was not possible to designate a valid comparison area in accordance with the method described below. A further five projects were removed because the spatial data on their credited areas were not useable.
Credited area location data
The Clean Energy Regulator publishes credited area data in vector format. To facilitate our analysis, the dataset was converted into raster format. Due to differences between the map projections of each dataset, credited area data were rasterised using 10-m resolution vs the 25-m of the NFSW dataset. This increase in resolution allowed for improving the accuracy of the masking operation around partially intercepted pixels. To perform this conversion we used the standard gdal_rasterize command from the GDAL library to generate a raster preserving the original projection of the vector dataset81.
Carbon credit issuances
Carbon credit issuance data were obtained from the ERF Project Register published by the Clean Energy Regulator31. The Register contains data on total issuances and total issuances by Australian financial year (1 July–30 June). Credit issuances were included in a calendar year only where they were issued prior to 30 June of the same year. This ensured conservative estimates of credit issuances for the purposes of making comparisons of project performance.
Relative size of HIR projects
The relative size of HIR projects was analysed using data from the registries of seven offset schemes for the period 2013–2023: the ACCU scheme; Clean Development Mechanism; Verified Carbon Standard (VCS, or Verra); Gold Standard; American Carbon Registry; Climate Action Reserve; and Plan Vivo. Data on credit issuances by project type are provided in Supplementary Fig. S1.
External comparison areas
HIR projects have an outer project boundary, which is typically the boundary of the property on which it is located. The credited areas lie within the project boundary. The comparison areas, which are used as paired controls for each project, comprised 3 km wide buffer areas around the outside of project boundaries, excluding areas that intersected with other HIR projects.
The use of these 3 km wide comparison areas is likely to overstate the relative effects of the projects on woody cover. This is due to the way the credited areas are delineated. Under the HIR method, credited areas must contain only areas that have the potential to achieve forest cover (woody vegetation ≥2 m tall with crown cover >20% at 0.2 ha scale). They are also not allowed to have forest cover at commencement. This results in credited areas having exclusions inside and around them, even when the areas are subject to the same project activities (i.e. grazing control) and lie within the same fenced areas. In contrast, the comparison areas are comprised of all land within the 3 km wide buffers, excluding other HIR projects.
The characteristics of the credited areas and comparison areas means that, where the same changes in tree cover occur, there is likely to be a greater proportionate increase (or decrease) in cover in the credited areas relative to the comparison areas. This approach was adopted to ensure conservative outputs and because of the practical difficulty associated with delineating areas that share the same characteristics as the areas included in the credited areas.
National forest and sparse woody dataset analysis
Changes in woody cover (forest and sparse woody cover) in the credited areas and comparison areas were analysed using the Australian Government’s NFSW dataset (Version 7.0)63. The dataset provides Landsat-derived estimates of the extents of three classes of woody vegetation cover across Australia over the period 1988–2022. The data are a near-annual time series in which 25 m grid cells are classified as either non-woody, sparse woody (sub-forest woody cover where crown cover is between 5–19%) or forest (woody vegetation ≥2 m tall with crown cover >20% over at least 0.2 ha).
The analysis was undertaken using Terrak.io, a geospatial analytics platform developed by Haizea Analytics. This platform builds upon Cloud infrastructure and can provide on-demand analytics on large satellite and climate datasets through an API. Users can rely on Terrak.io to generate maps or zonal statistics showing temporal trends for large numbers or areas, defined using custom vector polygons. This infrastructure was used to calculate zonal statistics on the frequency of forest, sparse woody, and non-woody cover pixels within each project’s credited areas and comparison areas.
Classifying project changes in forest and sparse woody cover since registration
To assess whether woody cover in the credited areas of each project (i.e. the proportion of pixels with forest or sparse woody cover) experienced negative, negligible and positive change since the projects were registered (i.e. the results presented in Table 1), simple linear regression models were fit for each project to the time-series of the forest and sparse woody percentages in their credited areas from the year of registration forward, with the percentage of each cover class as the response variable and year as the only independent variable.
Projects were classified as having increased woody cover if the slope of either of the fits for forest or sparse cover was greater than 0.25% per year, provided the slope for the fit to the other woody cover class (i.e. sparse if the forest fit has a positive slope >0.25%) was greater than −0.05% per year.
Tree cover was deemed to be negligible if the sum of the slopes from the linear models fit to the sparse and forest cover were greater than −0.25% per year, and they did not meet the ‘increased’ requirements.
Projects whose tree cover did not meet either the ‘increased’ or ‘negligible’ requirements were deemed to have decreasing cover.
Comparing cover trends in carbon estimation areas and adjacent comparison areas
Changes in woody cover were calculated from the time-series of NFSW data from 1988 to 202263. The percentage of pixels within the credited areas and comparison area classified as forest in each year was subtracted from the percentage of forest pixels in the preceding time point in the time series. Most time steps were annual, including all from 2004 on, but some spanned two or more years (’89–’91, ’92–’95, ’95–’98, ’98–2000, 2000–’02 and ’02–’04).
Hierarchical linear regression models, built using the lme4 package82 in R (4.3.0, R Core Team 2022)83, were used to model cover changes within credited areas as a function of cover changes in comparison areas (indicating responses to broader environmental drivers) and a binary variable indicating whether the interval over which cover changes occurred was before or after the year of project registration. Models were built to include random effects accommodating the numerous observations made for each project by fitting separate intercepts for projects, as well as coefficients for the two fixed-effects (cover change in comparison areas and project registration) and a higher level intercept (Eq. (1), in the syntax of lmer: project_cover_change ~ comparison_area_change + registration + (1|project_ID)). Statistical significance of predictors was assessed via the anova function, by comparing the full model to models with each predictor removed in turn.
The cover change variables for credited areas (response) and comparison areas (fixed effect 1) were standardised (centred and scaled) by subtracting the variable mean from each observation, and dividing by its standard deviation (Supplementary Table S2). The binary variable for project registration was not standardised (pre-registration = 0, post-registration = 1). This means that the coefficient for the comparison area predictor in each model is a measure of effect size, indicating the expected magnitude of change in the response credited area cover variable (in standard deviations) for a one standard deviation change in comparison area cover. The coefficient for project registration (β2) indicates the effect of project registration on year-to-year cover change in credited areas, again in units of standard deviation for the response variable, i.e. cover change in credited areas.
The strength of portfolio-scale correlations between the extent of each cover class (forest, sparse or woody) in the combined credited areas and in comparison areas, across the 182 projects (i.e. variables plotted in Fig. 3), was assessed using Pearson’s correlation coefficient from the cor.test function in R83. Correlation coefficients were also calculated for annual cover changes inside credited areas and in adjacent comparison areas, for both forest and woody cover classes (Supplementary Table S1).
Estimating credited sequestration
Credited sequestration was estimated using data from the ERF Project Register31. Total credit issuances to each project to 30 June 2022 were adjusted to account for relevant discounts (5% risk of reversal buffer and a 20% permanence period discount for projects with 25 year permanence periods). A uniform and conservative 0.5% deduction was made to account for fossil fuel use, based on Australian Government analysis of a sample of HIR projects that found average fuel use emissions were less than 0.02% of total project abatement84. The resulting estimates were converted from CO2 to C using the atomic mass ratio, 44/12.
The approach used to compare credited sequestration to forest cover is conservative. Ideally, the comparison of forest cover to sequestration would be undertaken using the modelled sequestration for each project. This would ensure the estimates account for the fact that projects have been allowed to commence modelling regeneration before the projects were registered. Due to this, the amount of modelled sequestration across the projects is greater than the credited sequestration, accentuating the extent of relative underperformance. It was not possible to analyse the modelled sequestration because of transparency issues. Estimates of modelled sequestration are not published and no verified data are published on the modelling parameters used in HIR projects. At the time of writing, information about the choice of model calibration and modelling commencement dates had been published by the proponents of 63 HIR projects. However, the published data were incomplete (e.g. modelling points are not published) and unverified, rendering them unusable for these purposes.
Australian Government expenditure on carbon credits from HIR projects
We estimate that, to 4 December 2023, the Australian Government had spent ~AU$300 million in purchasing credits from HIR projects and was contractually committed to purchase a further ~AU$1.2 billion. The Australian Government does not publish data on carbon credit purchases or contracted credit prices by project. Due to this, our estimate of Australian Government expenditure on credits from HIR projects was based on the number of credits sold by each project to the Australian Government under Emissions Reduction Fund contracts, up until 4 December 202370. Where contracts had multiple projects, the recorded credit sales were assumed to be sourced evenly from the contracted projects. Sale prices were assigned to each project based on the published weighted average carbon credit purchase price from the Emissions Reduction Fund auction at which the relevant project was contracted (range AU$10.23-AU$17.35)71. The estimate of the value of the remaining HIR credits contracted by the Australian Government was based on the number of credits originally contracted, less those delivered and the number of credits released or lapsed from delivery obligations70. The contracted prices assigned to each project were again based on the weighted average carbon credit purchase price from the Emissions Reduction Fund auction at which the relevant project was contracted70,71.
Data availability
The datasets generated during and/or analysed during the current study, including a summary of individual project data, are available on Figshare at: https://figshare.com/ [DOI: 10.6084/m9.figshare.25199786 and 10.6084/m9.figshare.25199789].
Code availability
Details of the hierarchical linear regression models developed in the study are provided above.
References
Schneider, L. & La Hoz Theuer, S. Environmental integrity of international carbon market mechanisms under the Paris Agreement. Clim. Policy 19, 386–400 (2019).
Black, R. et al. Taking stock: A global assessment of net zero targets.(Energy & Climate Intelligence Unit and Oxford Net Zero,United Kingdom, 2021).
Dawes, A. et al. Voluntary Carbon Markets: A Review of Global Initiatives and Evolving Models. (Center for Strategic and International Studies, Washington, DC, 2023).
Bushnell, J. The Economics of Carbon Offsets. in The Design and Implementation of U.S. Climate Policy (eds Don Fullerton and Catherine Wolfram) 197–209 (University of Chicago Press, 2010).
Kopp, R. Role of Offsets in Global and Domestic Climate Policy. In Proc. National Research Council, Modelling the Economics of Greenhouse Gas Mitigation: Summary of a Workshop 92–99 (The National Academies Press, Washington, DC, 2011).
Tavoni, M. et al. Forestry and the carbon market response to stabilize climate. Energy Policy 35, 5346–5353 (2007).
Breidenich, C., Magraw, D., Rowley, A. & Rubin, J.W. The Kyoto Protocol to the United Nations Framework Convention on Climate Change. Am. J. Int. Law 92, 315–331 (1998).
United Nations Framework Convention on Climate Change, Conference of the Parties. Adoption of the Paris Agreement, Decision 1/CP.21, paragraph 37 (2016).
Stubbs, M. et al. Agriculture and Forestry Offsets in Carbon Markets: Background and Selected Issues. (Congressional Research Service, Washington, DC, 2021).
Goodward, J., Kelly, A. The Bottom Line on Offsets. (World Resources Institute, Washington, DC, 2010).
Integrity Council for the Voluntary Carbon Market. Core Carbon Principles. (ICVCM, London, 2023).
Marland, G. et al. Accounting for sequestered carbon: the question of permanence. Environ. Sci. Policy 4, 259–268 (2001).
Kollmuss, A. et al. Has Joint Implementation reduced GHG emissions? Lessons learned for the design of carbon market mechanisms. (Stockholm Environment Institute, Stockholm, 2015).
Calel, R. et al. Do Carbon Offsets Offset Carbon? (Munich Society for the Promotion of Economic Research, Munich, 2021).
Cames, M. et al. How additional is the Clean Development Mechanism? Analysis of the application of current tools and proposed alternatives. (INFRAS and Stockholm Environment Institute, Zürich, 2016).
Passey, R. et al. The governance challenge for implementing effective market-based climate policies: a case study of The New South Wales Greenhouse Gas Reduction Scheme. Energy Policy 36, 3009–3018 (2008).
Schneider, L. & Kollmuss, A. Perverse effects of carbon markets on HFC-23 and SF6 abatement projects in Russia. Nat. Clim. Change 5, 1061–1064 (2015).
Randazzo, R. et al. Improved assessment of baseline and additionality for forest carbon crediting. Ecol. Appl. 33, e2817 (2023).
Guizar-Coutiño, A. et al. A global evaluation of the effectiveness of voluntary REDD+ projects at reducing deforestation and degradation in the moist tropics. Conserv. Biol. 36, e13970 (2022).
Badgley, G. et al. California’s forest carbon offsets buffer pool is severely undercapitalized. Front. For. Glob. Change 5, 930426 (2022).
Badgley, G. et al. Systematic over-crediting in California’s forest carbon offsets program. Glob. Change Biol. 28, 1433–1445 (2022).
Coffield, S. et al. Using remote sensing to quantify the additional climate benefits of California forest carbon offset projects. Glob. Change Biol. 28, 6789–6806 (2022).
West, T. A. P. et al. Overstated carbon emission reductions from voluntary REDD+ projects in the Brazilian Amazon. PNAS 117, 24188–24194 (2020).
West, T. A. P. et al. Action needed to make carbon offsets from forest conservation work for climate change mitigation. Science 381, 873–877 (2023).
Stapp, J. et al. Little evidence of management change in California’s forest offset program. Commun. Earth. Environ. 4, 331 (2023).
Gibbons, P. et al. Outcomes from 10 years of biodiversity offsetting. Glob. Change Biol. 24, e643–e654 (2018).
zu Ermgassen, S. et al. The ecological outcomes of biodiversity offsets under “no net loss” policies: a global review. Conserv. Lett. 12, e12664 (2019).
NSW Independent Pricing and Regulatory Tribunal. NSW Greenhouse Reduction Scheme—Strengths, Weaknesses and Lessons Learned (IPART, Sydney, 2013).
Carbon Credits (Carbon Farming Initiative) Act 2011 (Cwlth).
Carbon Credits (Carbon Farming Initiative) (Human-Induced Regeneration of a Permanent Even-Aged Native Forest—1.1) Methodology Determination (2013).
Clean Energy Regulator. Emissions Reduction Fund project register. (Commonwealth of Australia, Canberra, 2023).
Evans, M. C. et al. Carbon farming via assisted natural regeneration as a cost-effective mechanism for restoring biodiversity in agricultural landscapes. Environ. Sci. Policy 50, 114–129 (2015).
Evans, M. C. Effective incentives for reforestation: lessons from Australia’s carbon farming policies. Curr. Opin. Environ. Sustain. 32, 38–45 (2018).
Richards, G. & Evens, D. Development of a carbon accounting model (FullCAM Vers. 1.0) for the Australian continent. Aust. For. 67, 277–283 (2004).
Waterworth, R. et al. A generalised hybrid process-empirical model for predicting plantation forest growth. Forest Ecol. Manag. 238, 231–243 (2007).
Paul, K. et al. Improved models for estimating temporal changes in carbon sequestration in above-ground biomass of mixed-species environmental plantings. Forest Ecol. Manag. 338, 208–218 (2015).
Paul, K. & Roxburgh, S. Predicting carbon sequestration of woody biomass following land restoration. Forest Ecol. Manag. 460, 117838 (2020).
Roxburgh, S. et al. A revised above-ground maximum biomass layer for the Australian continent. Forest Ecol. Manag. 432, 264–275 (2019).
Department of Climate Change, Energy, the Environment and Water. National Inventory Report 2021. (Commonwealth of Australia, Canberra, 2023).
Butler, D. et al. Australian National University (ANU)-University of New South Wales (UNSW) ERF research team submission to the Chubb Review. (Department of Climate Change, Energy, the Environment and Water, Canberra, 2022).
Wilson, R. et al. Why offsets are not a viable alternative to cutting emissions. (Climate Analytics, Berlin, 2023).
Australian Academy of Science. Review of Four Methods of Generating Australian Carbon Credit Units. (Australian Academy of Science, Canberra, 2022).
Wentworth Group of Concerned Scientists. Submission to the Independent Review of Australian Carbon Credit Units. (Department of Climate Change, Energy, the Environment and Water, Canberra, 2022).
Richards, G. & Brack, C. A continental biomass stock and stock change estimation approach for Australia. Aust. For. 67, 284–288 (2004).
Morton, S. R. et al. A fresh framework for the ecology of arid Australia. J. Arid Environ. 75, 313–329 (2011).
Fensham, R. J. et al. How does clay constrain woody biomass in drylands? Glob. Ecol. Biogeogr. 24, 950–958 (2015).
Ma, X. et al. Drought rapidly diminishes the large net CO2 uptake in 2011 over semi-arid Australia. Sci. Rep. 6, 37747 (2016).
Fensham et al. Rainfall, landuse and woody vegetation cover in semi-arid Australian savannah. J. Ecol. 93, 596–606 (2005).
Eldridge, D. J. et al. Impacts of shrub encroachment on ecosystem structure and functioning: towards a global synthesis. Ecol. Lett. 14, 709–722 (2011).
Sankaran, M. et al. Native ungulates of diverse body sizes collectively regulate long-term woody plant demography and structure of a semi-arid savanna. J. Ecol. 101, 1389–1399 (2013).
Travers, S. et al. Rabbits and livestock grazing alter the structure and composition of mid-storey plants in a wooded dryland. Agric. Ecosyst. Environ. 277, 53–60 (2019).
Witt, G. B. Vegetation changes through the eyes of the locals: the ‘artificial wilderness’ in the mulga country of south-west Queensland. Rangel. J. 35, 299–314 (2013).
Fensham, R. et al. Potential aboveground biomass in drought-prone forest used for rangeland pastoralism. Ecol. Appl. 22, 894–908 (2012).
Landsberg, J. et al. Abundance and composition of plant species along grazing gradients in Australian rangelands. J. Appl. Ecol. 40, 1008–1024 (2003).
Friedel, M. H. Discontinuous change in arid woodland and grassland vegetation along gradients of cattle grazing in central Australia. J. Arid Environ. 37, 145–164 (1997).
Noble, J. C. The Delicate and Noxious Scrub: CSIRO Studies on Native Tree and Shrub Proliferation in the Semi-Arid Woodlands of Eastern Australia. (CSIRO Publishing, Melbourne, 1997).
Burrows, W. H. Seeing the wood(land) for the trees—an individual perspective of Queensland woodland studies (1965-2005). Trop. Grasslands 36, 202–217 (2002).
Fensham, R. & Fairfax, R. Preliminary assessment of gidgee (Acacia cambagei) woodland thickening in the Longreach district, Queensland. The Rangel. J. 27, 159–168 (2005).
Witt, B. et al. Is ‘vegetation thickening’ occurring in Queensland’s mulga lands—a 50-year aerial photographic analysis. Aust. J. Bot. 57, 572–582 (2009).
Queensland Department of Environment and Science. Statewide Landcover and Trees Study: 2020–21 SLATS Report. (Queensland Government, Brisbane, 2023).
NSW Department of Planning and Environment. Results for NSW Vegetation Clearing 2021. (NSW Government, Sydney, 2023).
Fensham, R. et al. To what extent is drought‐induced tree mortality a natural phenomenon? Glob. Ecol. Biogeogr. 28, 365–373 (2019).
Department of Climate Change, Energy, the Environment and Water. National Forest and Sparse Woody Vegetation Data (Version 7.0 - 2022 Release) (Commonwealth of Australia, Canberra, 2023).
Department of the Environment and Energy. National Inventory Report 2017. (Commonwealth of Australia, Canberra, 2019).
Macintosh, A. et al. HIR Project Data Summary. Figshare (2024). https://doi.org/10.6084/m9.figshare.25199786.
Macintosh, A. et al. Forest & Sparse Woody Cover in HIR Projects. Figshare (2024). https://doi.org/10.6084/m9.figshare.25199789.
Larmour, J. et al. Relating canopy cover and average height to the biomass of the stand. Report for the Department of the Environment and Energy. (CSIRO, Canberra, 2019).
Austin, K. et al. The economic costs of planting, preserving, and managing the world’s forests to mitigate climate change. Nat. Commun. 11, 5946 (2020).
Nabuurs, G-J. et al. Agriculture, Forestry and Other Land Uses (AFOLU). In IPCC, 2022: Climate Change 2022: Mitigation of Climate Change. Contribution of Working Group III to the Sixth Assessment Report of the Intergovernmental Panel on Climate Change (eds. Shukla P. R. et al.) (Cambridge University Press, Cambridge, UK and New York, NY, USA 2022).
Clean Energy Regulator. Carbon abatement contract register. (Commonwealth of Australia, Canberra, 2023).
Clean Energy Regulator. Auction results. (Commonwealth of Australia, Canberra, 2023).
Gillenwater, M., Seres, S. The Clean Development Mechanism: A Review of the First International Offset Program. (Pew Center on Global Climate Change, Washington, DC, 2011).
United Nations Framework Convention on Climate Change, Conference of the Parties serving as the meeting of the Parties to the Kyoto Protocol (CMP). Modalities and procedures for a clean development mechanism as defined in Article 12 of the Kyoto Protocol, Decision 3/CMP.1, paragraph 45 (2005).
Bushnell, J. Adverse Selection and Emissions Offsets. Energy Institute at HAAS. Working Paper 222. (University of California, Berkeley, 2011).
Smith, P. et al. How to measure, report and verify soil carbon change to realize the potential of soil carbon sequestration for atmospheric greenhouse gas removal. Glob. Change Biol. 26, 219–241 (2020).
Burke, P. J. Undermined by adverse selection: Australia’s direct action abatement subsidies. Econ. Papers 35, 216–229 (2016).
Victor, D. The Politics and Economics of International Carbon Offsets. In Proc. National Research Council, Modelling the Economics of Greenhouse Gas Mitigation: Summary of a Workshop 132–142 (The National Academies Press, Washington, DC, (2011).
Arlidge, W. et al. A global mitigation hierarchy for nature conservation. BioScience 68, 336–347 (2018).
International Civil Aviation Organization. Assembly Resolution A41-22: Consolidated statement of continuing ICAO policies and practices related to environmental protection—Carbon Offsetting and Reduction Scheme for International Aviation (CORSIA). (ICAO, Montreal, Canada, 2022).
Gupta, A. & Mason, M. Disclosing or obscuring? the politics of transparency in climate governance. Curr. Opin. Environ. Sustain. 18, 82–90 (2016).
GDAL/OGR contributors. GDAL/OGR Geospatial Data Abstraction software Library. Open Source Geospatial Foundation (2022). URL https://gdal.org. https://doi.org/10.5281/zenodo.5884351.
Bates, D. et al. Fitting linear mixed-effects models using lme4. J. Stat. Softw. 67, 1–48 (2015).
R Core Team. R: A language and environment for statistical computing. R Foundation for Statistical Computing, Vienna, Austria (2022).
Emissions Reduction Assurance Committee. Review of the Human-Induced Regeneration and Native Forest from Managed Regrowth methods. (Commonwealth of Australia, Canberra, 2018).
Author information
Authors and Affiliations
Contributions
A.M., D.B., P.L. and M.E. initiated and designed the research, with input from D.A. and M.W. A.M. led the drafting, with input from all authors, except P.S. D.B. designed and performed the statistical analysis. P.L. processed and analysed the woody cover data. A.M. compiled and analysed data on projects and crediting. R.F., D.E., D.L. and P.G. provided input on drafting and the literature review. P.S. designed and illustrated Fig. 1.
Corresponding authors
Ethics declarations
Competing interests
The authors declare the following competing interests. A.M. is a non-executive director of Paraway Pastoral Company Ltd. Paraway Pastoral Company Ltd has offset projects under Australia’s offset scheme. Paraway Pastoral Company Ltd does not have any human-induced regeneration projects. A.M., D.B., D.A. and M.W. advise public and private entities on environmental markets and Australia’s carbon offset scheme, including on the design of carbon offset methods. The remaining authors have no competing interests.
Peer review
Peer review information
Communications Earth & Environment thanks Thales A. P. West, Michael Köhl and Shane Coffield for their contribution to the peer review of this work. Primary Handling Editors: Jinfeng Chang and Martina Grecequet. A peer review file is available.
Additional information
Publisher’s note Springer Nature remains neutral with regard to jurisdictional claims in published maps and institutional affiliations.
Supplementary information
Rights and permissions
Open Access This article is licensed under a Creative Commons Attribution 4.0 International License, which permits use, sharing, adaptation, distribution and reproduction in any medium or format, as long as you give appropriate credit to the original author(s) and the source, provide a link to the Creative Commons licence, and indicate if changes were made. The images or other third party material in this article are included in the article’s Creative Commons licence, unless indicated otherwise in a credit line to the material. If material is not included in the article’s Creative Commons licence and your intended use is not permitted by statutory regulation or exceeds the permitted use, you will need to obtain permission directly from the copyright holder. To view a copy of this licence, visit http://creativecommons.org/licenses/by/4.0/.
About this article

Cite this article
Macintosh, A., Butler, D., Larraondo, P. et al. Australian human-induced native forest regeneration carbon offset projects have limited impact on changes in woody vegetation cover and carbon removals. Commun Earth Environ 5, 149 (2024). https://doi.org/10.1038/s43247-024-01313-x
Received:
Accepted:
Published:
DOI: https://doi.org/10.1038/s43247-024-01313-x
Comments
By submitting a comment you agree to abide by our Terms and Community Guidelines. If you find something abusive or that does not comply with our terms or guidelines please flag it as inappropriate.
