
Abstract
Carbon offsets from the REDD+ (reducing emissions from deforestation and degradation) framework to protect forests are expected to see a 100-fold increase in market value by 2050. However, independent causal impact evaluations are scarce and only a few studies assess benefits to communities themselves, a core objective of REDD+. Following a pre-analysis plan, we use a before-after-control-intervention (BACI) framework to evaluate the impact of a large-scale voluntary REDD+ project in Sierra Leone—the Gola project. We use a panel of both satellite images and household surveys to provide causal evidence of the impact of the project on local deforestation rates and socioeconomic indicators over the first 5 yr of its implementation. We find that REDD+ slowed deforestation by 30% relative to control communities while not changing economic wellbeing and conservation attitudes. We find suggestive evidence that the programme increased the value of alternative income sources, by shifting labour away from forest-dependent farming activities. A cost-to-carbon calculation shows that REDD+ led to 340,000 tCO2 in avoided emissions per year, with an estimated cost of US$1.12 per averted tCO2. Our study contributes to developing an evidence base for voluntary REDD+ projects and offers a robust approach to carry out BACI assessments.
Main
Voluntary carbon offset markets from projects in the tropics are expected to contribute to meeting net-zero climate change objectives in the Global North. In voluntary markets, certified third-party agencies sell carbon credits to buyers who aim to reduce their carbon footprint beyond levels legally required either by national domestic legislation or international commitments1.
Recently, there has been a surge in voluntary carbon credits, with the market value rising from US$473 million (all $ values in US dollars henceforth) in 2020 to edging close to $2 billion at the end of 20222. The value of these offsets is expected to increase at least 100-fold by 2050, as industries and governments aim to meet the 1.5 °C Paris target3. In response to this surging demand, a new offset industry has emerged in which numerous entities develop carbon offset projects and seek their certification from private organizations through verification processes, after which myriad consultancy companies rate their quality and sell the offsets to buyers.
Voluntary carbon offsets can be sourced from different sectors and programmes, including forestry, which has coalesced around voluntary REDD+ projects. REDD+ (reducing emissions from deforestation and degradation) operates predominantly in tropical low-income countries with high rates of deforestation and forest degradation. REDD+ projects essentially provide incentives to (individual or communal) ‘owners’ of carbon-rich forests to reduce the baseline rate of deforestation and degradation, thereby increasing the storage of carbon (known as ‘additionality’). Incentives can be financial (cash subsidies) and/or in-kind such as goods or training, with varying degrees of enforced conditionality4,5. Hundreds of such voluntary REDD+ projects have been initiated globally and have received widespread attention on the basis of their ‘triple-win’ promise: the ability to reduce carbon emissions, improve livelihoods and conserve biodiversity6. However, 60% of REDD+ programmes are not certified to sell offsets in the voluntary carbon credit market, and the remaining is funded by grants7. The latter are very different types of programmes as they are typically not subject to the scrutiny of verification agencies or potential buyers.
Within the overall voluntary carbon credit market scene, REDD+ offsets have become the leading category, constituting 40% of the market. More importantly, in 2021 the market showed a 166% annual increase in the volume of traded carbon credits coming specifically from REDD+ projects that avoid unplanned deforestation and a 972% increase in programmes that avoid planned (legal) deforestation8, signalling the dynamism of forestry-based credits.
Despite this context of ‘REDD+ project-euphoria’, the scientific literature assessing the impacts of voluntary REDD+ offsets remains notably scant9. Carbon credit verification agencies do include monitoring and evaluation as part of their processes to renew voluntary carbon credits. However, the objectivity, transparency and robustness of these assessments have been called into question, undermining the credibility and viability of the voluntary offset market10. This controversy11 has increased the calls within the scientific and policy communities for more independent and rigorous assessments of REDD+ projects9,12,13,14,15.
Two central aspects of voluntary REDD+ projects require independent evaluation: whether they secure carbon additionality (and avoid leakage or displaced deforestation)16,17 and deliver benefits to local communities18. Many evaluations have relied largely on case studies that use data collected ‘after’ REDD+ projects commenced and/or without meaningful information from comparison sites19. Rigorous evaluations (that are purposefully designed to explore causal relationships as opposed to correlations) require the use of empirical methods that both compare locations that benefit from REDD+ projects with comparable control sites, as well as assess relevant data from the pre- and post-REDD+ project period. This enables researchers to undertake so called before-after-control-intervention (BACI) assessments9,14,20,21. Yet, these types of studies are remarkably sparse4.
Supplementary Information A and Supplementary Table 1 summarize published work that uses BACI approaches to assess the environmental effectiveness and livelihood impacts of REDD+ initiatives. The majority of studies focus on non-certified sub-national REDD+ initiatives, or projects that were in the early stages of development (pilot schemes)18,20,21,22,23,24,25,26. The overall picture that emerges from this work on mostly non-certified REDD+ initiatives is that they have had a rather muted impact on deforestation.
Remarkably, just four studies in our review, focus exclusively on actually certified REDD+ projects10,27,28,29. These studies focus on assessing deforestation impacts only and do not assess the livelihood impacts or behavioural mechanisms that could explain any changes in deforestation. They tend to rely on remote sensing data rather than field survey data. Where survey data are included, they tend to be ‘ex-post’ rather than collected ‘before and after’ in recipient/non-recipient control (that is, comparable) groups. A few studies find mildly positive or at least no negative impacts on welfare and livelihood indicators21,23,30.
In sum, the available body of evidence still leaves many under-researched issues concerning the environmental and economic impacts of voluntary carbon offset schemes. In this paper, we contribute to the need to build the evidence base by reporting on a study that evaluates the impacts of an actual certified voluntary REDD+ project. In particular, we contribute a BACI assessment of the impacts of such a project 5 yr after its commencement and consider the causal pathways through which REDD+ operates. Notably, we also add a cost-to-carbon analysis.
Our evaluation focuses on the REDD+ project surrounding the Gola Rainforest National Park (GRNP) in Sierra Leone, West Africa, established in 2011. Visual assessment of satellite images suggests that forest cover within the uninhabited GRNP has largely remained intact (Fig. 1). However, deforestation has increased in the area outside the park boundaries where regulatory prohibitions do not apply. This buffer zone (4 km wide) aims to protect the park from encroachment that may result from growing population pressure and serves as a corridor for species migration between the different park sections. In addition, the buffer zone is the expected area of leakage due to the imposed restrictions of logging within the park. The REDD+ project, is managed by the Gola Rainforest Conservation (GRC) and received certification in 2015 (although project activities started in 2014) by Verra, one of the largest carbon credit certification agencies. Its primary aim is to protect tropical forest inside the GRNP as well as in this buffer zone31. There are no large communities residing within the park; instead, the programme focuses on communities located within the buffer zone. The Gola REDD+ project was also designed to incentivize these buffer zone communities to shift away from traditional to more sustainable agricultural practices (such as forest-friendly crops such as cocoa) through a range of REDD+ activities including agricultural extension to increase yields, marketing support for securing better prices and access to (co-managed) financial services (see Supplementary Information C for a detailed description of the REDD+ programme and previous activities in the area). As is the case with many REDD+ projects4, the incentives for the specific scheme are only weakly conditional on conservation behaviour.
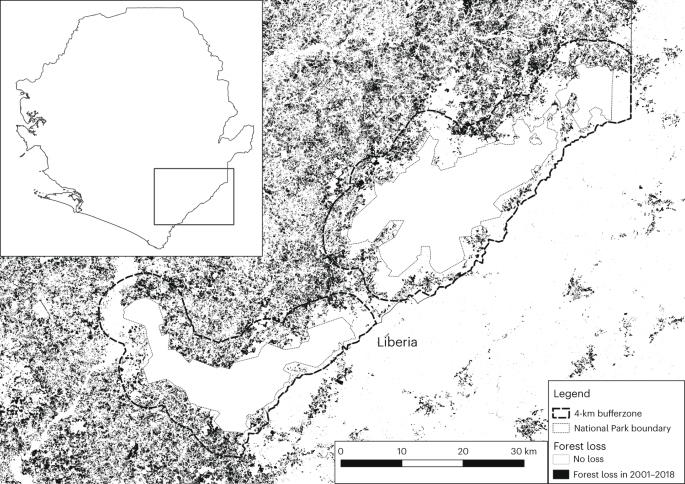
Each pixel shows whether any deforestation took place from 2001 until 2018. The dashed line shows the 4 km buffer zone in which the REDD+ programme took place. Source: ref. 42.
We evaluate the short-run impact of REDD+ on deforestation rates, economic wellbeing and conservation attitudes within the park buffer zone for the first 5 yr of the project, spanning 2014–2018. We use satellite imagery to assess causal changes in deforestation rates and multiple rounds of detailed on-the-ground household-level survey data collected both before and after REDD+ activities began. The latter allows us to estimate the impacts on economic wellbeing and assess potential mechanisms behind any impacts of REDD+ on deforestation rates (see Supplementary Information D for data description). As the interventions were not randomly assigned to communities, our control group consists of comparable communities that lie within the chiefdoms of the park, but outside of the 4 km buffer zone. We conduct a simple cost-to-carbon calculation and compare the estimated cost per averted tonne of carbon to similar programmes globally.
Our study adds to the empirical work on evaluating REDD+ projects and makes several contributions. First, we undertook an analysis of an operational, fully developed, voluntary REDD+ project that actively sells carbon credits in voluntary markets and has been approved by a leading verification agency. As detailed in Supplementary Information A, most published impact evaluation studies on REDD+ projects focus on non-certified initiatives or pilots. Secondly, we established an agreement with the agencies developing the Gola REDD+ project to instate an independent BACI evaluation before the start of the project, which was conducted separately from the verification processes required by Verra. A rare feature of this design among similar studies is that we also made use of detailed baseline household survey collected before the commencement of the project (2014) and corresponding endline data collected more than 5 yr after the project began (2019). In addition, with access to a previous round of data (2010), we were able to explore parallel trends before the programme between project and control sites. Hence, our data allowed for a rigorous impact assessment, evaluating REDD+ impacts on economic wellbeing, deforestation rates, as well as the likely mechanisms that lead to any observed changes in the latter. Our analysis is limited to assessing the impacts of the REDD+ project within the buffer zone and does not include the GRNP itself because there is no credible counterfactual for the GRNP. Also, from a policy and REDD+ design point of view, deforestation pressure and leakage are likely to be larger in the buffer zone. Our analysis strategy is based on a pre-analysis plan that was submitted to an open-access repository before data were analysed (OSF id: 8n7h6). This aspect of our analysis contributes to the objective of improving transparency and credibility, which is increasingly called for and supported by researchers working in the environmental policy domain32,33,34. It is also essential for building the much-needed evidence base of independent and transparent studies on voluntary REDD+ projects.
Results
Deforestation is a severe problem in Sierra Leone which, in the past two decades, has lost ~25% of its tree cover. This trend is mainly driven by small-scale traditional agriculture35. Pressure on protected areas (PAs) in the country is high. Figure 2a,b show forest loss rates within 8 PAs in Sierra Leone and their buffer zones for the 2001–2018 period. Average forest loss within PAs was ~1% yr−1 in the 2013–2018 period, lower than the national average of just under 3% (see Supplementary Fig. 1 for separate graphs for each PA). There is substantial pressure on PA buffer zones, with average deforestation rates of ~2.5% yr−1 between 2013 and 2018. Very similar trends were observed in neighbouring Guinea and Liberia (see Supplementary Fig. 2), all pointing to the need for effective programmes that are able to reduce deforestation in sensitive areas such as PA buffer zones. It is against the backdrop of these worrying trends that we evaluate the impact of the REDD+ project implemented in the crucial buffer zone of the GRNP.
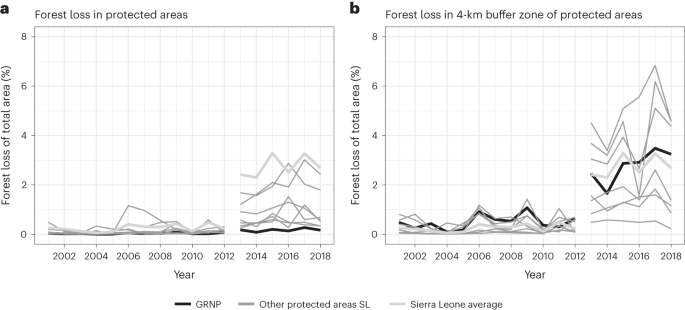
a, Total forest loss from 2001 to 2018 in 8 PAs of Sierra Leone and the average for Sierra Leone. b, Total forest loss from 2001 to 2018 in the 4-km buffer zones of these PAs. The PAs shown are the GRNP, Outamba, Loma Mountains, Western Area Peninsula, Kangari Hills, Tingi Hills, Kambui Hills and Tiwai Island (see Supplementary Fig. 1 for separate graphs for each PA). The break in the lines in 2013 denotes the launch of a new satellite (Landsat 8) resulting in more precise measures of forest loss. Source: ref. 42/UMD/Google/USGS/NASA.
REDD+ impact on deforestation
To assess the impact of the REDD+ project, we focus on changes within REDD+ communities (that is, those in the buffer zone around the GRNP) and compare these to changes in communities adjacent (that is, 4–20 km) to the buffer zone, thereby keeping many factors constant (including population density, demography, land use and market access—all potential drivers of deforestation; see also Supplementary Table 4 for very similar levels of these drivers for REDD+ and non-REDD+ communities). We use data from the 454 communities surrounding the GRNP, of which 126 lie within the 4-km buffer zone and received REDD+ interventions. We examine forest loss for these REDD+ and the remaining 328 non-REDD+ communities over time (covering 2001–2018, with the REDD+ programme starting in 2014). On the basis of community location and population size, we use Voronoi polygons around each community to assign yearly forest loss rates (see Supplementary Information D for a detailed description of the data generation process). Yearly deforestation rates in both types of villages for the evaluation period 2001–2018 are shown in Fig. 3. Visual inspection highlights that before the start of the REDD+ programme, deforestation rates in both groups trended very similarly. After the start of the programme, the percentage forest loss was significantly and substantially higher in non-REDD+ communities compared with REDD+ communities.
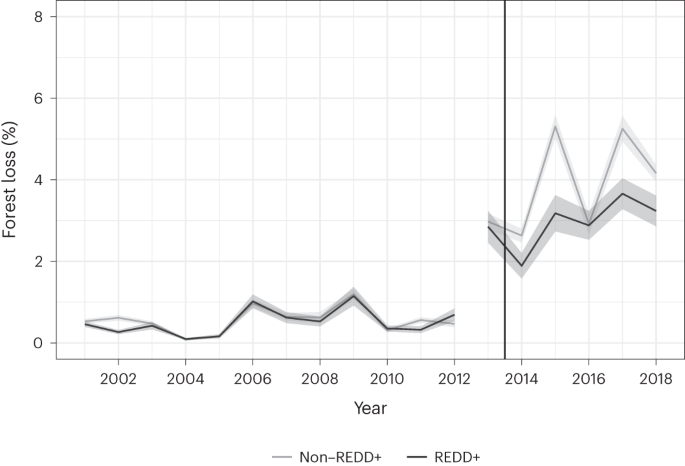
Total forest loss from 2001 to 2018 in REDD+ vs non-REDD+ villages. The village polygons were estimated using population-weighted Voronoi estimations. Data are presented as mean village-level values and shaded areas denote 95% confidence intervals. The vertical black line indicates the start of REDD+. The break in the lines in 2013 denotes the launch of a new satellite (Landsat 8) resulting in more precise measures of forest loss. Source: ref. 42/UMD/Google/USGS/NASA.
To formally test the impact of REDD+ in the GRNP buffer zone, we use a difference-in-difference regression analysis to assess the change in trends over time (Table 1). We find that the REDD+ programme reduced (but not reversed) deforestation in the REDD+ communities by ~1 percentage point (or 30%) compared with non-REDD+ communities. Hence, while the programme reduced the amount of deforestation by ~929 ha yr−1 in the buffer zone, it did not remove pressure on forests completely. Our results are robust to the use of different datasets, using matching combined with difference-in-difference estimates, and alternative definitions of the treatment and control samples (described in detail in ‘Robustness analysis’ and in Supplementary Information F).
To benchmark these changes in deforestation, we perform a cost-to-carbon analysis. The REDD+ project led to ~340,000 tCO2 in avoided emissions per year, with an estimated cost per averted tCO2 of $1.12. We further place this calculation into perspective in ‘Discussion’ (full details of the calculations can be found in Supplementary Information G).
REDD+ impact on economic wellbeing and conservation attitudes
To measure how economic wellbeing and conservation attitudes in the REDD+ buffer zone communities were impacted by the project, we use detailed primary data from household surveys of N = 841 households collected before (2014) and 5 yr after the programme started (2019). We find an overall increase of 0.222 s.d. in the economic wellbeing index over the 5 yr of the programme, which comprises a substantial and significant improvement (see Column 2 of Table 1). However, this increase cannot be attributed to REDD+ as there is no difference between REDD+ and non-REDD+ communities (the coefficient for the difference is small at 0.022 s.d.).
We also find no evidence that conservation attitudes changed due to the programme (see Table 1, Column 3). Between the survey waves, the index for pro-conservation attitudes lowered substantially in both types of villages, by ~0.226 s.d. Although the attitudinal index is an outcome variable on its own right, it can also be viewed as a mechanism driving the impact of deforestation. We find no evidence of such a causal mechanism at work, so we explore other mechanisms in the next section.
For results on each survey indicator, as specified in our pre-analysis plan, refer to Supplementary Information E presenting standardized outcomes in Supplementary Tables 10 and 11 and unstandardized outcomes in Tables 12 and 13. We also include a series of secondary outcomes (consisting of alternative wealth measures) in Supplementary Tables 14 and 15. Across all of these tables, the interaction term is never large or significant. Our results are also robust to using alternative quasi-experimental methods (described in detail in ‘Robustness analysis’ and in Supplementary Information F).
It is important to emphasize that while the Gola REDD+ project has not improved local economic wellbeing or conservation attitudes, we can equally conclude that the project has not resulted in any economic harm or undermining of pro-conservation sentiments. Such ‘no harm’ is a vital feature for the viability of REDD+ projects that cannot be overestimated19. More importantly, our finding has enhanced significance in the associated literature, as it stems from a more robust methodological approach.
Potential mechanisms
We next explore other mechanisms that could explain the observed reduction in deforestation rates. Earlier studies have pointed to changes in the local labour allocation as a key factor affecting traditional small-scale agriculture in Sierra Leone5,36,37. Using the same household survey data collected before and after the intervention from both treated and control communities, we explore several such possible mechanisms in Table 2.
We first assess an index of labour availability for the three main types of farms (upland, swampland and plantation). In REDD+ communities, there is a sharp reduction (0.545 s.d.) in access to farm labour (Column 1). In real terms, this reduction translates to a change in labour access of 0.534 on a scale from 0 to 3, where 3 indicates high labour access. This suggests that high labour demand for the activities supported through the REDD+ intervention reduces the amount of labour available for land clearing activities.
Secondly, incomes from farm wages are substantially higher (0.199 s.d.) in REDD+ communities since the start of the interventions (Column 2). This amounts to an increase of income from farm wages of 43.5%. Non-REDD+ communities at baseline had a yearly farm wage income of 29,000 Leones (or $6.7; in 2014, 1$ was ~4,320 Leones). The REDD+ project may have increased the opportunity cost of labour by providing alternative income possibilities. When farmers choose to pursue these alternative income possibilities, it leaves fewer labourers available for the local labour market (and thus reducing labour access). This in turn leaves fewer labourers for conventional, labour-intensive traditional agriculture, which is associated with deforestation. This lower labour availability and higher opportunity cost increase the local labour price, which increases income from working on other people’s farms. Because a decrease in labour access could also be driven by out-migration in the REDD+ communities, we test whether community population size changed due to the REDD+ programme and find no evidence for this (see Supplementary Table 16). Also, note that this increase in farm wages does not result in overall increases in economic wellbeing.
Because the REDD+ programme aimed to provide more ecologically sustainable (or forest-friendly) alternative income sources, we examine trends in such sources. We explore income from the sale of non-timber forest products (NTFP). NTFPs are collected in forested areas (including within the GRNP). The activity is encouraged by the GRC, as it is non-invasive and creates incentives for protecting the national park. We find a substantial increase in NTFP incomes of 0.343 s.d. in REDD+ communities in the later period (Column 3). This translates to a 56.7% increase in NTFP income attributable to the REDD+ programme. In contrast, non-REDD+ communities exhibited no statistically significant change in their NTFP income and had a baseline value of ~108.400 Leones ($25).
Finally, we explore whether farmers switched to other crops, such as cocoa. In this context, cocoa is deemed more forest-friendly by the project developers, as cocoa is produced within forests. We find an increase in cocoa harvest size (0.196 s.d., Column 4) in REDD+ communities in the later period, although this is measured with substantial noise and the change is not statistically significant.
Discussion
The market for voluntary carbon credits stemming from REDD+ projects is booming. Evidence on the deforestation and economic wellbeing impacts of these projects originating from independent, robust and causal studies is, however, surprisingly limited. We contribute to this significant knowledge gap by examining the impacts of an operational voluntary REDD+ project implemented in the buffer zone surrounding the GRNP in Sierra Leone. We find that the REDD+ programme decreased yearly deforestation rates by 30%. This shows that a relatively light-touch programme in the form of unconditional in-kind interventions can have beneficial effects on the natural environment. However, this impact is modest and the programme does not remove deforestation completely but rather helps slow down the deforestation trend. This raises questions about the sustainability of the programme, as it leaves no guarantees that the pressure on forests is removed, and communities have shifted to a new forest-friendly equilibrium. The results are in line with other recent studies that use different methods and focus on different types of carbon offset programmes10,20,22,23,29,38.
Despite the programme slowing rather than reversing deforestation trends, the avoided deforestation amounts to ~929 ha and ~340,000 tCO2 in avoided emissions per year. Available cost–benefit analyses of similar land use projects suggest that this is at the higher end compared with what has been achieved elsewhere (for example, ref. 39 calculate a cost of $0.46 per avoided tCO2 for a reforestation and afforestation project and ref. 23 report $0.84 per tCO2 for a REDD pilot project)23,39. Cost comparisons across different REDD+ type projects can, however, be misleading as calculations, methods and assumptions vary considerably. Nevertheless, we can more safely conclude that this specific REDD+ project does appear to avert carbon at a cost that is considerably lower than the average sale price per offset within the evaluation period, at ~$3 per credit8. It is worth noting that land use projects are generally cost effective compared with other carbon reduction technologies, such as carbon capture and storage (CCS) which can cost between $40 and $400 per tCO2, or other expensive yet scalable technologies such as electric vehicle batteries ($350–$640), solar panels ($140–$2,100) and offshore wind turbines ($2–$260)40. While other low-cost interventions, such as behavioural nudges like OPOWER’s home energy reports41, exist to tackle carbon reductions, they are expected to produce relatively small emission reductions compared with land use programmes.
We also assess whether this type of REDD+ project can improve economic wellbeing. Using rare panel survey data, we find no clear evidence of changes to economic wellbeing, although we do observe increases in particular income streams (that is, NTFP collection). We also examine the mechanisms through which deforestation was reduced in the buffer zone. We find no evidence of improved conservation attitudes but hypothesize that the REDD+ project affected the opportunity cost of labour, which increased the local labour price via creation of alternative income possibilities. Some of these possibilities are sales of non-timber forest products and (forest-friendly) cocoa farming, although we find no evidence of other changes in income or production. As such, our findings contribute to the discussion about the potential impact of REDD+ projects on the economic welfare of local communities.
Taken together, our results highlight that interventions such as agricultural training and savings and loans programmes can slow the rate of deforestation while not causing economic harm to local communities. The interventions are not effective in generating positive changes to participants’ economic wellbeing. To achieve higher levels of environmental protection and improve the contribution of REDD+ to human wellbeing, more intensive interventions and considerable investment may be necessary. Our research also provides insights into the behavioural mechanisms that underlie the observed ecological impacts, suggesting that promoting targeted alternative sustainable livelihoods, such as non-timber forest products and cocoa, and addressing local labour market impacts are crucial to the success of REDD+ initiatives.
Rigorous independent evaluation methods for the impacts of voluntary REDD+ projects are increasingly called for by the scientific community. Stated carbon emission reductions by carbon verification agencies have recently been scrutinized10,11. With this study, we attempt to bridge this gap by using a rigorous identification strategy set up independently from the verification process. A clear-cut comparison between our findings and those from the verification is, unfortunately, not straightforward. Our evaluation focuses on the buffer zone (the area for which we have a credible counterfactual). In contrast, the certification agency Verra bases their assessment on avoided deforestation within the National Park as well as the buffer zone. Second, Verra focuses on a different time period for the verification (2012–2014), whereas we focus on the 5-yr period after GRC commenced REDD+ activities (2014–2018). With these caveats in mind, we can attempt an approximate per hectare comparison of our avoided deforestation results with those of Verra. Verra’s estimate of avoided deforestation is 940 ha yr−1 (averaged over the entire Gola REDD+ project area). This is close to our own estimate of 929 ha yr−1 (averaged over the buffer zone area alone) (see Supplementary Information H for details).
Previous impediments to undertaking rigorous evaluation studies of REDD+ projects related to the cost of data collection, uncertainty about which evaluation methods to use, and hesitancy from funders and project developers due to the fear that any disappointing short-term evaluations could jeopardize future financing14. Our experience from completing this study suggests that these concerns are increasingly waning. Improvements in technology and capacity building have reduced the costs of such evaluations, while there have been substantial advances in our understanding of the methods used. Further, we are now beyond the piloting phase of many REDD+ projects and thus have data over longer periods. We have also witnessed a shift in the mentality of project developers who are more willing to embrace best practice evaluation methods and receive support for setting up independent rigorous assessment methodologies (as, to their credit, did the agencies involved in the REDD+ project). Given the demand pressures to significantly increase the supply of these voluntary offsets, it is even more timely to call for more studies such as this one to add to the evidence base on voluntary REDD+ projects.
Methods
The analyses in this paper relied on three main sources of data: satellite data using a publicly available dataset42, border definitions (polygons) of all protected areas in Sierra Leone and survey data collected over three rounds in communities surrounding the GRNP (implemented in 2010, 2014 and 2019). Informed consent was obtained from all respondents interviewed. Ethical oversight was provided by Wageningen University and the University of Cambridge through their respective Institutional Review Boards. For our data analysis, we used R v.4.2.2 (2022-10-31), RStudio v.2022.07.2 and self-written code.
Deforestation data
The dataset in ref. 42 provides worldwide yearly data on forest loss. We used data from the 2001–2018 period. The dataset has a high resolution with a pixel size of 30 × 30 m (see Supplementary Information D for more information). This allowed us to use detailed information and recognize small-scale deforestation events (as is likely with traditional agricultural practices). Forest was defined as an area with >50% of vegetation taller than 5 m. Forest loss was defined as a change from a forested to a non-forested area. We disaggregated forest loss to the year and village (or community) level. To assign forest loss to specific villages, we used data from ref. 43. First, simple Voronoi polygons were drawn for all villages in the seven Chiefdoms in which the GRNP lies (454 villages in total). Then, some of these polygons (228 in total) were adjusted in size on the basis of the estimated village population size obtained through a village survey in 2010. Unsurveyed villages were not weighted (our results are similar when we run the analysis for weighted polygons only; see Supplementary Table 21). The resulting predicted village polygons were verified using GPS boundary data collected for a sample of 98 of the villages (see Supplementary Fig. 3 for the polygon map and Supplementary Information D for more information on the estimation method). The data on locations and population sizes were based on a survey of 228 villages in 2010. Finally, we counted the number of pixels indicating forest loss in a village polygon in a given year and calculated the percentage forest lost by dividing the area deforested by the size of the polygon. By using the percentage, we could compare villages with different-sized land holdings.
Protected Areas definition
We placed the observed deforestation rates in the GRNP into context by examining other PAs in Sierra Leone. This analysis was based on a map provided by the Sierra Leonean Ministry of Agriculture, which we used to infer the exact borders of the PAs. We examined all existing national parks, forest reserves and game sanctuaries with a legal protection status. The deforestation data in ref. 42 were used to examine forest loss over the 2001–2018 period for each PA separately. We also examined forest loss in buffer zones, which provide important corridors for endangered species and prevent encroachment. We used a 4-km distance from the border to define this buffer zone, to be consistent with the GRNP’s buffer zone. We only considered buffer areas that fell within the national borders of Sierra Leone. Deforestation results for these national parks are shown in Supplementary Information B. We used data from the World Database on Protected Areas to extend our analysis to PAs in Guinea and Liberia.
Survey data
We used primary survey data collected in Sierra Leone during three survey waves. During March/April 2010, Wageningen and Cambridge University researchers collaborated with GRC to implement a baseline survey in villages in the seven chiefdoms surrounding the GRNP. GRC selected 200 villages that were closest to the National Park and most likely to have community forests with high biodiversity value. From this list, 11 did not exist (anymore) and the survey was subsequently implemented in 189 communities. This survey was also the source of village locations and sizes, which were used in the Voronoi polygon definition in ref. 43. In each village, 15 households were randomly sampled and interviewed regarding demographics, economic outcomes, hunting and gathering behaviour, and attitudes towards conservation. We implemented a second survey in April 2014, just before the start of REDD+ activities. From the villages included in the 2010 survey wave, we randomly selected 30 REDD+ villages, that is, those eligible for REDD+ benefits. These communities all lie within a 4-km buffer zone around the National Park. We also selected 30 non-REDD+ villages which were randomly selected from villages 4–25 km from the National Park boundary. The sampling was stratified by regional quadrants to ensure representation of villages between the GRNP boundary and the border with Liberia. One of the REDD+ villages was removed from the sample as it no longer existed, bringing our full sample down to 59 (see Supplementary Fig. 5 for a detailed map). The same households as in 2010 were interviewed. During this survey wave, 841 households in total were surveyed across the 59 villages, with an average of 14 households per village (some villages had fewer than 15 households). For the follow-up survey during April 2019, we revisited each household included in the 2014 survey. If the head of the household was not available, we selected a representative of the household. We recontacted 81% of the 2014 sample in 2019. The 2014 and 2019 survey waves were used for the main analysis, whereas the 2010 round was used to explore parallel trends (see ‘Parallel trends’). An attrition analysis for all primary outcomes shows no bias in attrition between REDD+ and non-REDD+ villages (see Supplementary Table 8).
Survey outcomes
We assessed two main survey outcomes: an index of outcomes related to economic wellbeing and an index related to conservation attitudes (a description of family outcomes and the variables they consist of can be found in Supplementary Table 3 and descriptive statistics in Supplementary Tables 5 and 6). By grouping our variables into families, we reduced the number of statistical tests necessary. We used the approach in ref. 44 to combine variables with different units into families. This worked by first normalizing all variables and then taking the raw mean of these z-scores. If an observation was missing for a certain variable, this was imputed at the own-group mean (that is, by survey round and treatment status).
The economic wellbeing family consisted of data on income, expenditures, resilience, productive loans and assets. Income is the sum of a very broad range of income categories which includes almost all sources of income, thereby increasing our precision. We asked this question over the previous year. We also looked at two forms of expenditures as a more robust estimate of income. We asked about expenditures in the previous month on a set of common consumption items. We also asked about yearly expenditures on larger, less regular items. Resilience was measured as a dummy indicating whether individuals were able to cope with an emergency in the previous year. Durable loans were the sum of loans in the previous year for productive/durable activities. Assets was the sum of a common set of assets owned, such as tables, beds and housing materials. Outcomes that are expressed in monetary terms (income, expenditures and productive loans) were transformed using the inverse hyperbolic sine function, reducing the variance of the outcome.
The conservation attitude family consisted of stated attitudes, knowledge of conservation rules, use of sustainable farming practices and perception of human–wildlife conflict. Stated attitudes were responses on a 5-point Likert scale to four questions related to the GRNP and conservation in general. Knowledge of conservation rules was assessed by asking five questions about what is allowed and not allowed in the national park (on mining, gathering, fishing, logging and hunting). Sustainable farming was the number of sustainable farming practices used, for example, on land use. Finally, we asked how big of a problem human–wildlife conflict is (on a 0–3 scale). Increased human–wildlife conflict is often associated with the creation of the national park, which might have increased animal populations.
We also explored other potential mechanisms, mainly related to changes in the local labour market. Labour is one of the main seasonal constraints for agricultural production in Sierra Leone, with over 65% of households reporting labour shortages in the agricultural season in a nationwide survey36. To assess labour shortages, we asked respondents how much of a problem it is to get labour (scale 0–3) for the three main types of farms and calculated the average value. We also assessed income from farm wages in the previous year and looked at yearly income from NTFPs. NTFPs are an important alternative form of income associated with the creation of the national park, as these are explicitly allowed to be collected and will be more plentiful if the park is well preserved. Finally, we included estimates of cocoa harvests in the previous year.
Empirical strategy
To estimate the effect of REDD+, we used a standard difference-in-difference (or BACI) model:
where Yijt refers to our set of outcomes (either deforestation rates at the community level or a household-level family indicator), REDDj is a dummy for villages within the buffer zone (that is, REDD+ eligible communities) and postt is a dummy referring to the second survey wave (2019). β3 is our coefficient of interest. i indexes the household level (only for household-level outcomes), j indexes the village level and t the survey wave. For our household-level outcomes, we clustered standard errors at the village level (εijt). Only households for whom we had panel data (for example, they were interviewed in both rounds) were included. This estimator provides us with an unbiased estimate of the treatment effect if we can assume that without the project, the communities would have trended similarly (parallel trends assumption). We explored this assumption in the next section.
Parallel trends
Our main identifying assumption is that outcomes in REDD+ communities would have trended similarly as those in non-REDD+ communities had the REDD+ project not been implemented. Even though this parallel-trends assumption is fundamentally untestable, we did several comparisons of REDD+ and non-REDD+ communities before the REDD+ intervention to show that this assumption is likely to hold.
Generally, REDD+ and non-REDD+ communities exhibited remarkably few significant differences in village-level as well as household-level indicators, of which many (such as the amount of human settlement, geographical factors, distance to markets, agricultural production) are important drivers of deforestation (see Supplementary Table 4). At the village-level, only village size was significantly smaller in REDD+ communities compared with non-REDD+ communities. At the household-level, slightly fewer household heads obtained some form of secondary education in REDD+ communities. Through a matching procedure described in ‘Robustness analysis’, we addressed these differences and find similar results.
For our deforestation outcome, we had multiple rounds of pre-REDD+ data available, that is, the years 2001–2013 in Fig. 3. Trends (and levels) were very similar before REDD+ activities, which suggests that this would have continued without REDD+. There was a break in levels coinciding with the inclusion of satellite data from Landsat 8, resulting in more accurate measures of deforestation. However, this change in levels affected both types of village (robustness of this data is further addressed in the next section). The presence of parallel trends before the start of REDD+ is also visible when we ran an event-study model in which we estimated year-specific effects of REDD+ (shown in Supplementary Fig. 4). All year-specific treatment effects before 2014 were non-significant and close to zero, except for the year 2002 when differences were still very small.
For our survey outcomes, we made use of the unique opportunity of having access to two rounds of pre-REDD+ data (the 2010 and 2014 rounds of data). We first inspected whether there were any meaningful level differences between REDD+ and non-REDD+ villages (see Supplementary Tables 5 and 6). Differences were small and, in most cases, non-significant. In 2010, yearly irregular expenditures and income from NTFPs were slightly lower in REDD+ villages. This difference dissipated by 2014, hence we doubted that access to cash (important to mobilize labour for deforestation) affected our results. Sustainable farming practices were higher in 2010 but the difference also faded by 2014. In 2014, awareness of conservation norms was somewhat higher in REDD+ communities. If this means that there is not as much scope for this awareness to increase because of REDD+, this will bias our results downward. In 2014, human–wildlife conflict was also higher in REDD+ communities. This could be caused by proximity to the National Park, which contains much of this wildlife. One way farmers could deal with this is by removing trees surrounding their farms, thereby reducing wildlife access. If this is the case, the reduction in deforestation we found is a lower bound of the real effect.
Note that these level differences are only problematic if they affect the trend of our outcomes, as level differences drop out in the difference-in-difference approach. To assess systematic differences across both data waves, we re-ran our difference-in-difference model for the 2010–2014 data on the main outcomes and mechanisms for which data were available (Supplementary Table 7). In no case was the 2014*REDD+ coefficient significant: we found no significantly different trends between the two groups.
As a robustness check, we combined our difference-in-difference model with matching techniques and found similar results on our deforestation, economic wellbeing and attitudes outcomes (see Supplementary Tables 19 and 23, and ‘Robustness analysis’ below).
A potential concern is that our result is driven by leakage from the REDD+ area to the control area. This seems unlikely as REDD+ communities have few incentives to move their activities elsewhere. Cutting trees is legal in the buffer zone of the park (that is, the REDD+ communities). Second, the REDD+ project is not conditional on deforestation outcomes in the buffer zone. Third, cutting trees is labour intensive and typically done on foot. Thus, it is not very likely that REDD+ communities moved to non-REDD+ areas for farming or other activities that require cutting trees. An additional source of leakage could be that treated communities bought more wood on the market sourced from the control areas. This is unlikely because wood demand in the area mostly stems from urban construction. Any market leakage is therefore expected to be negligible.
Robustness analysis
We ran multiple robustness checks to address potential concerns about the quality of the satellite data and the comparability of REDD+ and non-REDD+ villages (see Supplementary Information F for all robustness analyses). First, we used an alternative deforestation dataset, the Tropical Moist Forest data in ref. 45. We found a similar negative effect of REDD+ on forest loss (the effect size is −0.759 percentage points, which amounts to ~27% less forest loss yearly; see Supplementary Fig. 6 and Table 17).
To improve comparability between REDD+ and non-REDD+ villages, we used matching (both propensity score matching and coarsened exact matching) in combination with difference-and-difference for both deforestation datasets. We found consistently negative effects of REDD+ on deforestation, with coefficients varying from −0.618 vs −1.297 percentage points forest loss per year (Supplementary Table 19).
A potential concern is that the higher-precision Landsat 8 imagery from 2013 is driving our deforestation result. Forest loss measurements could, for instance, be less precise as proximity to the national park increases. We ran multiple tests to address this concern (Supplementary Table 20). First, we ran the same model but restricted our sample to all communities within 8 km of the park (thereby defining only communities in the 4–8 km zone as the control group), which hardly changed our estimates. We ran a falsification check by removing the REDD+ communities from our sample and defining the 4–8 km zone as the treatment group, comparing it to the remaining non-REDD+ communities. The deforestation result disappeared, indicating that proximity to the national park is not likely to affect forest loss measurement. We also ran our model with Landsat 8 data only, for the years 2013–2018, excluding the lower-precision years, which also hardly changed our estimates (Supplementary Table 21). Last, we ran our model excluding all villages that lie within 1 mile of the GRNP. GRC had been active in this area before the start of the REDD+ programme (details about their activities can be found in Supplementary Information C). We found that the effect is significant, albeit somewhat smaller (−0.741 vs −1.032 percentage points; see Supplementary Table 20). This could suggest that previous conservation activities had a long-term effect on deforestation in this area. Alternatively, it could mean that REDD+ is more effective in villages near the national park.
In sum, these robustness checks suggest that the REDD+ programme reduced deforestation rates by ~1 percentage points or 30% yearly.
Reporting summary
Further information on research design is available in the Nature Portfolio Reporting Summary linked to this article.
Data availability
The data used in this paper are available in a GitHub repository (repo: MandyMalan/gola-redd-impact). Raw survey data and household-level covariates dataset used for matching in our Robustness section are not published to ensure anonymity of our respondents. Data can be made available upon request. Public data used in this paper are from ref. 42 (v.1.6 available at: https://earthenginepartners.appspot.com/science-2013-global-forest/download_v1.6.html), ref. 45 (available at https://forobs.jrc.ec.europa.eu/TMF/data.php#downloads) and Worldwide Database on Protected Areas (available at https://www.protectedplanet.net/en/thematic-areas/wdpa?tab=WDPA).
Code availability
All code needed to reproduce this paper are published in a GitHub repository (repo: MandyMalan/gola-redd-impact). Code used for cleaning data is not published and can be made available upon request.
References
Angelsen, A., Brockhaus, M., Sunderlin, W. D. & Verchot, L. (eds) Analysing REDD+: Challenges and Choices. (CIFOR, 2012).
Ecosystem Marketplace. The Art of Integrity Ecosystem Marketplace’s State of the Voluntary Carbon Markets 2022 Q3 (Forest Trends, 2022).
Taskforce on Scaling Voluntary Credit Markets. Phase 1 Final Report (Institute of International Finance, 2021).
Wunder, S. et al. REDD+ in theory and practice: how lessons from local projects can inform jurisdictional approaches. Front. For. Glob. Change https://doi.org/10.3389/ffgc.2020.00011 (2020).
Wilebore, B., Voors, M., Bulte, E. H., Coomes, D. & Kontoleon, A. Unconditional transfers and tropical forest conservation: evidence from a randomized control trial in Sierra Leone. Am. J. Agr. Econ. 101, 894–918 (2019).
Wunder, S. The efficiency of payments for environmental services in tropical conservation: essays. Conserv. Biol. 21, 48–58 (2007).
Simonet, G. et al. ID-RECCO, International Database on REDD+ Projects and Programs, Linking Economic, Carbon and Communities Data. v.3.0. (2021); http://www.reddprojectsdatabase.org
Ecosystem Marketplace. State of Voluntary Carbon Markets 2021, Installment 1: Market in Motion (Forest Trends, 2021).
Sills, E. O. et al. Building the evidence base for REDD+: study design and methods for evaluating the impacts of conservation interventions on local well-being. Glob. Environ. Change 43, 148–160 (2017).
West, T. A. P., Börner, J., Sills, E. O. & Kontoleon, A. Overstated carbon emission reductions from voluntary REDD+ projects in the Brazilian Amazon. Proc. Natl Acad. Sci. USA 117, 24188–24194 (2020).
Greenfield, P. Revealed: more than 90% of rainforest carbon offsets by biggest certifier are worthless, analysis shows. The Guardian (18 January 2023). https://www.theguardian.com/environment/2023/jan/18/revealed-forest-carbon-offsets-biggest-provider-worthless-verra-aoe
Sills, E. O. et al. REDD+ on the Ground: A Case Book of Subnational Initiatives Across the Globe (CIFOR, 2014).
Duchelle, A. E., de Sassi, C., Sills, E. O. & Wunder, S. in Transforming REDD+: Lessons and New Directions (eds Angelsen, A. et al.) 131–141 (CIFOR, 2018).
Simonet, G. et al. in Transforming REDD+: Lessons and New Directions (eds Angelsen, A. et al.) 117–130 (CIFOR, 2018).
Core Carbon Principles (The Integrity Council for the Voluntary Carbon Market, 2022). https://icvcm.org/the-core-carbon-principles/
Angelsen, A. Moving Ahead with REDD: Issues, Options and Implications (CIFOR, 2008).
Herr, D., Blum, J., Himes-Cornell, A. & Sutton-Grier, A. An analysis of the potential positive and negative livelihood impacts of coastal carbon offset projects. J. Environ. Manage. 235, 463–479 (2019).
Sunderlin, W. D., de Sassi, C., Ekaputri, A. D., Light, M. & Pratama, C. D. REDD+ contribution to well-being and income is marginal: the perspective of local stakeholders. Forests 8, 125 (2017).
Angelsen, A. et al. Transforming REDD+: Lessons and New Directions (CIFOR, 2018).
Correa, J. et al. Evaluating REDD+ at subnational level: Amazon fund impacts in Alta Floresta, Brazil. Forest Policy Econ.116, 102178 (2020).
Duchelle, A. E. et al. Balancing carrots and sticks in REDD+: implications for social safeguards. Ecol. Soc. 22, 2 (2017).
Bos, A. B. et al. Comparing methods for assessing the effectiveness of subnational REDD+ initiatives. Environ. Res. Lett. 12, 074007 (2017).
Simonet, G., Subervie, J., Ezzine-De-Blas, D., Cromberg, M. & Duchelle, A. E. Effectiveness of a REDD project in reducing deforestation in the Brazilian Amazon. Am. J. Agr. Econ. 101, 211–229 (2019).
Carrilho, C. D., Demarchi, G., Duchelle, A. E., Wunder, S. & Morsello, C. Permanence of avoided deforestation in a Transamazon REDD+ project (Pará, Brazil). Ecol. Econ. 201, 107568 (2022).
Cisneros, E., Börner, J., Pagiola, S. & Wunder, S. Impacts of conservation incentives in protected areas: the case of Bolsa Floresta, Brazil. J. Environ. Econ. Manage. 111, 102572 (2022).
Ellis, E. A., Sierra-Huelsz, J. A., Ceballos, G. C. O., Binnqüist, C. L. & Cerdán, C. R. Mixed effectiveness of REDD+ subnational initiatives after 10 years of interventions on the Yucatan Peninsula, Mexico. Forests 11, 1005 (2020).
West, T. A. P. et al. Action needed to make carbon offsets from forest conservation work for climate change mitigation. Science 381, 873–877 (2023).
Delacote, P., Le Velly, G. & Simonet, G. Revisiting the location bias and additionality of REDD+ projects: the role of project proponents status and certification. Resour. Energy Econ. 67, 101277 (2022).
Guizar-Coutiño, A., Jones, J. P. G., Balmford, A., Carmenta, R. & Coomes, D. A. A global evaluation of the effectiveness of voluntary REDD+ projects at reducing deforestation and degradation in the moist tropics. Conserv. Biol. 36, e13970 (2022).
Jagger, P. & Rana, P. Using publicly available social and spatial data to evaluate progress on REDD+ social safeguards in Indonesia. Environ. Sci. Policy 76, 59–69 (2017).
Gola Redd Project (VERRA, 2022); https://registry.verra.org/app/projectDetail/VCS/1201
Wiik, E. et al. Experimental evaluation of the impact of a payment for environmental services program on deforestation. Conserv. Sci. Pract. 1, e8 (2019).
Parker, T., Fraser, H. & Nakagawa, S. Making conservation science more reliable with preregistration and registered reports. Conserv. Biol. 33, 747–750 (2019).
Ferraro, P. J. in Environmental Program and Policy Evaluation: Addressing Methodological Challenges. New Directions for Evaluation (eds Birnbaum, M. & Mickwitz, P.) 75–84 (Wiley, 2009).
Curtis, P. G., Slay, C. M., Harris, N. L., Tyukavina, A. & Hansen, M. C. Classifying drivers of global forest loss. Science 361, 1108–1111 (2018).
Agricultural Household Tracking Survey, Sierra Leone, (Harvard Dataverse, 2012); https://doi.org/10.7910/DVN/O4NUUG
Mokuwa, E., Voors, M., Bulte, E. & Richards, P. Peasant grievance and insurgency in Sierra Leone: judicial serfdom as a driver of conflict. Afr. Aff. 110, 339–366 (2011).
Ellis, E. A. et al. Reduced-impact logging practices reduce forest disturbance and carbon emissions in community managed forests on the Yucatán Peninsula, Mexico. For. Ecol. Manage. 437, 396–410 (2019).
Jayachandran, S. et al. Cash for carbon: a randomized trial of payments for ecosystem services to reduce deforestation. Science 357, 267–273 (2017).
Gillingham, K. & Stock, J. H. The cost of reducing greenhouse gas emissions. J. Econ. Perspect. 32, 53–72 (2018).
Allcott, H. & Mullainathan, S. Behavior and energy policy. Science 327, 1204–1205 (2010).
Hansen, M. C. et al. High-resolution global maps of 21st-century forest cover change. Science 342, 850–853 (2013).
Wilebore, B. & Coomes, D. Combining spatial data with survey data improves predictions of boundaries between settlements. Appl. Geogr. 77, 1–7 (2016).
Kling, J. R., Liebman, J. B. & Katz, L. F. Experimental analysis of neighborhood effects. Econometrica 75, 83–119 (2007).
Vancutsem, C. et al. Long-term (1990–2019) monitoring of forest cover changes in the humid tropics. Sci. Adv. 7, eabe1603 (2021).
Acknowledgements
We thank the Royal Society for the Protection of Birds (RSPB) and the Gola Rainforest Conservation LG (not for profit company), BirdLife International, E. Mokuwa, P. Richards and M. Ross for their collaboration in this project. We thank GCRF QR at the University of Cambridge and NWO for financial support (grant VI.Vidi.191.154 received by M.V.). We acknowledge the loyalty and hard work of the team of field enumerators and the patience and cooperation of interviewees.
Author information
Authors and Affiliations
Contributions
All authors conceptualized the project; M.M. and P.H. curated the data; M.M., P.H. and T.S. undertook formal analyses; M.V. and A.K. acquired funding; M.M., P.H., M.V., T.S. and E.G. performed the investigations; all authors designed the methodology; M.V. administered the project; M.M., A.K., P.H. and M.V. supervised the work; all authors validated the findings; M.M. and P.H. visualized the data; M.M., P.H. and M.V. wrote the first draft, and all authors contributed to the review and editing of the paper.
Corresponding author
Ethics declarations
Competing interests
The authors declare no competing interests. The authors did not receive financial or non-financial benefits from the donors, or any other partners related to any of the interventions presented here. The Cambridge Centre for Carbon Credits (4C) has no commercial interest in carbon credits. T.S. worked as a conservation scientist for the Royal Society for the Protection of Birds (RSPB) until 2020. The RSPB maintains close ties with the Gola Rainforest REDD+ programme. T.S. had no direct involvement in the design and implementation of the REDD+ programme. We pre-registered this study with the EGAP-OSF registry after data collection, but before data processing and analysis (OSF ID: 8n7h6).
Peer review
Peer review information
Nature Sustainability thanks Stibniati Atmadja, Robert Heilmayr and the other, anonymous, reviewer(s) for their contribution to the peer review of this work.
Additional information
Publisher’s note Springer Nature remains neutral with regard to jurisdictional claims in published maps and institutional affiliations.
Supplementary information
Supplementary information
Supplementary Information A–H with Tables 1–24 and Figs. 1–7.
Rights and permissions
Open Access This article is licensed under a Creative Commons Attribution 4.0 International License, which permits use, sharing, adaptation, distribution and reproduction in any medium or format, as long as you give appropriate credit to the original author(s) and the source, provide a link to the Creative Commons license, and indicate if changes were made. The images or other third party material in this article are included in the article’s Creative Commons license, unless indicated otherwise in a credit line to the material. If material is not included in the article’s Creative Commons license and your intended use is not permitted by statutory regulation or exceeds the permitted use, you will need to obtain permission directly from the copyright holder. To view a copy of this license, visit http://creativecommons.org/licenses/by/4.0/.
About this article

Cite this article
Malan, M., Carmenta, R., Gsottbauer, E. et al. Evaluating the impacts of a large-scale voluntary REDD+ project in Sierra Leone. Nat Sustain 7, 120–129 (2024). https://doi.org/10.1038/s41893-023-01256-9
Received:
Accepted:
Published:
Issue Date:
DOI: https://doi.org/10.1038/s41893-023-01256-9
