
Abstract
Bacterial vaginosis (BV) is a genital infection that frequently presents in women infected with human papillomavirus (HPV), but the correlation between BV, HPV and cervical intraepithelial neoplasia (CIN) development is still elusive. We organized a cross-sectional analysis which enrolled 624 participants and obtained 423 samples of vaginal secretions from them, including 193 HPV-negative samples and 230 HR-HPV-positive samples. We used 16S rRNA sequencing to measure the vaginal microbiota diversity in women with different BV, HPV and CIN status, and then calculated risk factors for CIN by logistic regression. We found that the diversity of vaginal microbiota was significantly increased after BV, HPV and BV-infected CIN group. The Observed species and Chao1 index of H.C group showed little difference with normal group, while its Shannon index was considerable higher than normal group. L. iners enriched in HPV infection group compared with others significantly. BV (OR = 0.358; 95% CI = 0.195–0.656; P < .05) and HR-HPV infection (OR = 0.016; 95% CI = 0.004–0.072; P < .001) were risk factors for CIN. In conclusion, we consider BV as a risk factor for CIN. The enrichment of L. iners under HPV infection state may contribute to maintenance of vaginal dysbiosis, and BV infection could facilitate the disturb.
Introduction
Cervical cancer affects millions of women worldwide, with an estimated incidence of 604,200 new cases and 310,000 deaths in 2020, with China having 109,700 (18.2%) new cases and 59,700 (17.6%) deaths1. The prevalence of cervical cancer in China remains higher than in the Western World due to lower vaccine coverage among young women and less awareness of regular cervical cancer screening in adult. Persistent human papillomavirus (HPV) infection causes cervical intraepithelial neoplasia (CIN) that may develop into cervical cancer if not detected in its early stages during screening or treated well once detected. According to a systematic review by Yin et al.2 the rate of high-risk HPV (HR-HPV) infection caused by types 16, 52, 58, 53, and 18 is up to 19.0% in mainland Chinese women. Infection with HR-HPV is an independent risk factor for CIN and cervical cancer. HPV infection is the most common sexually transmitted infection (STI) especially in women with multiple sex partners3. Other factors like smoking, contraception and antibiotic use can disrupt the clearance of HPV leading to a high viral load that can trigger cervical lesions formation4.
Bacterial vaginosis (BV) occurs in the reproductive age group with 15–50% of women presenting with vaginal discharge, peculiar smell, itching, or increased vaginal pH levels3. There is no standard definition of BV, but it is widely recognized that its development is a process characterized by the dysregulation of vaginal microbiota with increased levels of Gardnerella vaginalis (G. vaginalis), Atopobium, Prevotella, Sneathia, Peptostreptococcus, Megasphera, BV-associated bacterium 1 (BVAB1) to BVAB3, and decreased levels of Lactobacilli spp.5,6. The classification of community state types (CSTs) summarizes five types of vaginal microbiota in healthy women based on different domination of bacterium. CST I, II, III, V are dominated by Lactobacillus crispatus (L. crispatus), L. gasseri, L. iners, and L. jensenii, respectively; whereas CST IV is defined as the depletion of Lactobacilli spp.7,8,9. Women with CST IV vaginal communities are more likely to experience BV, abortion, preterm labor, increased susceptibility to human immunodeficiency virus (HIV) and HPV infection, or delayed HPV infection clearance5,10. The percentage of women with CST IV cluster is significantly higher in Black and Hispanic women who also have a higher incidence of cervical cancer than that in Asian and White women11.
The association between BV and CIN was described 30 years ago, but the mechanism remains elusive. Some research revealed that BV is an independent risk factor for persistent HPV infection12,13,14,15. Greater microbiota species diversity is observed in women infected with HPV. The abundances of bacteria associated with BV like Sneathia, Prevotella, and Megashaera are significantly higher in women who are positive for HPV6. Previous research focused on clarifying the association between the cervical cytological lesion and BV due to inadequate technological development16,17,18. With the popularity of colposcopy, recent studies have relied mainly on biopsy under colposcopy, which is more accurate than a thin prep cytology test (TCT), to determine the stage of cervical lesions.
This study is focused on documenting the association of BV, CIN, and HR-HPV infection. We used 16S rRNA gene sequencing to display the vaginal microbiota in Chinese women and compared the composition of microbiota between women with different BV, HPV, or CIN statuses. We aimed to find a promising marker for vaginal dysbiosis.
Results
Population characteristics
Samples were collected from November 2020 to April 17, 2021, from a total of 624 enrolled participants. 201 participants were excluded because of vulvovaginal candidiasis (VVC), trichomonas vaginitis (TV), other STIs infection (complete exclusion criteria seen in “Methods” Section), or unqualified DNA concentration of secretions. A total of 423 samples were finally included in this experiment (Table 1). Detailed information was available in the Supplementary Table S1 online.
According to the recommendations of the American Cancer Society (ACS), women with a cervix should undergo routine cervical cancer screening at least every five years starting at age 25 years until 65 years. We selected women between the age of 25 and 65 years as our participants, and divided them into 3 groups (25–39, 40–54, ≥ 55 years). There was no significant correlation between HPV infection and times of gestation or parturition, but there were significant correlations between age, contraception, and number of sexual partners. Of the 423 samples obtained, 160 out of 423 (37.83%) of the women had BV infections. The HPV-negative group had significantly lower rates of BV infection than the HPV-positive group (P < 0.001). A total of 230 out of the 423 samples (54.37%) suffered HR-HPV and 86 out of the 230 samples (37.39%) had more than one type of HPV infection. Women with HR-HPV who progressed to CIN were 94 out of 230 (40.87%).
Next, we conducted logistic regression analysis on possible risk factors for CIN including age, times of gestation and parturition, methods of contraception, number of sexual partners, BV, HPV infection, and multitype HPV infection, which were collected in the questionnaire. As shown in Fig. 1, we found that condom use (OR = 3.480; 95% CI = 1.069–11.325; P < 0.05) was a protective factor for CIN, whereas BV (OR = 0.358; 95% CI = 0.195–0.656; P < 0.05) and HR-HPV infection (OR = 0.016; 95% CI = 0.004–0.072; P < 0.001) were risk factors for CIN.
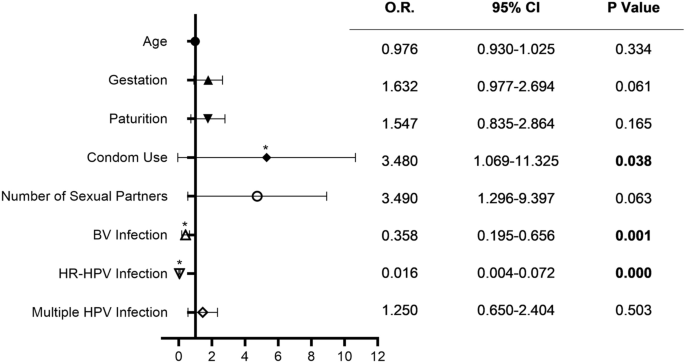
Odds ratio of possible risk factors for CIN Using Logistic regression. Bars represented 95% confidence intervals. O.R.: odds ratio, CI: confidence interval. * P < .05.
The difference in composition of vaginal microbiota in the HPV-negative and HPV-positive groups
To identify the difference in composition of vaginal microbiota between women with and without HPV infection, we sequenced the V3-V4 hypervariable region of the 16S rDNA gene utilizing 16S rRNA sequencing. We acquired 15,137 OTUs in our experiment, the sequence result was available in Supplementary Database 1 and the taxonomy profile was in Supplementary Table S2 online.
In the HPV-negative group, 8 out of 193 samples and 1 out of 230 samples in the HPV-positive group were excluded because of low DNA copy numbers. The relative abundance of the top 19 prevalent vaginal microbiota in HPV-negative and HPV-positive women samples with Lactobacillus spp. predominant in both groups are displayed in Fig. 2a, b. As shown in Fig. 2c, the abundance of Lactobacillus spp. in the HPV-negative group was much higher than that in the HPV-positive group. Meanwhile, microbiota composition in the HPV-positive group was more complicated. Bacteria such as Gardnerella vaginalis, Ralstonia pickettii, Streptococcus anginosus, Prevotella bivia, Prevotella timonensis, Bifidobacterium dentium, and Sneathia sanguinegens presented more frequently in the HPV-positive group. We analyzed the OTUs numbers in each group and displayed them in a Venn graph in Fig. 2d. The unique OTUs in the HPV-positive group were significantly higher than in the HPV-negative group. These data suggest that HPV infection could lead to an increase in vaginal microbiota complexity.

Vaginal microbiota composition in HPV-negative (HPV−) and HPV- positive (HPV +) group samples. (a). Relative abundance of the top 19 vaginal microbiota at the species level in HPV-negative group women. (b). Relative abundance of the top 19 vaginal microbiota at species level in HPV-positive group women. (c). Relative abundance bar chart for HPV-negative and HPV-positive groups at the species level. (d). Venn graph for HPV-negative and HPV-positive groups. Each circle represents a group, and the number of circles and overlapping parts represents the number of OTUs shared between the groups and the number of non-overlapping parts represents the number of unique OTUs of the group. P: HPV-positive; N: HPV-negative.
The relative abundance of vaginal microbiota of different BV, HPV and CIN statuses
To further estimate the vaginal microbiota changes under different clinical condition, we divided all the samples into 6 groups according to the following BV, HPV or CIN statuses: Normal, BV (BV infection), HPV (HR-HPV infection), B.H (BV and HR-HPV co-infection), H.C (HR-HPV infection combined with CIN), and B.H.C (BV and HR-HPV co-infection combined with CIN). To better distinguish the differences between groups, we conducted random screening of the grouped data to balance the sample size of each group. A total of 342 samples were collected and the numbers of final samples of each group were 65, 52, 71, 60, 48, and 46, respectively (Supplementary Tables S3–S8 for detailed information). In Fig. 3a, we displayed the top 19 vaginal microbiota at the species level. Lactobacillus spp. had the highest percentage relative abundance of up to 82.6% in the normal group. Women with HPV infection only showed little change in the Lactobacillus spp. genera in their vaginal microbiota, but the percentage of L.crispatus, which presented most in a healthy vaginal environment was partly replaced by L.iners. Lactobacillus spp. lost its dominance (with less than 60% in composition) in the remaining three groups of women, who were all diagnosed with BV infection with a more complex bacterial composition.

Relative abundance of vaginal microbiota of different BV, HPV, and CIN statuses. (a). Relative abundance of vaginal microbiota in 6 groups. (b). CST distribution of 6 groups. BV: BV infected; HPV: HPV infected without CIN; B.H: infected with BV and HPV; H.C: HPV infected with CIN; B.H.C: infected with BV, HPV, and CIN.
We defined the community state types (CSTs) according to the dominant (> 60% of relative abundance in one sample) Lactobacillus species type. CST I, II, III, V were dominated by L. crispatus, L. gasseri, L. iners, and L. jensenii, respectively, whereas CST IV was defined as the depletion of Lactobacillus spp.19. In Fig. 3b, the CST II cluster was only shown in the normal group and CST V in the BV group. The transformation of CST I to CST III was most apparent in the HPV-positive group, which indicated that L.iners may be a key species during HPV infection. Women diagnosed with BV infection were more likely to be defined as being in the CST IV cluster. Interestingly, the percentages of CST IV cluster among BV and HPV co-infected women with CIN were significantly lower than those in the B.H group, and CST III cluster percentage was increased, which also indicates the importance of L.iners.
Higher microbial diversity in women with BV and HPV co-infection
The observed species count the number of visually observed species, Shannon’s diversity index and Chao1 index reflex the richness and evenness of species, respectively. These 3 indexes were used to measure the alpha diversity of microbiomes in 6 groups. High variability was observed among the samples; thus outliers were not shown in the boxplot (Fig. 4a–c). Three indexes of microbial diversity in the BV, HPV, B.H, and B.H.C groups were all significantly higher than those in the normal group, which indicated that either BV or HPV infection could disturb the balance of vaginal flora (P < 0.001). Besides, the observed species and the Chao1 index of the H.C group were lower than those of the BV, HPV B.H, and B.H.C groups (P < 0.001). The Shannon indexes for the HPV and H.C groups were significantly lower than that of the B.H.C group (P < 0.001). Interestingly, the Observed species and Chao1 index of H.C group showed little difference with normal group, while its Shannon index was higher than normal group. In other words, for women with CIN, the total amount of vaginal microbiome changed slightly, but the complexity substantial rising, and when co-infection occurred, the richness and evenness of bacteria increased significantly (P < 0.001).

Microbial diversity in 6 groups. (a). Observed species indexes of samples in 6 groups. (b). Shannon index. (c). Chao1 index. (d) PCoA based on the Bray–Curtis dissimilarity in CST clusters. Each dot represented a sample of the corresponding group dyed with the same color. I, III, IV represented CST I, III, IV, and others represented samples in CST II and V clusters. BV: BV infected; HPV: HPV infected without CIN; B.H: infected with BV and HPV; H.C: HPV infected with CIN; B.H.C: infected with BV, HPV, and CIN. The P values in a-c were all calculated by the Wilcoxon rank-sum test, alpha value = 0.05. * Significantly different compared with the Normal group. P < .001. ^ Significantly different compared with the H.C group. P < .001. # Significantly different compared with the B.H.C group. P < .001.
The beta diversity was measured with the PCoA based on the Bray–Curtis dissimilarity. In Fig. 4d, all the samples were mainly separated into three groups related to CST clusters (P < 0.001). P values were calculated by the ANOSIM test. Biodiversity was not dependent on BV, HPV, or CIN status (Supplementary Fig. S1 online).
Important phylotype in BV and HPV infection
To find out which bacteria are responsible for the community differences between 6 groups, we used LEfSe (Linear Discriminant Analysis Effect Size) to analyze the bacterial diversity and find biomarkers. It combines statistical difference analysis and the impact score of the species on the grouping results while emphasizing statistical significance and biological relevance. Figure 5a, b mainly showed the species with significant differences in linear discriminant analysis (LDA) score greater than 4.0, which is the biomarker with a statistical difference by Kruskal–Wallis rank sum test (Alpha value = 0.05). Like a previous study, we found a significant enrichment of Lactobacillus genera in the normal group compared with the group with BV or HPV-infected women20. L.iners presented most in HPV infected women and anaerobic bacteria Prevotellaceae family were enrichment when women infected with BV. No considerable biomarker for CIN was found.

Metagenomic biomarker between 6 groups using LEfSe analysis. (a). Enrichment in bacterial taxa between 6 groups. The threshold for the LDA score was 4.0. Groups with no statistically significant species were not shown in the figure. (b). Cladogram for different bacteria between groups. Non-significant biomarkers are shown in yellow, and significantly different biomarkers are dyed the same color as the corresponding group. Alpha value for the Kruskal–Wallis rank sum test was 0.05.
Gene functional pathways of bacterial taxa associated with BV and HPV infection
To better understand the bacterial function on HPV infection among BV infected women, we also explored the microbiota function using PICRUSt (Phylogenetic Investigation of Communities by Reconstruction of Unobserved States)21. Gene we detected were matched with the KEGG (Kyoto Encyclopedia of Genes and Genomes) database, predicted raw data was available in Supplementary Database 2. The KEGG pathway we tested was presented in Supplementary Fig. S222,23,24. 31 kinds of pathways changed in B.H compared with BV (P < 0.05). Pathways related to transporters, transcriptional factors, phosphotransferase system (PTS), carbohydrate metabolism (glycolysis/gluconeogenesis, galactose metabolism, fructose and mannose metabolism), pentose phosphate pathway, replication, recombination and repair proteins, glycerophospholipid metabolism, lysine biosynthesis, lipid metabolism, , taurine and hypotaurine metabolism, RNA transport, dioxin degradation, Staphylococcus aureus infection and sphingolipid metabolism were enriched in the BV and HPV co-infected women, whereas oxidative phosphorylation, carbon fixation pathways in prokaryotes, protein folding and associated processing, pantothenate and CoA biosynthesis, protein biosynthesis (valine, leucine, isoleucine, phenylalanine, tyrosine and tryptophan), selenocompound metabolism, folate biosynthesis, porphyrin and chlorophyll metabolism, histidine metabolism, sulfur metabolism, peroxisome, PPAR signaling pathway and C5-Branched dibasic acid metabolism were depleted after HPV infection (Fig. 6).

Predicted bacterial function pathways differences between BV and BV + HPV co-infected women. PICRUSt algorithm was used to predict bacterial gene functions from the KEGG annotated databases22,23,24. The bar chart on the left represents the percentage of the abundance of a certain metabolic pathway from all metabolic pathways in the two groups of samples. Corrected P values are on the right side. T-test (two-tailed) was used to calculate the P-value. P value less than 0.05 was considered statistically significant.
Discussion
Studies on the association of vaginal microbiota, HPV infection, and CIN have been a hotspot since gene sequencing technology was developed. Vaginal microbiota changes such as depletion of Lactobacillus spp. and increased microbiota diversity are a well-accepted finding in women infected with HPV25. We found that the vaginal microbiota in women with BV or HPV infection was more complex and had a reduction of Lactobacillus spp. (Fig. 2). This is in line with the current research trends in China and abroad5,7,9,10. Condom use (OR = 3.480; 95% CI = 1.069–11.325; P < 0.05) was a protective factor, whereas BV (OR = 0.358; 95% CI = 0.195–0.656; P < 0.05) and HR-HPV infection (OR = 0.016; 95% CI = 0.004–0.072; P < 0.001) were risk factors for CIN in our survey (Fig. 1) and other research studies too4,26,27,28. The prevalence of smoking and hormonal contraceptive use in Chinese women is lower than in western countries, so we could not make any correlation between them and CIN in our cohort.
This study was a cross-sectional analysis based on a large sample size of Chinese women focused on the association of vaginal microbiota disturbance and HPV infection. A surprising finding in our survey was the CST cluster distribution. CST II and V rarely appeared in our cohort especially after HPV infection regardless of BV condition (Fig. 3b), which was not consistent with foreign studies done in White, Hispanic, and Black women11,29,30. This may be because of the ethnic and geographic diversity31. The distribution of CST IV cluster in women with CIN was slightly lower than expected probably due to women with severe BV or VVC in whom a colposcopy was not done to prevent the spread of infection32,33. Drugs used to treat the vaginitis may have inhibited the colonization of many bacteria, thus the relative abundance of BV associated bacteria and microbiota diversity in the H.C or B.H.C group (Figs. 3a and 4) was slightly lower than in the BV group. The actual relative abundance and diversity could be higher than the available data, but we still could conclude that BV-free women (H.C group) have significantly lower vaginal microbiota diversity than the B.H.C group (Fig. 4b). Cervical lesion may cause a considerable change in the complexity of microbiota (Fig. 4b), and inhibit the growth of bacteria taxa (Fig. 4c), so that the Shannon and Chao1 index in H.C group is opposite.
Additionally, women infected with HPV have a higher proportion of L.iners than healthy women, which led us to focus on the characteristics of this special Lactobacillus spp. Similar to the previous studies, we found that L. iners was not only present in the vaginal ecosystem of healthy women, but also of those in a transitional stage or BV state19,34,35. Comparative analysis LEfSe between 6 groups also presented the significant enrichment of L.iners in HPV group (Fig. 5). One of the possible reasons for the considerable increasing of L.iners in HPV group and decreasing in H.C and B.H.C group (Fig. 3a) is that the different morphology and Gram-staining properties of L.iners with other Lactobacillus spp. shown by genome analyses36,37,38,39. Non-H2O2 or lactic acid producing Lactobacillus species L.iners could inhibit other Lactobacillus species growth, facilitate the multiply of anaerobic bacteria and maintain vaginal dysbiosis35. Furthermore, in 2011, Macklaim et al.40 used whole-genome sequencing to define the smallest species of L. iners, L. iners AB-1, which is present in both healthy women and those treated with antimicrobials. One of the reasons for its persistence in the vaginal epithelia despite the development of BV and treatment with antibiotics is the presence of fibronectin (Fn)-binding adhesins41. The percentage of samples dominated with L. iners was higher in the B.H.C group than in the B.H group (Fig. 3b), which makes us question whether L. iners AB-1 was present in our sample. Further research is necessary to detect L. iners AB-1 in abnormal vaginal microbiota flora.
Our study was a cross-sectional analysis conducted in one hospital, which may have limited the observation of the dynamic changes of vaginal microbiota after HPV infection and CIN progression. Plenty of factors could have an impact on the long-lasting process from HPV infection to CIN. Without longitudinal observation, it is hard to conclude the causal relationship between vaginal microbiota and CIN progression. In addition, we chose two specialists to diagnose BV to minimize the misdiagnosis rate, but it is hard to avoid missing the diagnosis of asymptomatic or molecular BV and reporting bias. We only performed 16S rRNA gene sequencing in our study, which failed to distinguish L. iners AB-1 from L. iners in samples. Therefore, further study is needed to better understand vaginal microbiota changes in HPV persistence and CIN progression.
The strengths of this study include the large sample size, which was enough to organize the samples into 6 groups. We also did functional prediction of bacteria, which provides a reference for further mechanism research. We found that BV and HPV co-infected women did not have a higher diversity of vaginal microbiota unless CIN occurred. For future studies, short-, medium- and long-term follow-ups are needed to observe dynamic changes of the vaginal microbiota and the disease process in women with BV or HPV infection. Further investigation is also needed to understand the characteristics of L. iners in both healthy and unhealthy states.
In conclusion, BV was considered as a risk factor for CIN. Cervical lesion may cause a considerable change in the complexity of microbiota, and inhibit the growth of bacteria taxa. BV and HPV infection could trigger an increase in vaginal microbiota diversity, especially BV, which could decrease Lactobacillus spp. domination. HPV infection could significantly increase the abundance of L. iners, which may contribute to maintain vaginal dysbiosis, and BV infection could facilitate the disturb.
Methods
Participant enrollment
This study was approved by the Ethics Committee of the Aviation General Hospital, Beijing, China (Ethical approval No. 2021-KY-01-02). Written informed consent was obtained from all participants and all methods were performed in accordance with the guidelines and regulations. Women attending the Aviation General hospital, located in Beijing, China were recruited in our study. The close-ended questionnaire was drafted by two of the authors and conducted face-to-face. Prior to actual distribution, a pilot was conducted with 20 participants, and the results of pilot questionnaire were not included in subsequent analysis. The inclusion criteria included: (a.) age range from 25 to 65 years; (b.) untreated BV; (c.) voluntary signing of informed consent form and questionnaire; (d.) had sexual experience. The exclusion criteria included: (a.) current pregnancy; (b.) undergoing menstrual period; (c.) vaccinated against HPV; (d.) sexual activity, vaginal irrigation or drug application performed 48 h before sampling; (e.) diagnosed with vulvovaginal candidiasis (VVC), trichomonas vaginitis, or other STIs like Neisseria gonorrhoeae, Chlamydia trachomatis, human immunodeficiency virus (HIV), hepatitis B virus (HBV) or Treponema pallidum; (f.) accompanied by hypertension, diabetes, immune system disease or other diseases; and (g.) antibiotics use in the past 30 days.
Sample collection
Participants were put in the lithotomy position on the gynecological examination bed after signing the informed consent form and finishing the questionnaire. A well-trained clinical doctor swabbed the vagina using two disposable sterile swabs to collect cervical and vaginal secretions that were then stored in 2 ml saline and 2 ml phosphate buffer saline (PBS, HyClone, USA) tubes, respectively. Samples were kept on ice and transferred to the laboratory for subsequent testing.
BV, HPV, and CIN diagnosis
An experienced doctor made a diagnosis of BV if a patient met three out of the following four Amsel’s criteria: (a.) increased, thin, and homogeneous vaginal discharge; (b.) vaginal pH greater than 4.5; (c.) presence of clue cells; and (d.) amine odor when potassium hydroxide (KOH) was added to the vaginal secretions. The Hybrid Capture 2 assay (HC2) was used to detect seventeen HR-HPV types (16, 18, 31, 33, 35, 39, 45, 51, 52, 53, 56, 58, 59, 66, 68, 73, 82) and six low-risk types (6, 11, 42, 43, 44, 81). Women who were positive for HR-HPV also accepted TCT to define the cytological lesion. If the results were atypical squamous cells of undetermined significance (ASC-US) or more severe lesions such as low-grade squamous intraepithelial lesions (LSIL) or high-grade squamous intraepithelial lesions (HSIL), they were recommended for colposcopy to define the grade of CIN.
DNA extraction
FastDNA Spin Kit (MP Biomedicals, USA) was used for DNA isolation from vaginal secretions. We added 200 μl of the samples suspended in saline and 1 ml cell lysis solution (CLS-TC) to Lysing Matrix A (FastPrep) and then followed the protocol. DNA concentration and purity was monitored on 1% agarose gel. According to the concentration, DNA was diluted to 1 ug/ μl using sterile water.
16S rRNA gene sequencing
V3-V4 hypervariable fragments of the 16S rRNA gene were amplified using primers 338F (338F: 5’- ACTCCTACGGGAGGCAGCA -3’) and 806R (806R: 5’- GGACTACHVGGGTWTCTAAT -3’) by PCR with the barcode. Mixture PCR products was purified with Qiagen Gel Extraction Kit (Qiagen, Germany). TruSeq DNA PCR-Free sample preparation kits (Illumina, USA) were used for library construction. The library quality was assessed on the Qubit@2.0 Fluorometer (Thermo Scientific) and Agilent Bioanalyzer 2100 system. At last, the library was sequenced on an Illumina NovaSeq platform (Illumina, CA, USA) and 250 bp paired-end reads were generated.
Sequence analysis
Paired-end reads was assigned to samples based on their unique barcode and truncated by cutting off the barcode and primer sequence. Paired-end reads were merged using FLASH (V1.2.7, http://ccb.jhu.edu/sofeware/FLASH)42. Quality filtering on the raw tags were performed under specific filtering conditions to obtain the high-quality clean tag according to the QIIME (V1.9.1, http://qiime.org/scripts/split libraries fastq.html) quality controlled process43,44. The tags were compared with the reference database (Silva database, https://www.arb-silva.de/) using UCHIME algorithm (UCHIME Algorithm, http://www.drive5.com/usearch/manual/uchime_algo.html) to detect chimera sequences, and then the chimera sequences were removed45,46. Then the Effective Tags finally obtained. Sequences analyses were performed by Uparse software (Uparse V7.0.1001, http://drive5.com/uparse/)47. Sequences with ≥ 97% similarity were assigned to the same OTUs. For each representative sequence, the Silva Database (http://www.arb-silva.de/) was used based on Mothur algorithm to annotate taxonomic information48. To study phylogenetic relationship of different OTUs and the difference of the dominant species in different samples, multiple sequence alignment were conducted using the MUSCLE software (Version 3.8.31, http://www.drive5.com/muscle/)49.
Alpha diversity indices Observed-species, Chao1 and Shannon were calculated with QIIME (V1.7.0) and displayed with R software (V3.6.3). Beta diversity was calculated by QIIME software (V1.9.1). Principal Coordinate Analysis (PCoA) analysis was displayed by WGCNA package, stat packages and ggplot2 package in R software. Linear Discriminant Analysis Effect Size (LEfSe) analysis and Phylogenetic Investigation of Communities by Reconstruction of Unobserved States (PICRUSt) were performed using the Novomagic, a free online platform for data analysis (https://magic.novogene.com), and the images were drawn by R22,23,24,50.
Statistical analysis
All statistical analyses were calculated using SPSS version 23 (IBM, New York, NY) and R software (V3.6.3). The categorical variables collected in the questionnaire were displayed by frequencies and proportions. Statistical analyses were performed with Pearson’s Chi-squared \({( \chi }^{2})\) test. Logistic regression was used to calculate the value of odds ratio (OR) and assess the risk factors of CIN. P value less than 0.05 was considered statistically significant. The continuous variables in Observed species, Shannon and Chao1 index were not normally distributed. Thus, Wilcoxon rank-sum test was used to analyze the significant difference between groups (Alpha value = 0.05). P values of PCoA based on the Bray–Curtis dissimilarity were calculated by the ANOSIM test. LEfSe analysis was used to discover the metagenomic biomarker. Kruskal–Wallis rank-sum test and pairwise Wilcoxon test was calculate by LEfSe software (version 1.0). Alpha value less than 0.05 was considered statistically significant50. In PICRUSt part, two-tailed T-test was used to calculate the P-value. P value less than 0.05 was considered statistically significant.
Data availability
All data generated or analyzed in this study are included in this published article and the Supplementary Information.
References
Stelzle, D. et al. Estimates of the global burden of cervical cancer associated with HIV. Lancet Glob. Health 9(2), e161–e169. https://doi.org/10.1016/S2214-109X(20)30459-9 (2021) (Epub 2020 Nov 16. Erratum in: Lancet Glob Health. PMID: 33212031; PMCID: PMC7815633).
Li, K., Li, Q., Song, L., Wang, D. & Yin, R. The distribution and prevalence of human papillomavirus in women in mainland China. Cancer 125(7), 1030–1037. https://doi.org/10.1002/cncr.32003 (2019) (Epub 2019 Feb 12 PMID: 30748006).
Coudray, M. S. & Madhivanan, P. Bacterial vaginosis-A brief synopsis of the literature. Eur. J. Obstet. Gynecol. Reprod. Biol. 245, 143–148. https://doi.org/10.1016/j.ejogrb.2019.12.035 (2020) (Epub 2019 Dec 24. PMID: 31901667; PMCID: PMC6989391).
Snijders, P. J., van den Brule, A. J. & Meijer, C. J. The clinical relevance of human papillomavirus testing: relationship between analytical and clinical sensitivity. J. Pathol. 201(1), 1–6 (2003).
Onderdonk, A. B., Delaney, M. L. & Fichorova, R. N. The human microbiome during bacterial vaginosis. Clin. Microbiol. Rev. 29(2), 223–238. https://doi.org/10.1128/CMR.00075-15 (2016) (PMID:26864580; PMCID:PMC4786887).
Cheng, L. et al. Vaginal microbiota and human papillomavirus infection among young Swedish women. NPJ Biofilms Microbiomes 6(1), 39. https://doi.org/10.1038/s41522-020-00146-8 (2020) (PMID:33046723;PMCID:PMC7552401).
Di Paola, M. et al. Characterization of cervico-vaginal microbiota in women developing persistent high-risk Human Papillomavirus infection. Sci Rep. 7(1), 10200. https://doi.org/10.1038/s41598-017-09842-6.PMID:28860468;PMCID:PMC5579045 (2017).
Brotman, R. M. et al. Interplay between the temporal dynamics of the vaginal microbiota and human papillomavirus detection. J. Infect. Dis. 210(11), 1723–1733. https://doi.org/10.1093/infdis/jiu330 (2014) (Epub 2014 Jun 18. PMID: 24943724; PMCID: PMC4296189).
Mitra, A. et al. Cervical intraepithelial neoplasia disease progression is associated with increased vaginal microbiome diversity. Sci Rep. 17(5), 16865. https://doi.org/10.1038/srep16865 (2015) (PMID:26574055;PMCID:PMC4648063).
Mitra, A. et al. The vaginal microbiota, human papillomavirus infection and cervical intraepithelial neoplasia: what do we know and where are we going next?. Microbiome. 4(1), 58. https://doi.org/10.1186/s40168-016-0203-0 (2016) (PMID:27802830;PMCID:PMC5088670).
Ravel, J. et al. Vaginal microbiome of reproductive-age women. Proc. Natl. Acad. Sci. U S A. 108(Suppl 1), 4680–4687. https://doi.org/10.1073/pnas.1002611107 (2011) (Epub 2010 Jun 3. PMID: 20534435; PMCID: PMC3063603).
Meng, L. T. et al. Relationship of HPV infection and BV, VVC, TV: a clinical study based on 1 261 cases of gynecologic outpatients. Zhonghua Fu Chan Ke Za Zhi. 51(10), 730–733. https://doi.org/10.3760/cma.j.issn.0529-567X.2016.10.004 (2016) (PMID: 27788738).
Gillet, E. et al. Bacterial vaginosis is associated with uterine cervical human papillomavirus infection: a meta-analysis. BMC Infect. Dis. 11(11), 10. https://doi.org/10.1186/1471-2334-11-10 (2011) (PMID:21223574; PMCID:PMC3023697).
Caixeta, R. C. et al. Association between the human papillomavirus, bacterial vaginosis and cervicitis and the detection of abnormalities in cervical smears from teenage girls and young women. Diagn. Cytopathol. 43(10), 780–785. https://doi.org/10.1002/dc.23301 (2015) (Epub 2015 Jul 14 PMID: 26173042).
de Castro-Sobrinho, J. M. et al. Bacterial vaginosis and inflammatory response showed association with severity of cervical neoplasia in HPV-positive women. Diagn. Cytopathol. 44(2), 80–86. https://doi.org/10.1002/dc.23388 (2016) (Epub 2015 Dec 8 PMID: 26644228).
Gillet, E. et al. Association between bacterial vaginosis and cervical intraepithelial neoplasia: systematic review and meta-analysis. PLoS One 7(10), e45201. https://doi.org/10.1371/journal.pone.0045201 (2012) (Epub 2012 Oct 2. PMID: 23056195; PMCID: PMC3462776).
Discacciati, M. G. et al. Is bacterial vaginosis associated with squamous intraepithelial lesion of the uterine cervix?. Diagn. Cytopathol. 34(5), 323–325. https://doi.org/10.1002/dc.20431 (2006) (PMID: 16604551).
Peres, A. L. et al. Molecular analysis and conventional cytology: association between HPV and bacterial vaginosis in the cervical abnormalities of a Brazilian population. Genet. Mol. Res. 14(3), 9497–9505. https://doi.org/10.4238/2015.August.14.13 (2015) (PMID: 26345883).
Gajer, P. et al. Temporal dynamics of the human vaginal microbiota. Sci. Transl. Med. 4(132), 132ra52. https://doi.org/10.1126/scitranslmed.3003605 (2012) (PMID: 22553250; PMCID: PMC3722878).
Gao, W., Weng, J., Gao, Y. & Chen, X. Comparison of the vaginal microbiota diversity of women with and without human papillomavirus infection: a cross-sectional study. BMC Infect. Dis. 10(13), 271. https://doi.org/10.1186/1471-2334-13-271 (2013) (PMID: 23758857; PMCID: PMC3684509).
Langille, M. G. et al. Predictive functional profiling of microbial communities using 16S rRNA marker gene sequences. Nat. Biotechnol. 31(9), 814–821. https://doi.org/10.1038/nbt.2676 (2013) (Epub 2013 Aug 25. PMID: 23975157; PMCID: PMC3819121).
Kanehisa, M. & Goto, S. KEGG: kyoto encyclopedia of genes and genomes. Nucleic Acids Res. 28(1), 27–30. https://doi.org/10.1093/nar/28.1.27 (2000) (PMID: 10592173; PMCID: PMC102409).
Kanehisa, M. Toward understanding the origin and evolution of cellular organisms. Protein Sci. 28(11), 1947–1951. https://doi.org/10.1002/pro.3715 (2019) (Epub 2019 Sep 9. PMID: 31441146; PMCID: PMC6798127).
Kanehisa, M., Furumichi, M., Sato, Y., Ishiguro-Watanabe, M. & Tanabe, M. KEGG: integrating viruses and cellular organisms. Nucleic Acids Res. 49(D1), D545–D551. https://doi.org/10.1093/nar/gkaa970 (2021) (PMID: 33125081; PMCID: PMC7779016).
Mitra, A. et al. The vaginal microbiota associates with the regression of untreated cervical intraepithelial neoplasia 2 lesions. Nat. Commun. 11(1), 1999. https://doi.org/10.1038/s41467-020-15856-y (2020) (PMID: 32332850; PMCID: PMC7181700).
Gaffney, D. K., Hashibe, M., Kepka, D., Maurer, K. A. & Werner, T. L. Too many women are dying from cervix cancer: problems and solutions. Gynecol. Oncol. 151(3), 547–554. https://doi.org/10.1016/j.ygyno.2018.10.004 (2018) (Epub 2018 Oct 6. PMID: 30301561; PMCID: PMC6281756).
Crosbie, E. J., Einstein, M. H., Franceschi, S. & Kitchener, H. C. Human papillomavirus and cervical cancer. Lancet 382(9895), 889–899. https://doi.org/10.1016/S0140-6736(13)60022-7 (2013) (Epub 2013 Apr 23 PMID: 23618600).
Kahn, J. A. HPV vaccination for the prevention of cervical intraepithelial neoplasia. N. Engl. J. Med. 361(3), 271–278. https://doi.org/10.1056/NEJMct0806938 (2009) (PMID: 19605832).
Anahtar, M. N. et al. Cervicovaginal bacteria are a major modulator of host inflammatory responses in the female genital tract. Immunity 42(5), 965–976. https://doi.org/10.1016/j.immuni.2015.04.019 (2015) (PMID: 25992865; PMCID: PMC4461369).
Torcia, M. G. Interplay among vaginal microbiome, immune response and sexually transmitted viral infections. Int J Mol Sci. 20(2), 266. https://doi.org/10.3390/ijms20020266 (2019) (PMID: 30641869; PMCID: PMC6359169).
Muzny, C. A. & Schwebke, J. R. Pathogenesis of bacterial vaginosis: discussion of current hypotheses. J. Infect. Dis. 214(1), S1-5. https://doi.org/10.1093/infdis/jiw121 (2016) (PMID: 27449868; PMCID: PMC4957507).
Blanks, R. G., Moss, S. M., Coleman, D. A., Addou, S. & Swerdlow, A. J. The use of screening episodes linked to CIN3 and invasive cancer registrations to study outcomes from the nhs cervical screening programme. Cytopathology 20(3), 154–160. https://doi.org/10.1111/j.1365-2303.2008.00620.x (2009) (Epub 2009 Jan 21 PMID: 19207309).
Buick, C., Jembere, N., Wang, L. & Kupets, R. Cervical screening and colposcopy management of women age 24 and under. J. Obstet. Gynaecol. Can. 42(12), 1518–1524. https://doi.org/10.1016/j.jogc.2020.06.013 (2020) (Epub 2020 Jul 1 PMID: 32988802).
Petrova, M. I., Reid, G., Vaneechoutte, M. & Lebeer, S. Lactobacillus iners: friend or foe?. Trends Microbiol. 25(3), 182–191. https://doi.org/10.1016/j.tim.2016.11.007 (2017) (Epub 2016 Dec 1 PMID: 27914761).
Nilsen, T., Swedek, I., Lagenaur, L. A. & Parks, T. P. Novel selective inhibition of lactobacillus iners by lactobacillus-derived bacteriocins. Appl. Environ. Microbiol. 86(20), e01594-e1620. https://doi.org/10.1128/AEM.01594-20 (2020) (PMID: 32801180; PMCID: PMC7531956).
De Backer, E. et al. Quantitative determination by real-time PCR of four vaginal Lactobacillus species, Gardnerella vaginalis and Atopobium vaginae indicates an inverse relationship between L. gasseri and L. iners. BMC Microbiol. 7, 115. https://doi.org/10.1186/1471-2180-7-115 (2007) (PMID: 18093311; PMCID: PMC2233628).
Lebeer, S., Vanderleyden, J. & De Keersmaecker, S. C. Genes and molecules of lactobacilli supporting probiotic action. Microbiol. Mol. Biol. Rev. 72(4), 728–764. https://doi.org/10.1128/MMBR.00017-08 (2008) (PMID: 19052326; PMCID: PMC2593565).
Macklaim, J. M. et al. Comparative meta-RNA-seq of the vaginal microbiota and differential expression by Lactobacillus iners in health and dysbiosis. Microbiome 1(1), 12. https://doi.org/10.1186/2049-2618-1-12 (2013) (PMID: 24450540; PMCID: PMC3971606).
Yoshimura, K., Ogawa, M. & Saito, M. In vitro characteristics of intravaginal Lactobacilli; why is L. iners detected in abnormal vaginal microbial flora?. Arch. Gynecol. Obstet. 302(3), 671–677. https://doi.org/10.1007/s00404-020-05634-y (2020) (Epub PMID: 32507987).
Macklaim, J. M., Gloor, G. B., Anukam, K. C., Cribby, S. & Reid, G. At the crossroads of vaginal health and disease, the genome sequence of Lactobacillus iners AB-1. Proc. Natl. Acad. Sci. U S A. 108(Suppl 1), 4688–4695. https://doi.org/10.1073/pnas.1000086107 (2011) (Epub 2010 Nov 8. PMID: 21059957; PMCID: PMC3063587).
McMillan, A., Macklaim, J. M., Burton, J. P. & Reid, G. Adhesion of Lactobacillus iners AB-1 to human fibronectin: a key mediator for persistence in the vagina?. Reprod. Sci. 20(7), 791–796. https://doi.org/10.1177/1933719112466306 (2013) (Epub 2012 Nov 30 PMID: 23202727).
Magoč, T. & Salzberg, S. L. FLASH: fast length adjustment of short reads to improve genome assemblies. Bioinformatics 27(21), 2957–2963. https://doi.org/10.1093/bioinformatics/btr507 (2011) (Epub 2011 Sep 7. PMID: 21903629; PMCID: PMC3198573).
Bokulich, N. A. et al. Quality-filtering vastly improves diversity estimates from Illumina amplicon sequencing. Nat. Methods 10(1), 57–59. https://doi.org/10.1038/nmeth.2276 (2013) (Epub 2012 Dec 2. PMID: 23202435; PMCID: PMC3531572).
Caporaso, J. G. et al. QIIME allows analysis of high-throughput community sequencing data. Nat. Methods 7(5), 335–336. https://doi.org/10.1038/nmeth.f.303 (2010) (Epub 2010 Apr 11. PMID: 20383131; PMCID: PMC3156573).
Edgar, R. C., Haas, B. J., Clemente, J. C., Quince, C. & Knight, R. UCHIME improves sensitivity and speed of chimera detection. Bioinformatics 27(16), 2194–2200. https://doi.org/10.1093/bioinformatics/btr381 (2011) (Epub 2011 Jun 23. PMID: 21700674; PMCID: PMC3150044).
Haas, B. J. et al. Chimeric 16S rRNA sequence formation and detection in Sanger and 454-pyrosequenced PCR amplicons. Genome Res. 21(3), 494–504. https://doi.org/10.1101/gr.112730.110 (2011) (Epub 2011 Jan 6. PMID: 21212162; PMCID: PMC3044863).
Edgar, R. C. UPARSE: highly accurate OTU sequences from microbial amplicon reads. Nat. Methods 10(10), 996–998. https://doi.org/10.1038/nmeth.2604 (2013) (Epub 2013 Aug 18 PMID: 23955772).
Quast, C. et al. The SILVA ribosomal RNA gene database project: improved data processing and web-based tools. Nucleic Acids Res. 41(Database issue), D590–D596. https://doi.org/10.1093/nar/gks1219 (2013) (Epub 2012 Nov 28. PMID: 23193283; PMCID: PMC3531112).
Edgar, R. C. MUSCLE: multiple sequence alignment with high accuracy and high throughput. Nucleic Acids Res. 32(5), 1792–1797. https://doi.org/10.1093/nar/gkh340 (2004) (PMID: 15034147; PMCID: PMC390337).
Segata, N. et al. Metagenomic biomarker discovery and explanation. Genome Biol. 12(6), R60. https://doi.org/10.1186/gb-2011-12-6-r60 (2011) (PMID:21702898; PMCID:PMC3218848).
Acknowledgements
We would like to thank MD student Hao Lin in Chinese Center for Disease Control and Prevention for providing help to this study. We would like to thank TopEdit (www.topeditsci.com) for its linguistic assistance during the preparation of this manuscript. This work was supported by the National Key Research and Development Program of China (2019YFC1200400) and General Administration of Customs, P.R. China (2019HK125).
Author information
Authors and Affiliations
Contributions
G.G., G.W. and P.L. contributed to conception and design; X.X. and Y.Z. contributed to development of methodology; X.X., Y.Z., L.Y., X.S., M.M., and J.X. contributed to acquisition of data; X.X., Y.Z., and J.P. contributed to analysis and visualization of data; X.X. and Y.Z. contributed to original draft writing; All authors contributed to review and revision of manuscript.
Corresponding authors
Ethics declarations
Competing interests
The authors declare no competing interests.
Additional information
Publisher's note
Springer Nature remains neutral with regard to jurisdictional claims in published maps and institutional affiliations.
Rights and permissions
Open Access This article is licensed under a Creative Commons Attribution 4.0 International License, which permits use, sharing, adaptation, distribution and reproduction in any medium or format, as long as you give appropriate credit to the original author(s) and the source, provide a link to the Creative Commons licence, and indicate if changes were made. The images or other third party material in this article are included in the article's Creative Commons licence, unless indicated otherwise in a credit line to the material. If material is not included in the article's Creative Commons licence and your intended use is not permitted by statutory regulation or exceeds the permitted use, you will need to obtain permission directly from the copyright holder. To view a copy of this licence, visit http://creativecommons.org/licenses/by/4.0/.
About this article

Cite this article
Xu, X., Zhang, Y., Yu, L. et al. A cross-sectional analysis about bacterial vaginosis, high-risk human papillomavirus infection, and cervical intraepithelial neoplasia in Chinese women. Sci Rep 12, 6609 (2022). https://doi.org/10.1038/s41598-022-10532-1
Received:
Accepted:
Published:
DOI: https://doi.org/10.1038/s41598-022-10532-1
This article is cited by
-
Association between bacterial vaginosis with human papillomavirus in the United States (NHANES 2003–2004)
BMC Women's Health (2024)
-
Association between vaginal microbiome alteration and povidone iodine use during delivery
BMC Microbiology (2023)
-
Integrating compositional and functional content to describe vaginal microbiomes in health and disease
Microbiome (2023)
Comments
By submitting a comment you agree to abide by our Terms and Community Guidelines. If you find something abusive or that does not comply with our terms or guidelines please flag it as inappropriate.
