
Abstract
Nitrous oxide (N2O) is a stratospheric ozone depleting greenhouse gas that has global warming potential. As the catalytic decomposition of N2O is one of the most promising techniques for N2O emissions abatement, in this study, for this purpose the properties of Ru supported on various oxide materials were investigated under excess O2 conditions, and the identities of the N2O adsorption species on the catalysts were confirmed. To clarify the correlation between the catalytic properties and N2O decomposition activity, the supported Ru catalysts were characterised by means of powder X-ray diffraction, X-ray fluorescence measurements, energy-dispersive X-ray mapping and several gas sorption techniques. The results showed that the redox properties for Ru (RuO2) at low temperature are closely associated with N2O decomposition activity. The local structures, optimal Ru loading and N2O adsorption species of the novel Ru/SnO2 catalysts were studied and they showed high activity for N2O decomposition.
Introduction
N2O is a stratospheric ozone depleting greenhouse gas that has a long lifetime of approximately 114 years and a global warming potential that is 310 times higher than that of CO21,2,3,4,5,6,7,8,9,10,11. In addition, recently, anthropogenic N2O emissions, from fossil fuel-using industries and biomass combustion, as well as from chemical plants that produce adipic and nitric acid, have been annually increasing8. If every country and/or international organisation in the world does not put in place mitigation strategies, N2O emissions are forecast to approximately double by 20508,9,10,11. To overcome these issues, catalytic decomposition of N2O to N2 and O2 is one of the most promising and economical techniques for emissions abatement, because the N2O emissions from combustion and chemical plants can be controlled using only end-of-pipe technologies employing exhaust heat. Over the past few years, supported metal oxides, noble metals and/or metal oxides and composite oxide (perovskites, hydrotalcites, spinels and hexa-aluminates) catalysts for N2O decomposition have been studied8,12,13,14,15,16,17,18,19,20,21,22,23,24,25,26,27,28,29,30,31,32,33,34. In terms of supported catalysts, it has been shown that their activities for N2O decomposition follow the order of Ru, Rh, Ir > Pd > Cu > Fe > Pt > Ni > Mn8.
In the case of active Ru catalysts, as Ru species are efficient catalysts for the dissociation of the N–O bond in N2O, their catalysts are thus promising candidates for N2O decomposition26,27,28,29,30,31,32,33,34. However, the catalytic activities of Ru species are strongly related to their sizes, distributions and degrees of agglomeration. Zheng et al. studied the effect of support materials (MgO, SiO2, CeO2, Al2O3, TiO2, active carbon and SiC) on the catalytic properties of supported Ru for the N2O decomposition reaction31. They concluded that Ru/TiO2 shows high activity for N2O decomposition, where the activity was found to be related to the reducibility of the catalyst. Lin et al. also suggested that Ru supported on rutile-type TiO2 exhibited higher N2O decomposition activity compared with Ru/anatase-TiO2, Ru/Al2O3, Ru/SiO2 and other such systems, because its catalytic properties are induced by Ru metal dispersion and its monolayer structure30. Komvokis et al. prepared highly dispersed Ru/γ-Al2O3 via a conventional impregnation and ethylene glycol (EG) method and reported that Ru/γ-Al2O3 prepared using the EG method featured metallic Ru nanoparticles with a size of ca. 1–3 nm and high activity for N2O decomposition with H2O, SO2 and NO28. Recently, active Ru supported on perovskite-like La1.6Sr0.4NiO4 was prepared by Sui et al.33, who indicated that the activity arose due to the desorption of a large amount of oxygen from the active sites at low temperature and the ability of the oxygen vacancies to regenerate. Therefore, as stated above, Ru species are expected to be possible candidates for N2O decomposition catalysts due to their specific catalytic properties.
For N2O emissions from industrial combustion processes (i.e. fluidised bed combustion), it is considered that these emissions contain, amongst other gases, ca. 50–200 ppm of N2O, excess O2 (2–10%) and 10% H2O (water vapour)8,35,36. Therefore, as any catalysts that are developed may potentially be used in the decomposition of N2O from industrial combustion processes as a practical application, the evaluation of their catalytic properties under steady gas emissions conditions is required. Therefore, in this study, the N2O decomposition reaction properties of Ru supported on various oxide materials under excess O2 conditions were focused on, and the identities of the N2O adsorption species on these catalysts were confirmed. As the novel Ru/SnO2 catalysts in this work showed high activity for N2O decomposition, their local structures, optimal Ru loading and N2O adsorption species were determined. Finally, the reproducibility of the effects that H2O (water vapour) have on the N2O decomposition properties was evaluated.
Results and discussion
Ru supported on various metal oxide materials
Figure 1 shows the powder X-ray diffraction (PXRD) patterns of Ru supported on various metal oxide materials. The diffraction peaks for the Ru of all of the supported catalysts could be assigned to RuO2, and the Al2O3 of Ru/Al2O3 and TiO2 of Ru/TiO2 could be assigned to γ phase and brookite structures, respectively. As the other support materials also had compositional formulas, the solid-state reaction of RuO2 and the support materials was not observed.

PXRD patterns of 5.0 wt% Ru supported on various different metal oxide materials prepared by impregnation, followed by drying and calcination at 600 °C for 3 h in air.
Figure 2 shows a comparison of the temperature dependence of N2O conversion for the various different supported Ru catalysts. As none of the catalysts showed NO production, as detected by non-dispersive infrared (NDIR) spectroscopy, it was presumed that N2O decomposed into N2 and O2. For Ru/SnO2 and Ru/ZrO2, the light-off curves of N2O were obtained at approximately 200 °C, although the light-off temperature at which 90% conversion of N2O occurred was not reached for all catalysts at a reaction temperature of 600 °C. In the case of Ru/Nb2O5, it showed almost no activity.

Catalytic activity for N2O decomposition reaction over 5.0 wt% Ru supported on various different metal oxide materials. Reaction conditions: 200 ppm of N2O, 10% O2 and N2 balance at 100 cm3 min−1 (W/F = 5.0 × 10⁻⁴ g·min cm−3).
Table 1 summarises the properties of the different catalysts, in which the activity is expressed in terms of the light-off temperature at which 50% conversion of N2O was achieved (T50). The T50 values increased in the order of SnO2 < ZrO2 < Al2O3 < CeO2 < Ta2O5 < TiO2 ≈ WO3 ≈ Nb2O5, which bears no relation to the Brunauer − Emmett − Teller surface area (SBET) values of their catalysts. The order of the T50 values is almost consistent with the order of the reduction temperatures observed from the H2-temperature-programmed reduction (TPR) experiments (see Table 1 and Supplementary Figure S1): Al2O3 < SnO2 < ZrO2 < CeO2 < Ta2O5 < TiO2 < WO3 < Nb2O5, suggesting that the redox properties for Ru (RuO2) at low reaction temperature are closely related to the N2O decomposition activity. Because, in addition, the supported Ru catalysts with lower reduction temperatures tended to exhibit higher metal dispersion (smaller particle size), it is considered that highly dispersed Ru (RuO2) particles act as an active catalyst for N2O decomposition reaction. Ru/CeO2 exhibited high metal dispersion (18%), but its activity showed medium. In case of CeO2-supported catalysts, the overestimation for the metal dispersion was previously reported, because of CO adsorbed on CeO2 support as carbonate species37. Therefore, it is suggested that the overestimation for the dispersion for Ru/CeO2 was also caused by CO adsorption on CeO2, and its relationship between the dispersion and activity for Ru/CeO2 are low. Ru3d XPS spectra for 5.0 wt% Ru catalysts supported on various oxide materials were obtained (Supplementary Figure S2). According to the previous report for Ru3d XPS spectra analysis38, the binding energies of Ru3d5/2 peaks for all catalysts could be assigned to the oxidation state of Ru4+ (approximately 280.4 eV), which is consistent with the assignment for RuO2 of XRD patterns. In addition, Ru3d5/2 peak area and intensity for Ru/SnO2 showed slightly higher in comparison with the other catalysts, which indicates that Ru surface concentration for Ru/SnO2 is higher in agreement with high Ru metal dispersion estimated by CO adsorption.
To study the acid and base properties of the supported Ru catalysts, the amount of desorbed gas per weight on the catalyst was estimated using NH3- and NO-temperature-programmed desorption (TPD) and was found to be in the range 100–500 °C (see Supplementary Figure S3 and Figure S4 for more details), the data of which are also summarised in Table 1. Ru/Al2O3 and Ru/TiO2 showed high amounts of desorbed NH3, whereas Ru/CeO2 exhibited a low amount despite it having a relatively high SBET value. The other catalysts also showed lower acidity than Ru/Al2O3. However, in terms of NO desorbability, there was no significant difference as well as no relation to the SBET value. However, it was also implied that the supported Ru with a higher amount of NO desorbability tended to approximately exhibit higher N2O decomposition activity, which therefore indicated that there is almost a correlation between the base properties and the catalytic N2O decomposition activity.
To confirm the identities of the N2O adsorption species on the various different supported Ru catalysts and the reasons for their different activities, in situ Fourier-transform infrared (FTIR) spectra were recorded at 200 °C, which is the approximate initiation temperature for N2O decomposition (Fig. 3). Based on previous reports32,39,40,41,42, two bands at 2238 and 2008 cm−1, attributed to adsorbed N2O, were observed for all of the catalysts. Several other bands were also observed in the range of 1000–1700 cm−1, which were attributed to nitrites, nitrates and nitro compounds that were adsorbed on the catalysts. These bands determinably appeared for Ru/CeO2 and Ru/ZrO2, which is consistent with the high NO adsorbability (basicity) in the range of 300–600 °C (see Supplementary Figure S4 for more details). In addition, the band at approximately 1870 cm−1 attributed to adsorbed NO was observed for Ru/Al2O3, Ru/CeO2, Ru/ZrO2 and Ru/SnO2, which showed that these systems have relatively high activity for N2O decomposition. Therefore, it was concluded that this band attributed to NO species can be considered as belonging to activated N2O.
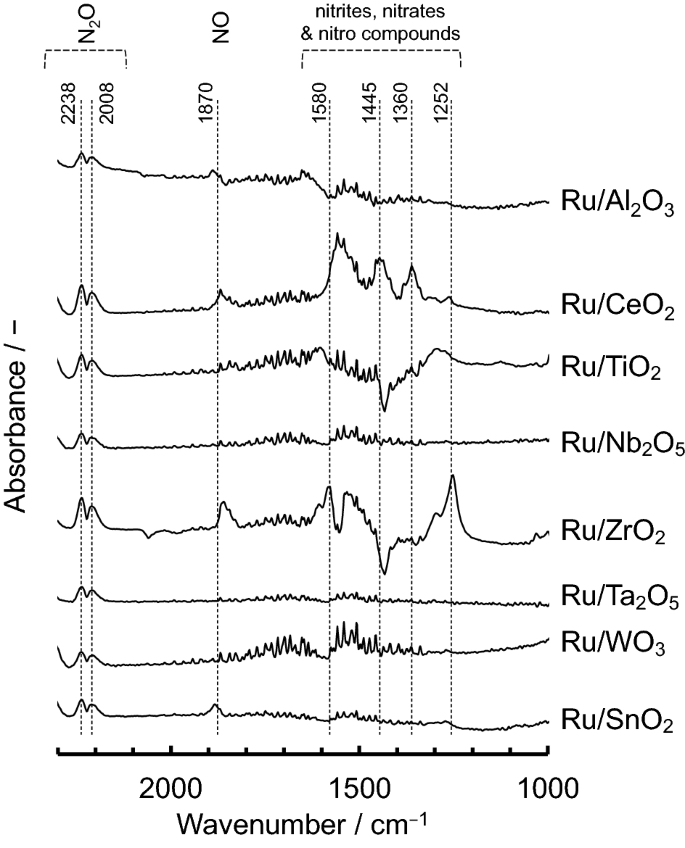
In situ FTIR spectra of N2O adsorbed on 5.0 wt% Ru supported on various different metal oxide materials, measured at 200 °C in gas feeds of 200 ppm of N2O and N2 balance.
Effects of Ru loading on catalytic N2O decomposition
As the Ru/SnO2 catalyst exhibited high N2O decomposition activity, the optimal amount of Ru loading, its local structure and catalytic properties were comprehensively studied. In the PXRD patterns of the catalysts with different loading amounts of Ru (see Supplementary Figure S5 for more details), the diffraction peaks for SnO2 can be observed for all of the catalysts, whereas the diffraction peaks for RuO2 can be observed in the patterns for the catalysts with a Ru loading of higher than 5.0 wt%. In addition, the intensities of the diffraction peaks of RuO2 increased upon an increase in the Ru loading, which probably suggests an increase in the crystallinity and/or particle size upon the increase in RuO2. In terms of the SBET values of the catalysts with different amounts of Ru loading (see Supplementary Table S1 for more detail), the values were observed to decrease upon an increase in the Ru loading, probably because of the lower proportion of SnO2 to a higher proportion of RuO2. The local structure of the 5.0 wt% Ru/SnO2 sample was characterised using scanning transmission electron microscopy and energy-dispersive X-ray mapping (STEM-EDX) mapping (Fig. 4). The bright-field STEM image revealed SnO2 particles present in the sample with sizes of approximately 10–100 nm. From the overlay image of the EDX mapping, Sn − L (blue) and Ru − K (green) fluorescence lines can be observed. Therefore, based on these and the PXRD results, RuO2 particles with a size of approximately 50 nm, as shown by the arrows in Fig. 4, were dispersed on the SnO2 support.

(left) TEM image and (right) EDX mapping analysis of 5.0 wt% Ru/SnO2. The blue and green dots correspond to the Sn − L and Ru − K fluorescence lines, respectively.
In Fig. 5 and Supplementary Table S1 the temperature dependence of N2O conversion are compared for 0.5–20 wt% Ru/SnO2. It was found that 0.5 and 1.0 wt% Ru/SnO2 showed a lower activity of catalytic N2O decomposition, whereas 5.0–20 wt% Ru/SnO2 exhibited almost the same light-off profile for N2O and T50. Therefore, it was assumed that the optimal Ru loading supported on SnO2 was approximately 5.0 wt%. Supplementary Figure S6 also shows N2O conversion, NO selectivity and mass signal for N2O decomposition reaction over 5.0 wt% Ru/SnO2. NO selectivity was not observed. For the production of NO2, the mass signal for m/z value of 44 for N2O decreased, which is consistent with N2O conversion, whereas the mass signal for m/z value of 46 for NO2 was constant. In addition, we estimated the energy difference to generate NO2 from NO and O by density functional theory calculations at the level of BP8643,44/def-SV(P)45 under the resolution of identity approximation46 using TURBOMOLE47. Although NO2 can be formed barrierlessly from NO and O, the preparation of O from O2 requires large energy of 6.24 eV, which is larger than the NO2 formation energy from NO and O, 4.23 eV. Therefore, it is considered that not only NO but also NO2 were not produced during the N2O decomposition reaction over 5.0 wt% Ru/SnO2.
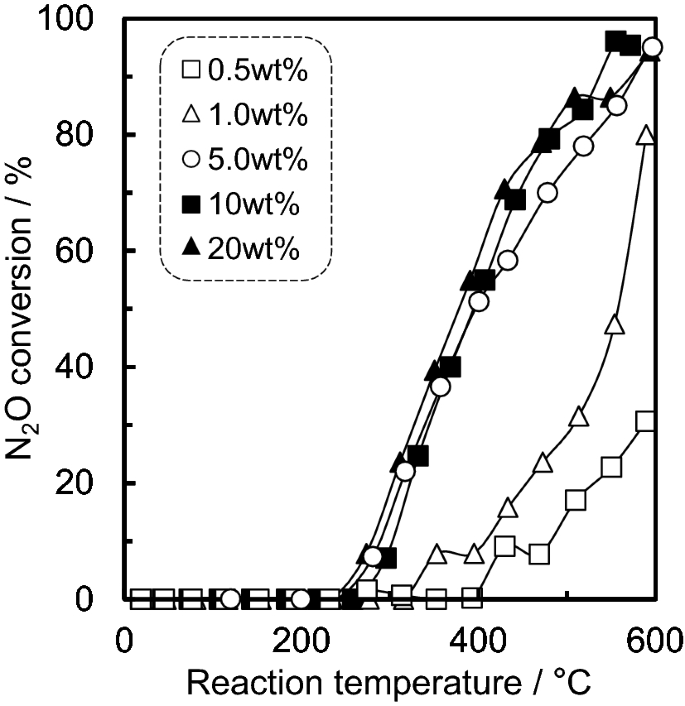
Catalytic activity for the N2O decomposition reaction over 0.5–20 wt% Ru/SnO2. Reaction conditions: 200 ppm of N2O, 10% O2 and N2 balance at 100 cm3·min−1 (W/F = 5.0 × 10⁻⁴ g·min·cm−3).
To also confirm the relationship between the N2O adsorption species and decomposition activities, in situ FTIR spectra were recorded for 0.5–20 wt% Ru/SnO2 at 200 °C (Fig. 6). For all of the Ru/SnO2 samples, two bands were observed for adsorbed N2O, at 2238 and 2008 cm−1. However, bands for adsorbed NO (1870 cm−1) and NOx compounds (1000–1700 cm−1) were present for the 5.0–20 wt% Ru/SnO2 that have high activities, which is consistent with the results that is Ru supported on the different metal oxide materials. Therefore, it is expected that this NO band can be considered as belonging to activated N2O. In situ FTIR spectra of N2O adsorbed on 5.0 wt% Ru/SnO2 at 300 °C and 400 °C were also confirmed (Supplementary Figure S7). The two bands attributed to adsorbed N2O (2008 and 2238 cm−1) were observed at 300 °C, whereas the bands were not observed at 400 °C. These bihaviors probably imply that catalytic N2O decomposition reaction was proceeded.

In situ FTIR spectra of N2O adsorbed on 0.5–20 wt% Ru/SnO2. The spectra were measured at 200 °C in gas feeds of 200 ppm of N2O and N2 balance.
Stability, reproducibility and the effects of water vapour
To evaluate the stability and reproducibility of the 5.0 wt% Ru/SnO2 catalyst, the N2O decomposition reaction was repeated five times. Figure 7, Supplementary Figure S8 and Supplementary Table S2 give summaries of the temperature dependence of N2O conversion for repeated cycles using 5.0 wt% Ru/SnO2. Upon repetition of the catalytic cycle, the light-off temperature and T50 tended to slightly increase. Because there is concern for the vaporisation as RuO3 and/or RuO448, it is considered that the stability of RuO2 is low at high temperature. XRD patterns and Ru3d XPS spectra for 5.0 wt% Ru/SnO2 after N2O decomposition reaction were obtained (Supplementary Figure S9). For XRD pattens, the diffraction peaks for Ru/SnO2 after the reaction could be assigned to RuO2 and SnO2. In comparison with as-prepared catalysts (before reaction), not only the diffraction peaks but also Ru3d XPS spectra for 5.0 wt% Ru/SnO2 after reaction are almost no change. The Ru metal dispersion for 5.0 wt% Ru/SnO2 after N2O decomposition reaction at 600 °C was also estimated, and it showed 6%. In comparison with the dispersion for as-prepared 5.0 wt% Ru/SnO2 (7%), it is slight low. Therefore, it is suggested that the sintering of Ru (RuO2) was slightly induced by the N2O decomposition reaction at 600 °C. However, the light-off temperature at which 90% conversion was achieved was almost reached for all of the catalysts at 600 °C. Therefore, the stability and reproducibility of 5.0 wt% Ru/SnO2 were confirmed. In addition, time-on-stream stability of catalytic activity for the N2O decomposition reaction over 5.0 wt% Ru/SnO2 at 400 °C was also studied (Supplementary Figure S10). Because the stable N2O conversition (ca. 55%) was confirmed in approximately 2 h, it is considered that the the catalytic stability for 5.0 wt% Ru/SnO2 was verified.

Catalytic activity (T50) for the N2O decomposition reaction over 5.0 wt% Ru/SnO2 as a function of the repetition number, and the effects of water vapour (10% H2O). Reaction conditions: 200 ppm of N2O, 10% O2 and N2 balance at 100 cm3·min−1 (W/F = 5.0 × 10⁻⁴ g min cm−3).
The effects of water vapour (10% H2O) on the N2O decomposition reaction over as-prepared 5.0 wt% Ru/SnO2 were also evaluated (see the plots in Supplementary Figure S8). The N2O conversion profile for the reaction with H2O shifted to a higher temperature than that without H2O. In comparison with the T50 values for the N2O decomposition reaction carried out in the absence of H2O, the T50 values of that carried out in the presence of H2O was higher, at 50 °C (see Supplementary Table S2 for more details). Therefore, it could be deduced that the deactivation of 5.0 wt% Ru/SnO2 and/or inhibition of N2O adsorption on 5.0wt % Ru/SnO2 was induced by the presence of H2O.
Conclusion
Ru catalysts supported on various different metal oxides were prepared by impregnation to evaluate their decomposition properties for N2O, which is a powerful greenhouse gas that is present in industrial emissions. From the PXRD patterns, the diffraction peaks for Ru of all of the supported catalysts could be assigned to RuO2. The T50 values were found to increase in the order of: SnO2 < ZrO2 < Al2O3 < CeO2 < Ta2O5 < TiO2 ≈ WO3 ≈ Nb2O5, which is almost consistent with the order of the reduction temperatures observed from the H2-TPR measurements. Therefore, it is considered that the redox properties for Ru (RuO2) at low reaction temperature are closely associated with N2O decomposition activity. In addition, according to the NO-TPD profiles and in situ FTIR data, a correlation can also be observed between the NO adsorption properties as well as the NO species considered to be activated N2O and the catalytic N2O decomposition activity. Among the supported Ru catalysts, Ru/SnO2 showed a high catalytic performance for the N2O decomposition reaction. SnO2 support materials induced the physicochemical properties, high reducibility (redox property), Ru (RuO2) dispersion and basicity for the catalysts, which are required for high N2O decomposition activity. As 5.0–20 wt% Ru/SnO2 exhibited almost the same light-off profiles for N2O and T50, the optimal amount of Ru loaded on the SnO2 support was found to be approximately 5.0 wt%. Although the deactivation of Ru/SnO2 was induced by H2O, the stability and reproducibility for N2O decomposition activity of Ru/SnO2 were confirmed.
Methods
Catalyst preparation
A wide variety of commercially available metal oxides, Al2O3 (JRC-ALO-8, Catalysis Society of Japan), CeO2 (JRC-CEO-5, Catalysis Society of Japan), TiO2, Nb2O5, ZrO2, Ta2O5, WO3 and SnO2 (Kojundo Chemical Lab.), were used as support materials for Ru. Supported Ru (5.0 wt% loading as Ru) samples were prepared via the impregnation of an aqueous solution of RuCl3 (Fujifilm Wako Pure Chemical Corporation), followed by drying and calcination at 600 °C for 3 h in air. To study the effects of Ru loading, 0.5–20 wt% of Ru/SnO2 catalysts that show a high performance in N2O decomposition were prepared in a similar manner for comparison.
Characterisation
PXRD measurements were performed using mono-chromated Cu Kα radiation (40 kV, 15 mA, MiniFlex600, Rigaku). The chemical compositions of the samples were determined from X-ray fluorescence measurements (XRF, MESA-500 W, Horiba). Spectra from X-ray photoelectron spectroscopy (XPS) were obtained using Al Kα radiation (PHI 5000-VersaProbe, Ulvac-Phi). The C1s signal at 284.8 eV that was derived from adventitious carbon was used as a reference to correct for the effect of surface charge. STEM-EDX mapping were performed using a JEM-ARM200CF microscope (Jeol). SBET calculations were performed using N2 adsorption isotherms, which were obtained at − 196 °C (ASAP2020, Micromeritics). H2-TPR measurements were performed in a flow system (5% H2/Ar) at a constant rate of 10 °C min−1 (Bel-cat, Microtrac-Bel). The NH3 and/or NO adsorbability of the catalysts were also studied through TPD. Prior to the measurements, the catalysts were treated at 500 °C for 1 h under an Ar flow and were subsequently cooled at 100 °C for 30 min in 5% NH3/Ar and 1% NO/Ar (50 cm3 min−1). After pre-treatment, the catalysts were heated to 500 °C under a He flow at a constant rate of 10 °C·min−1. The concentrations of the desorbed NH3 and/or NO in the effluent gas were analysed using an online thermal conductivity detector (TCD) signal (Bel-cat, Microtrac-Bel). The Ru metal dispersion was determined by pulsed CO chemisorption at 50 °C (Bel-metal, Microtrac-Bel) after the catalyst was oxidised using O2 and subsequently reduced using H2 at 400 °C. The metal dispersion was calculated from the molar ratio of chemisorbed CO to loaded Ru by assuming that the chemisorption stoichiometry of Ru:CO was 1:1.
Catalytic N2O decomposition tests
The catalytic decomposition of N2O was performed in a flow reactor at atmospheric pressure. Catalysts (10–20 mesh, < 0.3 mm thickness, 50 mg) were fixed in a quartz tube (outside diameter: 6 mm, inside diameter: 4 mm) with quartz wool at both ends of the catalyst bed. The temperature dependence of the catalytic activity was evaluated by heating the catalyst bed from room temperature to 600 °C at a constant rate of 10 °C min−1 while a gas mixture containing 200 ppm of N2O, 10% O2 and N2 balance was supplied at 100 cm3 min−1 (W/F = 5.0 × 10⁻⁴ g min cm−3). For the catalysts that exhibited high performance, the reactions were repeated to evaluate the stability of the catalysts and the reproducibility of the results. Effects of water vapour (10% H2O) on the N2O decomposition reaction were also evaluated. The N2O, NO and gas concentrations were analysed using an NDIR analyser (VA-3011, Horiba) and quadrupole mass spectrometer (PrismaPlus, Pfeiffer).
In situ FTIR spectra were recorded on a FT/IR-6600 spectrometer (Jasco) using a diffuse-reflectance reaction cell with a BaF2 window connected to a gas supply and a heating system to enable measurements to be conducted under atmospheric pressure. First, the catalysts were preheated in situ in a flow of Ar at 400 °C for 30 min prior to each experiment. After pre-treatment, the temperature of the catalyst was decreased to 200 °C, followed by the subsequent purging of the cell with Ar and then filling with 200 ppm of N2O/N2 gas. Finally, FTIR spectra were recorded while the catalysts were maintained under a stream of N2O/N2.
References
Rodhe, H. A comparison of the contribution of various gases to the greenhouse effect. Science 248, 1217–1219 (1990).
Hungate, B. A., Dukes, J. S., Shaw, M. R., Luo, Y. & Field, C. B. 3 Locked swimming and flight movements in nature to ascertain how widely vortex recycling is exploited during swimming and flight. Science 302, 1512–1513 (2003).
Van Veen, F. J. F. et al. Controlling engine emissions. Science 327, 1584–1586 (2010).
Kroeze, C. & Bouwman, L. The role of nitrogen in climate change. Curr. Opin. Environ. Sustain. 3, 279–280 (2011).
Davidson, E. A. & Kanter, D. Inventories and scenarios of nitrous oxide emissions. Environ. Res. Lett. 9, 105012 (2014).
Li, L., Xu, J., Hu, J. & Han, J. Reducing nitrous oxide emissions to mitigate climate change and protect the ozone layer. Environ. Sci. Technol. 48, 5290–5297 (2014).
Strokal, M. & Kroeze, C. Nitrous oxide (N2O) emissions from human waste in 1970–2050. Curr. Opin. Environ. Sustain. 9, 108–121 (2014).
Konsolakis, M. Recent Advances on Nitrous Oxide (N2O) decomposition over non-noble-metal oxide catalysts: Catalytic performance, mechanistic considerations, and surface chemistry aspects. ACS Catal. 5, 6397–6421 (2015).
Rao, S. & Riahi, K. The role of non-CO2 greenhouse gases in climate change mitigation: Long-term scenarios for the 21st century. Energy J. 27, 177–200 (2006).
Ravishankara, A. R., Daniel, J. S. & Portmann, R. W. Nitrous oxide (N2O): The dominant ozone-depleting substance emitted in the 21st century. Science 326, 123–125 (2009).
UNEP. Drawing down N2O to protect climate and the ozone layer. (2013). ISBN 978-92-807-3358-7.
Liu, Z., Amiridis, M. D. & Chen, Y. Characterization of CuO supported on Tetragonal ZrO2 Catalysts for N2O decomposition to N2. J. Phys. Chem. B 109, 1251–1255 (2005).
Smeets, P. J. et al. The catalytic performance of Cu-containing zeolites in N2O decomposition and the influence of O2, NO and H2O on recombination of oxygen. J. Catal. 256, 183–191 (2008).
Büchel, R., Strobel, R., Krumeich, F., Baiker, A. & Pratsinis, S. E. Influence of Pt location on BaCO3 or Al2O3 during NOx storage reduction. J. Catal. 261, 201–207 (2009).
Jíša, K. et al. Role of the Fe-zeolite structure and iron state in the N2O decomposition: Comparison of Fe-FER, Fe-BEA, and Fe-MFI catalysts. J. Catal. 262, 27–34 (2009).
Xia, H. et al. The promotional effect of NO on N2O decomposition over the bi-nuclear Fe sites in Fe/ZSM-5. J. Catal. 270, 103–109 (2010).
Qiao, Z. et al. PVAm–PIP/PS composite membrane with high performance for CO2/N2 separation. AIChE J. 59, 215–228 (2012).
Kim, B., Li, Z., Kay, B. D., Dohnálek, Z. & Kim, Y. K. Unexpected nondissociative binding of N2O on oxygen vacancies on a rutile TiO2(110)-1×1. J. Phys. Chem. C 116, 1145–1150 (2012).
Zhou, H. et al. Catalytic decomposition of N2O over CuxCe1-xOy mixed oxides. Appl. Catal. B Environ. 125, 492–498 (2012).
Konsolakis, M., Drosou, C. & Yentekakis, I. V. Support mediated promotional effects of rare earth oxides (CeO2 and La2O3) on N2O decomposition and N2O reduction by CO or C3H6 over Pt/Al2O3 structured catalysts. Appl. Catal. B Environ. 123–124, 405–413 (2012).
Wang, J. et al. Influence of extra-framework Al on the structure of the active iron sites in Fe/ZSM-35. J. Catal. 300, 251–259 (2013).
Konsolakis, M. et al. Insights into the role of SO2 and H2O on the surface characteristics and de-N2O efficiency of Pd/Al2O3 catalysts during N2O decomposition in the presence of CH4 and O2 excess. Appl. Catal. B Environ. 138–139, 191–198 (2013).
Huang, C. et al. Hydroxyapatite-supported rhodium catalysts for N2O decomposition. J. Mol. Catal. A Chem. 400, 90–94 (2015).
Pachatouridou, E. et al. N2O decomposition over ceria-promoted Ir/Al2O3 catalysts: The role of ceria. Appl. Catal. B Environ. 187, 259–268 (2016).
Zhang, C. et al. Catalytic decomposition of N2O over Co–Ti oxide catalysts: Interaction between Co and Ti oxide. ChemCatChem 8, 2155–2164 (2016).
Imamura, S., Okamoto, N., Saito, Y., Ito, T. & Jindai, H. Decomposition of Nitrous Oxide on Rhodium-Ceria Composite Catalyst. J. Jpn. Petrol. Inst. 39, 350–356 (1996).
Zeng, H. C. & Pang, X. Y. Catalytic decomposition of nitrous oxide on alumina-supported ruthenium catalysts Ru/Al2O3. Appl. Catal. B Environ. 13, 113–122 (1997).
Komvokis, V. G., Marti, M., Delimitis, A., Vasalos, I. A. & Triantafyllidis, K. S. Catalytic decomposition of N2O over highly active supported Ru nanoparticles (≤3nm) prepared by chemical reduction with ethylene glycol. Appl. Catal. B Environ. 103, 62–71 (2011).
Zhang, Y., Wang, X., Zhu, Y. & Zhang, T. Stabilization mechanism and crystallographic sites of Ru in Fe-promoted barium hexaaluminate under high-temperature condition for N2O decomposition. Appl. Catal. B Environ. 129, 382–393 (2013).
Lin, Q. et al. RuO2/rutile-TiO2: A superior catalyst for N2O decomposition. J. Mater. Chem. A 2, 5178–5181 (2014).
Zheng, J., Meyer, S. & Köhler, K. Abatement of nitrous oxide by ruthenium catalysts: Influence of the support. Appl. Catal. A Gen. 505, 44–51 (2015).
Sui, C. et al. Effect of Ru species on N2O decomposition over Ru/Al2O3 catalysts. Catalysts 6, 1–18 (2016).
Sui, C., Niu, X., Wang, Z., Yuan, F. & Zhu, Y. Activity and deactivation of Ru supported on La1.6Sr0.4NiO4 perovskite-like catalysts prepared by different methods for decomposition of N2O. Catal. Sci. Technol. 6, 8505–8515 (2016).
Zhang, Y., Guo, Y., Li, N. & Feng, Y. N2O abatement over ruthenium supported on highly dispersed hydrotalcite-like composite metal oxides. Polish J. Environ. Stud. 28, 4477–4484 (2019).
Kapteijn, F., Rodriguez-Mirasol, J. & Moulijn, J. A. Heterogeneous catalytic decomposition of nitrous oxide. Appl. Catal. B Environ. 9, 25–64 (1996).
Tran, K. Q., Kilpinen, P. & Kumar, N. In-situ catalytic abatement of NOx during fluidized bed combustion—A literature study. Appl. Catal. B Environ. 78, 129–138 (2008).
Takeguchi, T. et al. Determination of dispersion of precious metals on CeO2-containing supports. Appl. Catal. A Gen. 293, 91–96 (2005).
Kaga, Y., Abe, Y., Yanagisawa, H., Kawamura, M. & Sasaki, K. Ru and RuO2 thin films by XPS. Surf. Sci. Spectra 6, 68–74 (1999).
Fanning, P. E. & Vannice, M. A. A drifts study of Cu-ZSM-5 prior to and during its use for N2O decomposition. J. Catal. 207, 166–182 (2002).
Wood, B. R., Reimer, J. A. & Bell, A. T. Studies of N2O adsorption and decomposition on FE-ZSM-5. J. Catal. 209, 151–158 (2002).
Rac, V., Rakić, V., Damjanović-Vasilić, L., Dondur, V. & Auroux, A. Complementary approach to the adsorption of CO and N2O on bimetallic ion exchanged ZMS-5 zeolite: Microcalorimetric and FTIR spectroscopy study. Appl. Surf. Sci. 423, 1134–1140 (2017).
Jabłońska, M. et al. Catalytic decomposition of N2O over Cu-Al-Ox mixed metal oxides. RSC Adv. 9, 3979–3986 (2019).
Perdew, J. Density-functional approximation for the correlation energy of the inhomogeneous. Electron Gas Phys. Rev. B 33, 8822–8824 (1986).
Becke, A. D. Density-functional exchange-energy approximation with correct asymptotic behavior. Phys. Rev. A 38, 3098–3100 (1988).
Schäfer, A., Horn, H. & Ahlrichs, R. Fully optimized contracted gaussian basis sets for atoms Li to Kr. J. Chem. Phys. 97, 2571–2577 (1992).
Eichkorn, K., Weigend, F., Treutler, O. & Ahlrichs, R. Auxiliary basis sets for main row atoms and transition metals and their use to approximate coulomb potentials. Theor. Chem. Acc. 97, 119–124 (1997).
Turbomole. TURBOMOLE V7.5 2020, A Development of University of Karlsruhe and Forschungszentrum Karlsruhe GmbH, 1989–2007, TURBOMOLE GmbH, since 2007.
Bell, W. E. & Tagami, M. High-temperature chemistry of the ruthenium-oxygen system. J. Phys. Chem. 67, 2432–2436 (1963).
Acknowledgements
This research was partly supported by the Environment Research and Technology Development Fund (JPMEERF20191R03) of the Environmental Restoration and Conservation Agency of Japan, JSPS (20K05592), and NIMS microstructural characterisation platform (NMCP) as a programme of ‘Nanotechnology Platform’ of the Ministry of Education, Culture, Sports, Science and Technology (MEXT), Japan.
Author information
Authors and Affiliations
Contributions
S.H. proposed the idea and S.H., Y.K. and K.S. supervised the entire project. S.H. prepared catalysts and characterised the catalytic properties. T.I. and T.T. performed DFT computations. All authors discussed the results of the study. S.H. wrote the manuscript.
Corresponding author
Ethics declarations
Competing interests
The authors declare no competing interests.
Additional information
Publisher's note
Springer Nature remains neutral with regard to jurisdictional claims in published maps and institutional affiliations.
Supplementary information
Rights and permissions
Open Access This article is licensed under a Creative Commons Attribution 4.0 International License, which permits use, sharing, adaptation, distribution and reproduction in any medium or format, as long as you give appropriate credit to the original author(s) and the source, provide a link to the Creative Commons licence, and indicate if changes were made. The images or other third party material in this article are included in the article's Creative Commons licence, unless indicated otherwise in a credit line to the material. If material is not included in the article's Creative Commons licence and your intended use is not permitted by statutory regulation or exceeds the permitted use, you will need to obtain permission directly from the copyright holder. To view a copy of this licence, visit http://creativecommons.org/licenses/by/4.0/.
About this article

Cite this article
Hinokuma, S., Iwasa, T., Kon, Y. et al. N2O decomposition properties of Ru catalysts supported on various oxide materials and SnO2. Sci Rep 10, 21605 (2020). https://doi.org/10.1038/s41598-020-78744-x
Received:
Accepted:
Published:
DOI: https://doi.org/10.1038/s41598-020-78744-x
Comments
By submitting a comment you agree to abide by our Terms and Community Guidelines. If you find something abusive or that does not comply with our terms or guidelines please flag it as inappropriate.
