
Abstract
Grassland degradation and the concomitant loss of soil organic carbon is widespread in tropical arid and semi-arid regions of the world. Afforestation of degraded grassland, sometimes by using invasive alien trees, has been put forward as a legitimate climate change mitigation strategy. However, even in cases where tree encroachment of degraded grasslands leads to increased soil organic carbon, it may come at a high cost since the restoration of grassland-characteristic biodiversity and ecosystem services will be blocked. We assessed how invasion by Prosopis juliflora and restoration of degraded grasslands in a semi-arid region in Baringo, Kenya affected soil organic carbon, biodiversity and fodder availability. Thirty years of grassland restoration replenished soil organic carbon to 1 m depth at a rate of 1.4% per year and restored herbaceous biomass to levels of pristine grasslands, while plant biodiversity remained low. Invasion of degraded grasslands by P. juliflora increased soil organic carbon primarily in the upper 30 cm and suppressed herbaceous vegetation. We argue that, in contrast to encroachment by invasive alien trees, restoration of grasslands in tropical semi-arid regions can both serve as a measure for climate change mitigation and help restore key ecosystem services important for pastoralists and agro-pastoralist communities.
Introduction
Soils are the largest terrestrial carbon reservoir containing more carbon than vegetation and the atmosphere combined1. Moreover, they present a relatively stable carbon stock, as compared to the more transitory carbon stock in woody biomass2. Yet, soil organic carbon (SOC), which makes up about two thirds of global soil carbon3, is sensitive to land degradation4, with significant negative consequences for soil quality and productivity and an exacerbation of greenhouse gas emissions5. Since halting land degradation and restoring degraded soils and their associated services is essential for building agro-ecological systems that meet global development goals6,7, the management of soil resources will have wide-ranging consequences on human well-being for generations to come8.
Grasslands, which comprise approximately 40% of Earth’s natural vegetation9, contain a substantial amount of the world’s SOC10. In addition, they provide habitat for a substantial diversity of animals and plants and support other ecosystem services (ES), including the regulation and storage of water flows, forage for livestock production, and tourism11, thereby contributing substantially to the livelihoods of over one billion of people worldwide12,13. Yet, grasslands are under severe threat from degradation and conversion to other land uses14, which limits their potential to provide these essential services and functions. Degradation of grass-dominated ecosystems and the concomitant loss of SOC and other ES is particularly prevalent in arid and semi-arid regions in Sub-Saharan Africa (SSA) due to a set of interlinked factors, including a growing population, overgrazing, invasion by alien plant species15 and a lack of appropriate policies16 among others.
In response to the program for Reducing Emissions from Deforestation and Forest Degradation (REDD +) and the Kyoto Protocol's Clean Development Mechanism (CDM), afforestation of degraded grasslands has been put forward as a legitimate climate mitigation strategy17,18. Some countries that have commercialized carbon credits under the Kyoto Protocol even consider promoting the cultivation of invasive alien tree species19,20. However, the extent to which afforestation or tree invasions lead to increased soil C stocks depends on prior land use or land cover, climate and the tree species, thus assessments relying on carbon stored from woody plant invasions to balance emissions may be incorrect21. In fact, the expansion of trees or shrubs into grasslands can also lead to a depletion of valuable soil carbon stocks21,22,23. The emphasis on aboveground C stocks may also be due to the fact that most studies on soil carbon restricted their analyses to surface soils (usually upper 15–30 cm), thereby ignoring the potential of grassland soils to store SOC at greater depth24. When deciding on soil carbon management actions, the co-benefits and trade-offs with other ES should be identified and considered to promote ecosystem service multifunctionality25. Even in cases where encroachment by trees in tropical savannas leads to increased C stocks, it may come at a high cost to biodiversity and other ES26,27. Considering the potential of healthy grassland soils to store large amounts of C, an alternative climate mitigation strategy would be to restore degraded grasslands and implement sustainable grazing management28. Because grasslands have greater carbon allocation to root systems than forests, restoration of the former may potentially replenish depleted SOC stocks on degraded land as quickly as encroachment by woody species29.
Here we assessed the impact of grassland degradation and 25–35 years of either encroachment of the invasive alien tree Prosopis juliflora (Sw.) DC (hereafter referred to as Prosopis) or grassland restoration on SOC, biodiversity and herbaceous biomass in Baringo County, a tropical semi-arid region in Kenya. Prosopis, which is native to Central America, was introduced into various countries in Eastern Africa in the 1960s and 1970s in an attempt to combat land degradation and to provide additional services, such as firewood and fodder for livestock30. Soon after its introduction, Prosopis started to spread out from the plantations and to invade surrounding habitats, including grasslands31. We quantified soil organic carbon stocks (down to 1 m belowground), plant species richness and herbaceous biomass in pristine grassland, degraded grassland, grassland moderately and heavily invaded by Prosopis, and in restored grassland in Baringo County. We hypothesized that i) SOC decreases with increasing soil depth but that this pattern varies among land cover types, ii) restoration of grasslands is as effective in carbon sequestration as Prosopis forest, and iii) grassland restoration, in contrast to Prosopis encroachment, also promotes fodder for livestock production and biodiversity, thus avoiding carbon-fodder or carbon-biodiversity trade-offs.
Results
Soil depth and land cover type effects on SOC concentration and SOC per volume
Both SOC concentration (%SOC) and SOC per volume (g C cm-3) were significantly affected by soil depth (%SOC: F3, 174 = 36.63, p < 0.001; SOC per volume: F3, 174 = 37.80, p < 0.0001) and land cover type (%SOC: F4, 58 = 4.82, p = 0.002; SOC per volume: F4, 58 = 6.15, p = 0.003), Fig. 1 and Supplementary Figure S1 online. Moreover, differences in %SOC and SOC per volume across land cover types depended on soil depth (interaction effect %SOC: F12, 174 = 2.26, p = 0.011; interaction effect SOC per volume: F12, 174 = 1.98, p = 0.029; Supplementary Tables S1, S2 online). Land cover type strongly influenced %SOC and SOC per volume in surface soils (0–30 cm: F4, 58 = 7.72, p < 0.001) and to a lesser extent also in deeper soil layers (31–100 cm: F4, 58 = 3.15, p = 0.021). Highest values for %SOC and SOC per volume in the top layer were found in pristine grassland and Prosopis-high land cover types, while at higher depth the highest values were found in restored and pristine grassland (Supplementary Tables S1, S2 online). Both %SOC and SOC per volume declined with increasing soil depth down to 1 m (Supplementary Figures S2, S3 online). Greatest reductions in %SOC and SOC per volume across depth were observed in Prosopis-high (62% each) and pristine grasslands (54% and 49%, respectively), while the smallest reductions occurred in degraded (26% and 30%, respectively) and restored grasslands (30% and 33%, respectively). Overall, the largest variation in %SOC and SOC per volume across land cover type was found in the surface soils (0–15 cm).

Soil organic carbon concentration (%SOC) for the five land cover types and four soil depth increments. Error bars indicate standard errors. The arrows represent a hypothetical transition from one land cover state to the next over time.
Soil bulk density was strongly affected by land cover type (F4, 58 = 5.11, p = 0.001). It was highest in pristine grasslands, intermediate in restored and degraded grasslands and lowest in Prosopis invaded plots (Table 1). The effect of soil depth on bulk density was not consistent (F3, 174 = 1.55, p = 0.204), but varied among land cover type (interaction effect: F12, 174 = 2.48, p = 0.005; Supplementary Table S3 online). While bulk density in pristine grasslands increased with increasing soil depth, it decreased or showed no consistent trend in the other land cover types (Supplementary Table S3 online).
Total soil organic carbon
When adjusting %SOC to the different depths of soil increments, %SOC figures to one meter depth were highest in pristine grasslands, followed by restored grasslands, and lowest in degraded grasslands (Table 1). Similarly, total SOC to 1 m depth was strongly influenced by land cover type (F4, 58 = 5.53, p < 0.001), with pristine grasslands having the highest total SOC stock (49.76 ± 2.28 t C ha-1), followed by restored grasslands (44.68 ± 3.77 t C ha-1), high Prosopis densities (40.05 ± 1.28 t C ha-1), low Prosopis densities (36.99 ± 2.51 t C ha-1) and degraded grasslands (31.52 ± 3.04 t C ha-1; Fig. 2A). Total SOC in degraded grassland was significantly lower than that in pristine (-37%) and restored grasslands (-29%), while total SOC in both low and high Prosopis densities did not differ from any of the other land cover types (Supplementary Table S4 online).
Plant species richness and land cover-specific indicator species
In the 63 sampled plots comprising the five land cover types, a total of 81 different plant species were recorded. Plant species richness per plot varied significantly among land cover types (F4, 58 = 8.66, p < 0.001). It was approximately twice as high in pristine than in degraded grasslands (Table 1; Fig. 2B). Degraded grassland had lower plant species richness than pristine grasslands and low density Prosopis areas, but did not differ from high density Prosopis and restored areas. Plant species richness in low density Prosopis areas did not differ from that in pristine grasslands (Supplementary Table S5 online).
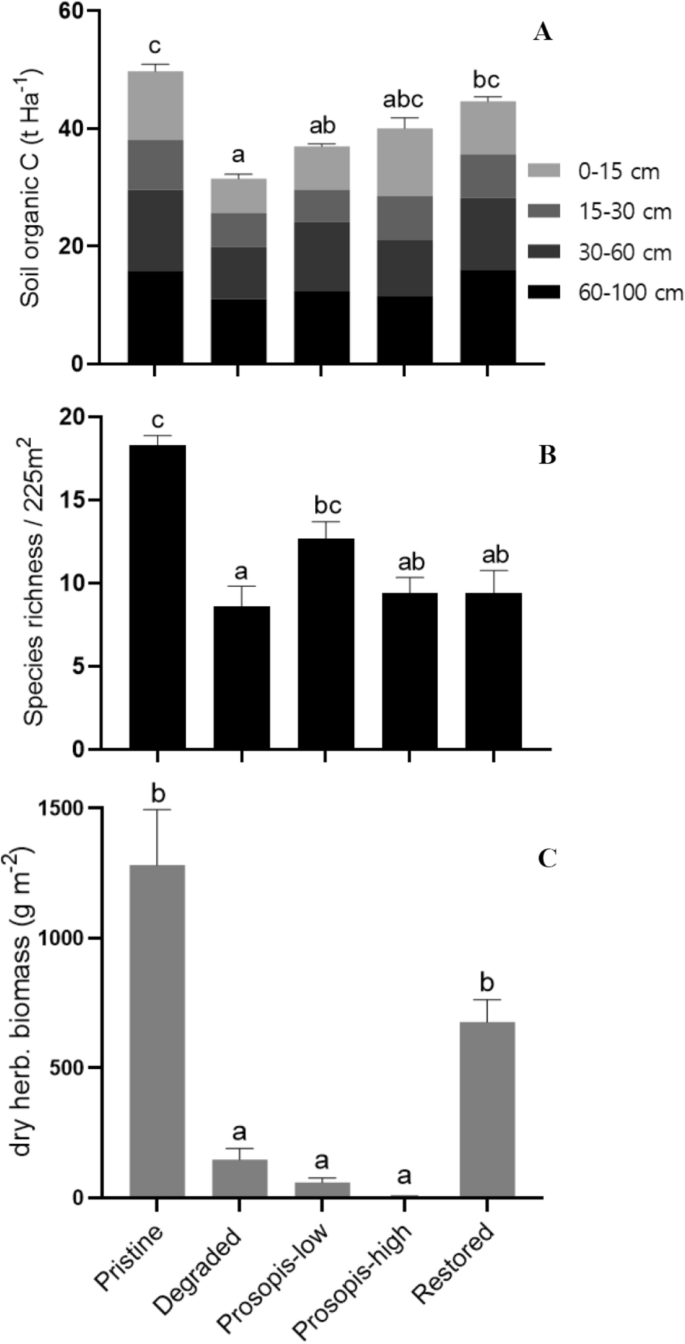
Total soil organic carbon in tonnes per hectare at four soil depth increments from surface to 1 m below ground (A), species richness per plot (225 m2) (B) and dry weight of herbaceous vegetation g m-2 (C), shown for the five land cover types. The error bars indicate standard errors. Land cover types sharing a letter are not significantly different at α = 0.05.
We identified four indicator species that were characteristic of three land cover types in the study area: Portulaca oleracea (degraded grassland), Cynodon dactylon and Waltheria indica (pristine grasslands), and Cenchrus ciliaris (restored grasslands) (Table 2). We did not find any plant species associated with Prosopis invaded areas.
Herbaceous biomass
Dry herbaceous biomass varied significantly among land cover types (F4, 58 = 33.97, p < 0.001). Herbaceous biomass was almost six times higher in pristine grassland than in degraded or lightly invaded areas, and more than 200 times higher than in highly invaded areas (Fig. 2C). Herbaceous biomass in pristine and restored grasslands did not significantly differ from each other (Supplementary Table S6 online).
Discussion
Our results provide evidence that restoration of degraded grasslands in the semi-arid regions of Baringo County, Kenya, is at least as effective in replenishing SOC pools as encroachment by the invasive Prosopis tree. Thirty years of grassland restoration increased SOC pool almost to the level of pristine grasslands. In addition, and in contrast to Prosopis encroachment, grassland restoration also promotes fodder for livestock production, thus avoiding carbon-fodder trade-offs. Recovery of plant species richness requires more time and/or targeted grassland management interventions which promote restoration of the characteristic biodiversity.
Soil organic carbon stocks at depth
As found in other studies assessing SOC at different soil depths29,32,33, both %SOC and SOC per volume decreased with increasing soil depth across all land cover types. The greatest decline in SOC per volume occurred from 0–15 to the 15–30 cm depths, similar to observation made on the Hawaiian Islands33. Nevertheless, in terms of total SOC per ha, our results corroborate other studies in grasslands that show that deeper soils can store substantial amounts of SOC24,29. For example, of the total SOC found in pristine grassland soils, some 59.6% were found between 30 and 100 cm depth. These values closely correspond with Lal et al.34 who estimated that globally, ⁓55% of the SOC to 1 m depth lies below 30 cm depth. Using global data sets of soil profiles, Jobbágy et al.29 estimated that in grasslands the amount of SOC in the second and third meters was some 43% of that in the first meter. The substantial storage of SOC in deeper soils across all land cover types considered in this study underpins the importance of sampling beyond the threshold of 30 cm belowground24,35.
Soil organic carbon under different land cover types
Our estimated total SOC values for pristine and restored grasslands to 1 m depth (49.76 and 44.68 t C ha-1, respectively) are slightly lower than those reported by Adams et al.36 for savanna and thorn scrub and scrub woodland biomes (54 and 60 t C ha-1, respectively), but within the FAO-UNESCO soil unit range of 4.2 – 6.2 kg C m-2 estimated for Xerosols3. The carbon values of Prosopis invaded areas (both in low and high cover areas) were within the range of estimated SOC values for low and dense Prosopis cover in the native range in Texas, USA37.
While long-term variation in organic carbon accumulation in soils largely result from factors affecting climate, geology and soil formation33,36, changes in land use / land cover are at play over shorter periods3,34. For example, plant functional groups with different allocation of photosynthates to above- and belowground plant parts and with different root architecture are known to affect the total amount and the vertical distribution of SOC profiles3,29. Our findings provide evidence that degradation of natural vegetation in the semi-arid parts of Baringo County and re-establishment of vegetation have led to major changes in total SOC stocks and SOC profiles to 1 m depth. First, total SOC stock in degraded grasslands was 37% lower than that in pristine grasslands. This value is considerably higher than that reported in a worldwide review by Dlamini et al.4 for degraded grasslands in arid and semi-arid regions (-16%), but studies in South Africa revealed losses of SOC stocks which were comparable or even higher than those reported in our study. For example, Dlamini et al.4 found a 79% SOC loss in grasslands in KwaZulu-Natal Province with < 5% vegetation cover and a 42% SOC loss in grasslands with < 50% cover, while Baer et al.38 reported a 56% loss in total SOC due to cultivation of grasslands in the South African Highveld. Based on field data collected in Serengeti National Park, Tanzania, Ritchie39 modelled the effect of grazing intensity on SOC and predicted that SOC increases at intermediate grazing intensity but then declines rapidly at the highest grazing intensities. We attribute our lower SOC levels in degraded grasslands largely to the grazing pressure by livestock, because in our study area, grazing pressure is above the threshold where SOC is expected to decline rapidly (see below).
The other significant difference among land cover types in total SOC stocks was between degraded and restored grasslands. Notably, 30 years of grassland restoration led to an increase in SOC in all soil depth increments, including the depth increment at 60–100 cm. At the COP21, the ‘4 per 1000 – Soils for Food Security and Climate’ initiative was launched to promote mitigation of climate change through the annual increase in soil organic carbon by 0.4% in the top 30–40 cm of agricultural, grasslands, pastures and forest soils40,41. The difference between degraded and 30 years old restored grasslands in our study area correspond to an average annual increase in total SOC of 1.4% ([SOC in restored grasslands – SOC in degraded grasslands]/years since restoration started) in both the top 30 cm as well as in the top meter, which is significantly above the goal of the ‘4 per 1000′ initiative. Our higher values of annual increase are in line with the findings by Corbeels et al.42, that SOC storage rates under conservation agriculture and multistrata agroforestry systems are actually higher than the set goal of 0.4%. Increases in SOC due to restoration of degraded grasslands in semi-arid and arid regions of Africa have also been reported by Chaplot et al.43 (33% increase within two years of livestock exclosure and NPK fertilization in KwaZulu-Natal Province of South Africa) and by Oduor et al.44 (27% increase in 3 to > 20 years old grassland exclosures in West Pokot County, Kenya). It is notable that seventeen of the twenty countries in the world with more than 70% of grassland area are found in Sub-Saharan Africa11 and nearly a quarter of sub-Saharan Africa contains land classified as ‘severely degraded’45. Thus, while grasslands in semi-arid and arid regions may have a lower potential to sequester SOC than wetlands when expressed on a per-unit-area basis41, sustainable grassland management is likely to play a key role for SOC storage in Sub-Saharan Africa due to the very large area of this ecosystem and thus for climate change mitigation. For example, assuming an accumulation rate of SOC of 1.4% (as estimated for the restored grasslands in this study), the restoration of the currently over 8,500 ha of severely degraded land in the Njemps Flats, Baringo County, would translate into an annual sequestration of C of approx. 3,700 tons C over the next 30 years.
The Prosopis-low and the Prosopis-high cover areas had intermediate levels of total SOC stocks which neither differed significantly from those of pristine and restored grasslands nor from those of degraded grasslands. The fact that SOC stocks in pristine and in restored grasslands tended to be even higher than those in Prosopis invaded sites may at least partly be attributed to the fact that grassland soils have organic matter levels at least twice as high as forests because grassland biomes add organic matter to topsoil from both roots and above-ground resulting from annual die back46. The grasses Cynodon dactylon and Cenchrus ciliaris, which were indicative of pristine and restored grasslands, respectively, are known for having deep root systems extending up to 2 m into the soil profile47,48. In particular, C. ciliaris, one of the grasses sown in the Rehabilitation of Arid Environments Charitable Trust (RAE Trust) grassland restoration project, is reported to build 60–100 cm long roots within 4–16 months after seeding49.
Studies in the native and in the invaded range revealed that the effect of encroachment by woody species like Prosopis on SOC is context-dependent. Jackson et al.21 and Mureva et al.50 found a negative relationship between precipitation and changes in SOC content when grasslands were invaded by woody vegetation, with drier sites gaining and wetter sites losing SOC. Due to the fact that overall losses of SOC at the wetter sites were substantial enough to offset increases in plant biomass carbon, Jackson et al.21 suggested that assessments relying on carbon stored from woody plant invasions to balance emissions may be incorrect. Our study provides evidence that the effect of Prosopis encroachment on SOC is also context-dependent. If Prosopis invades already degraded ecosystems, then it tends to increase SOC, particularly in the top 30 cm. In contrast, if Prosopis invades pristine or restored grasslands, it is likely to have no or potentially even a negative effect on SOC. Encroachment of grasslands by Prosopis leads to increased C stored in above-ground plant biomass, but plant biomass C in Prosopis invaded ecosystems is lower than the SOC pool in the upper 30 cm of the soil and considerably lower than the SOC pool down to 1 m (Fig. 2; Supplementary Table S7 online)51. Moreover, plant biomass C stocks are more vulnerable to loss from fire, biomass harvesting and other disturbances52,53. It is noteworthy that the sum of SOC and above-ground C of Prosopis-high cover plots does not exceed that of pristine grasslands.
In contrast to pristine and restored grasslands, Prosopis encroachment, which occurred in Baringo often in already degraded land, primarily accumulated SOC in the top 30 cm, which represents 65% and 55% of the total SOC in Prosopis-high cover and Prosopis-low cover plots, respectively. This effect can be explained by the fact that Prosopis exhibits two rooting systems – the main taproot and a dense network of extensive lateral roots54. In mature Prosopis trees, the main taproot is associated with a high number of smaller roots at a depth of approximately 1 m54, while the lateral roots are concentrated in the upper 30 cm of the soil profile55.
Grassland management to create synergies between carbon sequestration, biodiversity and ecosystem services
The multiple values of grassland ecosystems to humanity have long been recognised, ranging from direct benefits of agricultural production to indirect ES such as the regulation of climate and water quality, the provision of plants for medicinal purposes and pollination services11, among others. As such, grasslands are arguably one of the most valuable biomes for ecosystem service provision, but they are also among the most threatened by anthropogenic activities56. Many of the world’s grasslands are being lost due to land use change or degraded by poor grazing management or invasive species, thereby undermining their capacity to support biodiversity and provide ES18.
In Baringo County, human population growth, land use changes and unsustainable grazing management, combined with communal land tenure system and a lack of enforcement of land use rights, have led to large-scale degradation of grasslands and other ecosystems, with serious consequences for biodiversity and the provisioning of multiple ES57,58,59. Prosopis was planted at multiple sites in Baringo to mitigate the challenges of desertification, including sand storms, and to provide services such as wood and fodder for livestock60. However, Prosopis started to escape from the plantations and to invade degraded land as well as cropland, semi-natural ecosystems and protected areas in the surroundings, and this invasion process is ongoing in Baringo31 as well as in other parts of Sub-Saharan Africa61. In both Baringo, Kenya and Afar Region, Ethiopia, over 30% of the grasslands present in the mid-1980s have disappeared and are now covered by Prosopis31,62. Prosopis is a so-called transformer species63 i.e. it can also invade undisturbed habitats64. However, the rapid invasion in Eastern Africa is likely to be further promoted by land degradation as well as by regular and seasonal migration of livestock and severe flooding events, which both contribute to seed dispersal31. Climate change effects such as increasing frequencies of drought events may further accelerate Prosopis invasion since their deep-reaching roots allow them to tap groundwater in areas where most native species cannot65. Also, rising atmospheric carbon dioxide levels have been shown to promote the growth of woody C3 plants over C4 grasses in the African savannas66,67, but their impact on Prosopis invasion remains to be elucidated.
The challenge for sustainable land management in Baringo and other parts of the semi-arid and arid land in Sub-Saharan Africa is to restore ecosystem multifunctionality25 to cover the needs of the stakeholders benefitting from healthy ecosystems. However, there are potential trade-offs between certain ES and biodiversity, or among ES. Carbon mitigation programs that promote forest cover in tropical grasslands and savannas cannot be assumed to provide net benefits for conservation or the provision of ecosystem multifunctionality19,20. For example, Abreu et al.26 showed that fire suppression in savannas of the Brazilian Cerrado increased carbon stocks but was associated with acute biodiversity loss. Similarly, encroachment of degraded tropical grasslands in Baringo by Prosopis increases carbon stocks and the availability of wood, but it threatens biodiversity across multiple trophic levels64, increases mosquito densities68, reduces the provisioning of herbaceous fodder for grazers69 and water65,70 and negatively affects tourism71 and limits access to water points, pasture, croplands and fishing grounds72. In arid and semi-arid regions, the high water consumption by Prosopis is of particular concern, as it decreases the groundwater recharge and thus seriously affects the water available to households in invaded ecosytems65. While Prosopis trees may provide pods for livestock feed, they should only be used as a fodder supplement and thus cannot replace the loss of native forage plants73.
Our results provide evidence that the replenishment of the SOC stocks through restoration of degraded grasslands can be achieved within 20–30 years and does not lead to multiple trade-offs with biodiversity or ES. Restoration of grasslands also increased fodder almost to the level of pristine grasslands, a key ecosystem service for the many pastoralist and agro-pastoralist communities inhabiting grasslands in Sub-Saharan Africa. In line with our findings, Mureithi et al.74, showed that the restored grasslands in Baringo, which were managed as communal enclosures, provide a source of income through the sale of fattened livestock, harvested grass seeds, hay, honey and charcoal, and that total enclosure income increased with time. The extent to which grassland restoration will increase primary productivity and SOC will depend on socio-economic factors, including land tenure systems and enforcement of land use rights, affecting the level and type of grazing management. A report by Byrnes et al.28 showed that grasslands with rotational grazing had SOC stocks higher than those of grasslands with continuous grazing and comparable with those of grasslands with no grazing. Moreover, and in contrast to encroachment by Prosopis or other woody invasive species, restoration of grasslands does not reduce availability or accessibility of surface or ground water65,70 and thus does not exacerbate effects of climate change on semi-arid or arid ecosystems.
In Baringo, 30 years of grassland restoration was not sufficient to restore plant species richness. This may be partly due to the long history of land degradation in the study area75 and a likely depletion of the soil seed bank. In Afar Region, Ethiopia, experimental studies to restore grasslands after removal of Prosopis led to the establishment of species-rich communities within a few years (B. Megersa, unpubl. results). Restoration of high plant diversity may considerably increase carbon capture and storage rates on degraded and abandoned land76. Thus, in order to accelerate the restoration of species-rich plant communities, particularly on land with a long degradation history, reseeding of a diverse set of native species should be considered. Areas with low Prosopis invasion tended to have a higher species richness than degraded, restored and areas with high Prosopis invasion. At low densities, Prosopis trees may provide shade for annual plants to grow underneath their canopy. Annual plants do not, however, provide the same ES as perennial plants, e.g. the bunch grass Cenchrus ciliaris, as they do not build up extensive below-ground biomass and the above-ground biomass dries up soon after the rains stop. Furthermore, Prosopis is highly prolific hence cover densities transition rapidly which suppresses the understory vegetation. Plant species richness in Prosopis-invaded habitats drops to very low levels once Prosopis has reached 50% cover64, which has been attributed to competitive exclusion of the slow-growing shade-intolerant herbaceous savanna species by Prosopis, either due to its allelopathic effects or through competition for water during the dry seasons77.
Conclusions
The importance of managing grasslands to optimise carbon sequestration for climate change mitigation is widely recognised24. Our findings provide evidence that grassland degradation depletes SOC stocks to 1 m depth, but that restoration of degraded grasslands has the potential to replenish SOC stocks at a rate higher than targeted by international initiatives such as the ‘4 per 1000′ initiative. Moreover, refilling of the SOC stocks through restoration of grasslands does not come at the expense of the productivity at the herbaceous layer and numerous other ecosystem services necessary to meet the demands of local (agro-)pastoralists and other stakeholders. Encroachment of degraded semi-arid grasslands by Prosopis increased the availability of wood and can also refill C stocks, but primarily in the upper 30 cm and at the expense of fodder for livestock and numerous other ecosystem services, including water availability65,70. We therefore propose that efforts to reverse land degradation in Baringo and other parts of Sub-Saharan Africa should consider restoration of historical grasslands and their associated ecosystem services and their sustainable embedding in a mosaic of other ecosystems, e.g. shrubland and forests consisting of non-invasive woody species78.
Methods
Study area
The study was conducted in the semi-arid lowlands (Njemps Flats) of Baringo County, located along the Great Rift Valley system in Kenya (Fig. 3). The study area extends from latitude 0° 10′ N to 0° 50′ N and longitude 35° 20′ E to 36° 20′ E, covering an area of approximately 180,000 ha. The Njemps Flats are slightly undulating, with an average altitude of 700 m a.s.l. They are surrounded by Laikipia Escarpment on the east and Tugen Hills and Elgeyo Escarpment on the west, ridges and plateaus of the Lake Baringo catchment with peaks of over 3000 ma.s.l79. The average annual temperature and precipitation are 24.6 °C and 671 mm, respectively80. Presently, the vegetation is predominantly a woody mixture of indigenous and exotic species. It ranges from Vachellia-dominated deciduous shrubland on the valley floor to the evergreen forests in the highlands52. Prosopis currently dominates the lowland flats, the shores of Lake Baringo and further southwards to Lake Bogoria`s western shoreline31,79. Historically, the lowland flats consisted of a mosaic of grasslands and Vachellia-dominated savanna81. The study area is essentially a rangeland with few isolated pockets of dryland subsistence agriculture and small-scale irrigation in Marigat79. The major social-economic activities are livestock production, and bee-keeping, and more recently charcoal production82. A more detailed description of the study area is provided by Mbaabu et al.31.
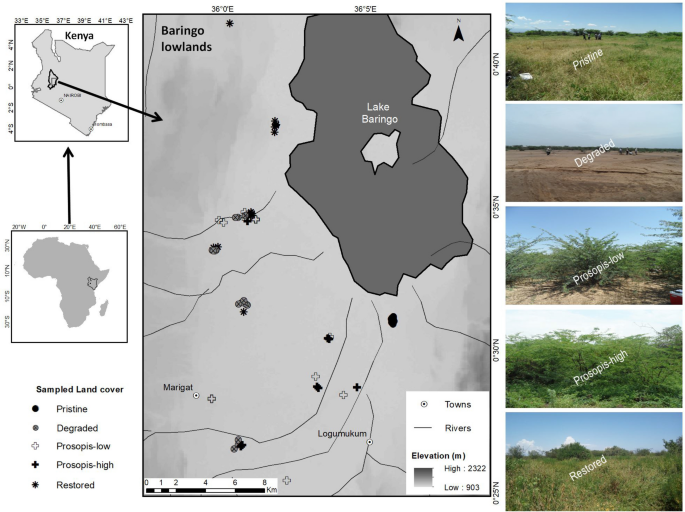
available at https://earthexplorer.usgs.gov/. The two inset maps on the left for Kenya and Africa were generated using GIS data downloaded from World Resources Institute (www.wri.org) and ESRI (www.arcgis.com) respectively. The map was designed using ArcMap version 10.2.2.
Overview of Baringo lowlands (Njemps Flats) in Kenya, the location of the sampled plots and sample photos for each land cover type. The large map (middle), is displayed on a digital elevation model generated by the Shuttle Radar Topography Mission (SRTM), provided by United States Geological Survey (USGS)
During the last 300 years, Baringo has experienced severe land degradation, particularly in the lowland areas57,58,59,83. This problem was further exacerbated by rapid accumulation of livestock by resident households from 1900 onwards57. Over the centuries, the situation remained unchanged, eventually culminating in acute scarcity of basic ecosystem goods and services15. This prompted the introduction of Prosopis species in these lowland areas between 1982 and 1983 through the Fuelwood Afforestation Extension Project60 to mitigate firewood scarcity and desertification60. Due to its invasive nature, Prosopis rapidly spread from the initial plantations to the surrounding areas and currently covers over 18,000 ha of land, of which more than 5000 ha used to be barren land at the time Prosopis was introduced in Baringo County31. This tree has also encroached some previously productive land such as grasslands, croplands and other native vegetation with adverse implications for biodiversity and rural livelihoods31. For instance, the current estimate of the remaining patches of pristine grassland is about 21 ha, while it covered approximately 7000 ha in the mid-1980s31.
In parallel, grassland restoration programmes by reseeding degraded land with native grass species were initiated in the early 1980s84,85. The RAE Trust works with the local pastoralist community to reclaim degraded semi-arid land for more sustainable livelihoods86.Currently, over 4,850 ha of degraded land in Baringo lowlands have been put under restoration, of which more than 1,600 ha87 are located within the study area.
Baringo lowland is characterised by complex soils with diverse textures and drainage conditions which have developed into alluvial deposits79. Its geological products are a result of past tectonic events of faulting, warping and volcanic eruptions associated with the formation of the Rift Valley. The major soil types present are clay, loam, silt and sand79. Soil sampling across all land cover types was done in relatively loamy soils as this category generally supports most vegetative growth.
Experimental design and selection criteria for sampling plots
Five land use/cover types representing common earth cover and distinct land use activities within the study area were identified, namely pristine grasslands, degraded grasslands, Prosopis-low (low cover), Prosopis-high (dense cover) and restored grasslands (reference photos in Fig. 3). The choice of these land cover types, their categorization and definitions were based on time, events in history and physical characteristics as informed by expert judgement, literature and field observations. We achieved this through consultations with village leaders, farmers, pastoralists, land-owners and conservationists regarding the happenings and changes in the area since 1950s or before. Reference is made to around 1950s because the region suffered a catastrophic drought – an aftermath of prolonged rainfall failure following the usual seasonal bushfires that occur in savannas and rangelands88. Coupled with stocking and grazing by pastoralists, large parts of the study area have become severely degraded59,83.
The five different land cover types were classified as follows: i) pristine grasslands with > 80% grass cover and a history of predominant grass cover for over 70 years; ii) degraded grasslands, i.e. areas with predominantly barren ground for over 70 years; iii) restored grasslands, some 25–35 years old; iv) Prosopis-invaded areas with < 30% Prosopis cover; and v) Prosopis-invaded areas with > 80% Prosopis cover. Prosopis-low and Prosopis-high were invaded some 10–15 years and 25–35 years ago, respectively. Pristine grasslands were characterized by a long history of grass cover, moderate grazing intensity and comprised a mixture of indigenous grasses and shrubs. They were moderately grazed because historically, the pastoralists reserved them as dry season grazing areas and hence carefully regulated grazing during critical seasons85. Restored grasslands were barren land which was originally re-seeded with a variety of native grass species, namely; Cenchrus ciliaris (L).89, Enteropogon macrostachyus (Hochst. ex A. Rich.) Munro ex Benth.90, Eragrostis superba (Peyr).91, Cymbopogon pospischilii (K. Schum.) C.E. Hubb.92 and Sehima nervosum (Rottler) Stapf93, and experienced moderate grazing pressure, coupled with seasonal harvesting of grass seeds and above-ground biomass. Most of the grass species used are among those recommended by Bogdan and Pratt94 for reseeding degraded lands in Kenya. All restored grasslands sites were protected from unauthorised grazing by solar-powered electric fencing. Degraded grasslands were areas with largely barren soil and the plots were selected from communal grazing areas which markedly suffered from severe droughts in the periods before and during the 1950s, 196595,96,97 and later; and have been unsustainably grazed over time. Prosopis-invaded areas were previously degraded grassland and the plots for Prosopis-high were selected in areas with the longest history of invasion in the study area, i.e. since the 1980s or early 1990s31. We sampled areas with a cover of below 30% and above 80% for plots with a low and high level of Prosopis invasion, respectively. These Prosopis cover thresholds were determined using a Prosopis fractional cover map for the study area (Mbaabu et al., unpublished results).
Field sampling and laboratory analysis
A preliminary assignment of sites within the study region to the five land cover types was made based on a recently published land use/land cover map. The final decision whether a pre-selected site was sampled or not was taken after inspection of the site in the field and consultation with local people. The selected sites of all land cover types were located in the same geographic region with similar topography, elevation and edaphic characteristics. The patchy distribution of the land cover types in Baringo enabled us to select replicates of the categories that were spatially well interspersed (Fig. 3).
At each selected site, one plot of 15 × 15 m was randomly selected and geo-referenced. Within the pristine and the restored grassland sites, plots were randomly established in areas with contiguous, undisturbed grass cover (i.e. driveways or gullies were excluded) and with a minimum distance of 30 m away from a native tree and 50 m from a Prosopis tree or thicket if present. In total, soil samples, plant species richness and herbaceous biomass were analysed in 63 plots (pristine grassland: 10, degraded grassland: 16, Prosopis-low: 12, Prosopis-high: 10, restored grassland:15; Fig. 3). Soil sampling was carried out during the dry season (September–November 2017 & 2018). Sampling during the non-growing season minimizes the influence of plant type and growth stage on SOC, particularly in soil carbon fractions that turn over rapidly98. Plant diversity and herbaceous biomass sampling occurred during the second half of a wet season at plant peak biomass (April-July 2017 & 2018).
The plot design and sampling procedure for all the variables is described in Linders et al.64. In brief, each 15 × 15 m plot was divided into nine 5 × 5 m subplots and samples taken from five out of the nine subplots (the four corner subplots and the centre subplot). One of these five subplots was randomly excluded from sampling herbaceous biomass and fenced against livestock grazing in degraded and Prosopis invaded plots. We did not find significant differences in herbaceous biomass between fenced and unfenced subplots (TEW Linders, unpublished data). To measure soil organic carbon (SOC), a soil pit was dug incrementally in the centre of each of the corner subplots, from which 4 independent soil cores were taken at the following depth increments: 0–15 cm, 15–30 cm, 30–60 cm and 60–100 cm99. For bulk density, a soil pit was dug incrementally in the centre subplot, outside of the fenced area if applicable, and three soil cores taken from three different sites of the same soil pit at each of the same depth increment. Species richness was assessed at the plot level. Herbaceous vegetation (anything growing 2 cm above-ground) samples were harvested from a patch area of 25 × 50 cm of each of the four subplots, pooled together per plot, and oven-dried to determine dry weight64. Herbaceous biomass samples were analysed at the Kenya Forestry Research Institute (KEFRI-Nairobi) and the soil samples at the Kenya Agricultural and Livestock Research Organization (KALRO-Kenya). SOC was determined using the colorimetric method100. Bulk density samples were oven-dried, weighed and measured using the procedure described by Klute101. Bulk density was used to convert the SOC concentration to ecosystem estimates of organic carbon stocks per unit area or soil volume.
Statistical analysis
All data were analyzed using R102, version 3.6.3. We checked for normality and homogeneity using Shapiro–Wilk`s tests and by visual inspections of residuals against fitted values and histograms. Data that violated basic model assumptions were log-transformed prior to the analysis. To assess the effect of soil depth on percent SOC and on SOC per volume soil (g cm-3) across land cover types, we fitted linear mixed effect model using the lme function within the nlme package103. We included land cover, soil depth and the interaction of land cover and soil depth as fixed effects in the model, and plot as random factor. Differences between the means among land cover types and soil depths were evaluated with Tukey`s HSD Post-hoc test on the model`s least square means. To assess land cover effects on SOC down to 1 m depth, species richness and herbaceous biomass, we applied general linear models with land cover type as fixed effect, followed by Tukey`s HSD Post-hoc test. Estimates of SOC stocks per unit area (t C ha-1) were computed using the formula: SOC t ha-1 = %SOC x BD (g cm-3) x d (cm), where %SOC = carbon concentration of the sample, BD = bulk density in g cm-3, and d = height of the depth increment (cm)98,104. Total carbon stocks down to 1 m depth were then obtained by summing up the SOC tons per hectare values estimated for each depth increment24,105. To determine which species are characteristic for the different land cover types, we conducted an indicator species analysis test using the labdsv package.
When presenting and discussing the results, we adopted a hypothetical, but in the case of Baringo County realistic scenario that pristine grasslands became first degraded and then either were invaded by Prosopis or restored. It should be noted that Prosopis can also invade pristine grasslands61, but historically the majority of the pristine grasslands in Baringo were already degraded at the time Prosopis started to spread.
Data availability
The datasets generated and/or analysed during the current study are available from the corresponding author on reasonable request.
References
FAO. Soil Organic Carbon: the hidden potential (eds. Liesl, W., Viridiana, A., Rainer, B. & Ronald, V.) ISBN 978–92–5–109681–9 (FAO, 2017).
Doney, S. C., Lindsay, K., Fung, I. & John, J. Natural variability in a stable, 1000-yr global coupled climate-carbon cycle simulation. J. Clim. 19, 3033–3054. https://doi.org/10.1175/JCLI3783.1 (2006).
Batjes, N. H. Total carbon and nitrogen in the soils of the world. Eur. J. Soil Sci. 65, 4–21 (1996).
Dlamini, P., Chivenge, P., Manson, A. & Chaplot, V. Land degradation impact on soil organic carbon and nitrogen stocks of sub-tropical humid grasslands in South Africa. Geoderma 235–236, 372–381. https://doi.org/10.1016/j.geoderma.2014.07.016 (2014).
IUCN. Land Degradation and Climate Change: The multiple benefits of sustainable land management in the drylands. In The twenty-first session of the Conference of the Parties (COP) and the eleventh session of the Conference of the Parties serving as the meeting of the Parties to the Kyoto Protocol (CMP) took place from 30 November to 11 December 2015, in Paris, France, (2015).
UNCCD. The United Nations Convention to Combat Desertification. https://www2.unccd.int/convention/about-convention. Accessed 12/04/2017, (UNCCD, 2017).
UNDP. Open Working Group Proposal for Sustainable Development Goals. https://sustainabledevelopment.un.org/focussdgs.html. Accessed 12/04/2017, (2015).
IFPRI. Economics of Land Degradation and Improvement: A Global Assessment for Sustainable Development ( eds. Nkonya, E., Mirzabaev, A. & von Braun, J.) Cham, Switzerland, https://sustainabledevelopment.un.org/focussdgs.html (IFPRI, 2016).
Ramankutty, N., Evan, A. T., Monfreda, C. & Foley, J. A. Geographic distribution of global agricultural lands in the year 2000. Cycles. 22(GB1003), 2008. https://doi.org/10.1029/2007GB002952 (2000).
Conant, R. T., Cerri, C. E. P., Osborne, B. B. & Paustian, K. Grassland management impacts on soil carbon stocks: a new synthesis. Ecol. Appl. 27, 662–668. https://doi.org/10.1002/eap.1473 (2017).
White, R. P., Murray, S. & Rohweder, M. Pilot Analysis of Global Ecosystems: Grassland Ecosystems (ed. Edeburn, M.) 28–37, World Resources Institute, (2000).
Bai, Z. G., Dent, D. L., Olsson, L. & Schaepman, M. E. Proxy global assessment of land degradation. Soil Use Manag. 24, 223–234. https://doi.org/10.1111/j.1475-2743.2008.00169.x (2008).
Conant, R. T. Challenges and Opportunities for Carbon Sequestration in Grassland Systems: A Technical Report on Grassland Management and Climate Change Mitigation (FAO, Geneva, 2010).
Gibbs, H. K. & Salmon, J. M. Mapping the world’s degraded lands. Appl. Geogr. 57, 12–21. https://doi.org/10.1016/j.apgeog.2014.11.024 (2015).
Mulinge, W. et al. Economics of land degradation and improvement in Kenya. In Economics of Land Degradation and Improvement – A Global Assessment for Sustainable Development; (eds. Nkonya, E., Mirzabaev, A. & von Braun, J.). Springer International Publishing: Cham, pp 471–498; https://doi.org/https://doi.org/10.1007/978-3-319-19168-3_16 (2016).
Nkonya, E., Johnson, T., Kwon, H. Y. & Kato, E. Economics of land degradation in Sub-Saharan Africa. In: Economics of Land Degradation and Improvement – A Global Assessment for Sustainable Development (eds. Nkonya, E., Mirzabaev, A., & von Braun, J.) Springer International Publishing: Cham, pp 215–259; https://doi.org/https://doi.org/10.1007/978-3-319-19168-3_9 (2016).
Law, E. A., Bryan, B. A., Torabi, N., Bekessy, S. A., McAlpine, C. A. & Wilson, K. A. Measurement matters in managing landscape carbon. Best Pract. Mapp. Ecosyst. Serv. 13 (Supplement C), 6–15; https://doi.org/https://doi.org/10.1016/j.ecoser.2014.07.007 (2015).
Parr, C. L., Lehmann, C. E. R., Bond, W. J., Hoffmann, W. A. & Andersen, A. N. Tropical grassy biomes: misunderstood, neglected, and under threat. Trends Ecol. Evol. 29, 205–213. https://doi.org/10.1016/j.tree.2014.02.004 (2014).
Chisholm, R. A. Trade-offs between ecosystem services: water and carbon in a biodiversity hotspot. Ecol. Econ. 69, 1973–1987. https://doi.org/10.1016/j.ecolecon.2010.05.013 (2010).
Dickie, I. A. et al. Conflicting values: ecosystem services and invasive tree management. Biol. Invasions. 16, 705–719. https://doi.org/10.1007/s10530-013-0609-6 (2014).
Jackson, R. B., Banner, J. L., Jobbágy, E. G., Pockman, W. T. & Wall, D. H. Ecosystem carbon loss with woody plant invasion of grasslands. Nature 418, 623–626. https://doi.org/10.1038/nature00910 (2002).
Conant, R. T. & Paustian, K. Potential soil carbon sequestration in overgrazed grasslands ecosystems. Global Biogeochem. Cycles. 16, 1143. https://doi.org/10.1029/2001GB001661 (2002).
Jackson, R. B. et al. The ecology of soil carbon: pools, vulnerabilities, and biotic and abiotic controls. Annu. Rev. Ecol. Evol. Syst. 48(1), 419–445. https://doi.org/10.1146/annurev-ecolsys-112414-054234 (2017).
Ward, S. E., Smart, S. M., Quirk, H., Tallowin, J. R. B. & Mortimer, S. R. Legacy Effects of Grassland Management on Soil Carbon to Depth. Manag. Deep Soil Carbon. Glob. Change Biol. 22, 2929–2938; DOI: https://doi.org/10.1111/gcb.13246 (2016).
Manning, P. et al. redefining ecosystem multifunctionality. Nat. Ecol. Evol. 2, 427–436. https://doi.org/10.1038/s41559-017-0461-7 (2018).
Abreu, R. C. R. et al. The biodiversity cost of carbon sequestration in tropical savanna. Sci. Adv. 3, e1701284; https://doi.org/https://doi.org/10.1126/sciadv.1701284 (2017).
Veldman, J. W. et al. Where tree planting and forest expansion are bad for biodiversity and ecosystem services. Bioscience 65, 1011–1018. https://doi.org/10.1093/biosci/biv118 (2015).
Byrnes, R. C., Eastburn, D. J., Tate, K. W. & Roche, L. M. A global meta-analysis of grazing impacts on soil health indicators. J. Environ. Qual. 47, 758–765. https://doi.org/10.2134/jeq2017.08.0313 (2018).
Jobbágy, E. G. & Jackson, R. B. The vertical distribution of soil organic carbon and its relation to climate and vegetation. Ecol. Appl. 10, 423–436. https://doi.org/10.1890/1051-0761(2000)010[0423:TVDOSO]2.0.CO;2 (2000).
Schwartzstein, P. An Invasive, Thorny Tree Is Taking over Africa—Can It Be Stopped? (National Geographic, Washington, 2019).
Mbaabu, P. R. et al. Spatial evolution of prosopis invasion and its effects on LULC and livelihoods in Baringo Kenya. Remote Sens. 11, 1217. https://doi.org/10.3390/rs11101217 (2019).
Bhojvaid, P. P. & Timmer, V. R. soil dynamics in an age sequence of Prosopis Juliflora planted for sodic soil restoration in India. For. Ecol. Manag. 106, 181–193. https://doi.org/10.1016/S0378-1127(97)00310-1 (1998).
Torn, M. S., Trumbore, S. E., Chadwick, O. A., Vitousek, P. M. & Hendricks, D. M. Mineral control of soil organic carbon storage and turnover. Nature 389, 170–173. https://doi.org/10.1038/38260 (1997).
Lal, R. Digging deeper: a holistic perspective of factors affecting soil organic carbon sequestration in agroecosystems. Glob. Change Biol. 24, 3285–3301. https://doi.org/10.1111/gcb.14054 (2018).
Gross, C. D. & Harrison, R. B. The case for digging deeper: soil organic carbon storage, dynamics, and controls in our changing world. Soil Syst. 3, 28. https://doi.org/10.3390/soilsystems3020028 (2019).
Adams, J. M., Faure, H., Faure-Denard, L., McGlade, J. M. & Woodward, F. I. Increases in terrestrial carbon storage from the last glacial maximum to the present. Nature 348, 711–714. https://doi.org/10.1038/348711a0 (1990).
Geesing, D., Felker, P. & Bingham, R. L. Influence of mesquite (Prosopis Glandulosa) on soil nitrogen and carbon development: implications for global carbon sequestration. J. Arid Environ. 46, 157–180. https://doi.org/10.1006/jare.2000.0661 (2000).
Baer, S. G., Bach, E. M., Meyer, C. K., Du Preez, C. C. & Six, J. Belowground ecosystem recovery during grassland restoration: south african highveld compared to US tallgrass prairie. Ecosystems 18, 390–403. https://doi.org/10.1007/s10021-014-9833-x (2015).
Ritchie, M. E. Plant compensation to grazing and soil carbon dynamics in a tropical grassland. PeerJ. 2, e233. https://doi.org/10.7717/peerj.233 (2014).
4p1000. What Is the “4 per 1000” Initiative, (2018).
Minasny, B. et al. Soil carbon 4 per mille. Geoderma 292, 59–86. https://doi.org/10.1016/j.geoderma.2017.01.002 (2017).
Corbeels, M., Cardinael, R., Naudin, K., Guibert, H. & Torquebiau, E. The 4 per 1000 goal and soil carbon storage under agroforestry and conservation agriculture systems in Sub-Saharan Africa. Soil Tillage Res. 188, 16–26. https://doi.org/10.1016/j.still.2018.02.015 (2019).
Chaplot, V., Dlamini, P. & Chivenge, P. Potential of grassland rehabilitation through high density-short duration grazing to sequester atmospheric carbon. Geoderma 271, 10–17. https://doi.org/10.1016/j.geoderma.2016.02.010 (2016).
Oduor, C. O. et al. Enhancing soil organic carbon, particulate organic carbon and microbial biomass in semi-arid rangeland using pasture enclosures. BMC Ecol. 18, 45. https://doi.org/10.1186/s12898-018-0202-z (2018).
Vågen, T. G., Lal, R. & Singh, B. R. Soil carbon sequestration in Sub-Saharan africa: a review. Land Degrad. Dev. 16, 53–71. https://doi.org/10.1002/ldr.644 (2005).
NRCS. Soil Organic Matter: Soil Quality Kit-Guides for Educators. (United States Department of Agriculture, Washington, 2014).
Mnif, L. & Chaieb, M. Root growth and morphology of four provenances of a perennial grass (Cenchrus Ciliaris L.) in Rhizotron chamber. Acta Bot. Gallica. 156, 273–282; https://doi.org/https://doi.org/10.1080/12538078.2009.10516157 (2009).
CRC Weed Management. Weed Management Guide: Managing Weeds for Biodiversity. Buffel grass-Cenchrus ciliaris. (CRC Weed Manament, 2008).
Mashau, A. C. Cenchrus Ciliaris (2010).
Mureva, A., Ward, D., Pillay, T., Chivenge, P. & Cramer, M. Soil Organic carbon increases in semi-arid regions while it decreases in humid regions due to woody-plant encroachment of grasslands in South Africa. Sci. Rep. 8, 15506. https://doi.org/10.1038/s41598-018-33701-7 (2018).
Birhane, E., Treydte, A. C., Eshete, A., Solomon, N. & Hailemariam, M. Can rangelands gain from bush encroachment? Carbon stocks of communal grazing lands invaded by Prosopis Juliflora. J. Arid Environ. 141, 60–67. https://doi.org/10.1016/j.jaridenv.2017.01.003 (2017).
Mwangi, E. & Swallow, B. Prosopis juliflora invasion and rural livelihoods in the Lake Baringo area of Kenya. Conserv. Soc. 6, 130–140. https://doi.org/10.4103/0972-4923.49207 (2008).
Grace, J., Jose, J. S., Meir, P., Miranda, H. S. & Montes, R. A. Productivity and carbon fluxes of tropical savannas. J. Biogeogr. 33(3), 387–400. https://doi.org/10.1111/j.1365-2699.2005.01448.x (2006).
Heitschmidt, R. K., Ansley, R. J., Dowhower, S. L., Jacoby, P. W. & Price, D. L. Some observations from the excavation of honey mesquite root systems. J. Range Manag. 41, 227. https://doi.org/10.2307/3899173 (1988).
Yoda, K., Elbasit, M. A., Hoshino, B., Nawata, H. & Yasuda, H. Root System development of prosopis seedlings under different soil moisture conditions. J. Arid Land Stud. 4, 13–16 (2012).
Gibson, D. J. Grasses & Grassland Ecology (Oxford University Press, Oxford, 2009).
Anderson, D. M. Agriculture and irrigation technology at Lake Baringo in the nineteenth century. Azania Archaeol. Res. Afr. 24, 84–97. https://doi.org/10.1080/00672708909511400 (1989).
Anderson, D. M. & Bollig, M. Resilience and collapse: histories, ecologies, conflicts and identities in the Baringo-Bogoria Basin Kenya. J. East. Afr. Stud. 10, 1–20. https://doi.org/10.1080/17531055.2016.1150240 (2016).
Johansson, J. & Svensson, J. Land degradation in the semi-arid catchment of Lake Baringo, Kenya. 1–79, Earth Sciences Centre, Göteborg University, Sweden (2002).
Kariuki, P. A Social forestry project in Baringo, Kenya: a critical analysis. Master Thesis, University of Queensland: Brisbane, Australia, (1993).
Shiferaw, H. et al. Implications of land use/land cover dynamics and Prosopis invasion on ecosystem service Values in Afar Region Ethiopia. Sci. Total Environ. 675, 354–366. https://doi.org/10.1016/j.scitotenv.2019.04.220 (2019).
Shiferaw, H. et al. Modelling the current fractional cover of an invasive alien plant and drivers of its invasion in a dryland ecosystem. Sci. Rep. 9, 1576. https://doi.org/10.1038/s41598-018-36587-7 (2019).
Richardson, D. M. et al. Naturalization and invasion of alien plants: concepts and definitions. Divers. Htmlent Glyphamp Asciiamp Distrib. 6(2), 93–107. https://doi.org/10.1046/j.1472-4642.2000.00083.x (2000).
Linders, T. E. W. et al. Direct and indirect effects of invasive species: biodiversity loss is a major mechanism by which an invasive tree affects ecosystem functioning. J. Ecol. 107, 1365–2745.13268; https://doi.org/https://doi.org/10.1111/1365-2745.13268 (2019).
Dzikiti, S. et al. Water relations and the effects of clearing invasive prosopis trees on groundwater in an arid environment in the northern cape South Africa. J. Arid Environ. 90, 103–113. https://doi.org/10.1016/j.jaridenv.2012.10.015 (2013).
Osborne, C. P. et al. Human impacts in african savannas are mediated by plant functional traits. New Phytol. 220(1), 10–24. https://doi.org/10.1111/nph.15236 (2018).
Krajick, K. How Did Africa’s Grasslands Get Started? State of the Planet, 2019.
Muller, G. C. et al. The invasive shrub prosopis juliflora enhances the malaria parasite transmission capacity of anopheles mosquitoes: a habitat manipulation experiment. Malar. J. 16, 237. https://doi.org/10.1186/s12936-017-1878-9 (2017).
Linders, T. E. W. et al. The impact of invasive species on social-ecological systems: relating supply and use of selected provisioning ecosystem services. Ecosyst. Serv. 41, 101055. https://doi.org/10.1016/j.ecoser.2019.101055 (2020).
Le Maitre, D. C. et al. Impacts of plant invasions on terrestrial water flows in Sout Africa. In Biological Invasions in South Africa. Invading Nature: Springer Series in Invasion Ecology; Springer Nature Switzerland AG.: Switzerland, pp 431–457 (2020).
Shackleton, R. T., Le Maitre, D. C., Pasiecznik, N. M. & Richardson, D. M. Prosopis: A global assessment of the biogeography, benefits, impacts and management of one of the world’s worst woody invasive plant Taxa. AoB PLANTS. 6, plu027; https://doi.org/https://doi.org/10.1093/aobpla/plu027 (2014).
Weber, E. Invasive Plant Species of the World: A Reference Guide to Environmental Weeds (CABI PUB, Cambridge, 2003).
Sawal, R. K., Ratan, R. & Yadav, S. B. S. Mesquite (prosopis juliflora) pods as a feed resource for livestock - a review. Asian-Australasian. J. Anim. Sci. 17, 719–725. https://doi.org/10.5713/ajas.2004.719 (2004).
Mureithi, S. M., Verdoodt, A., Njoka, J. T., Gachene, C. K. K. & Van Ranst, E. Benefits derived from rehabilitating a degraded semi-arid rangeland in communal enclosures Kenya. Land Degrad. Dev. 27, 1853–1862. https://doi.org/10.1002/ldr.2341 (2016).
Kimosop, W. et al. Lake Bogoria National Reserve: Integrated Management Plan 2007–2012. County Council of Baringo, County Council of Koibatek and WWF-EARPO; County Council of Baringo: Baringo, Kenya, (2007).
Yang, Y., Tilman, D., Furey, G. & Lehman, C. Soil carbon sequestration accelerated by restoration of grassland biodiversity. Nat. Commun. 10, 718. https://doi.org/10.1038/s41467-019-08636-w (2019).
Hoffmann, W. A. et al. Ecological thresholds at the savanna-forest boundary: how plant traits, resources and fire govern the distribution of tropical biomes. Ecol. Lett. 15, 759–768. https://doi.org/10.1111/j.1461-0248.2012.01789.x (2012).
Cowie, A. L. et al. Land in balance: the scientific conceptual framework for land degradation neutrality. Environ. Sci. Policy. 79, 25–35. https://doi.org/10.1016/j.envsci.2017.10.011 (2018).
Keitany, W. et al. First County Integrated Development Plan 2013 - 2017: Kenya Vision 2030, Towards a Globally Competitive and Prosperous Nation (2013).
Climate-Data.org. MARIGAT CLIMATE (KENYA), available online: https://en.climate-data.org/afrika/kenya/baringo/marigat-104708/, Accessed May 13, 2020.
Mwasi, B. Landscape Change Dynamics in a Semi-Arid Part of Baringo District, Kenya, Based on Landsat-TM Data and GIS Analysis, Universiteit van Amsterdam, IBED, Amsterdam, (2004).
Ng, W.T. et al. Assessing the Potential of Sentinel-2 and Pléiades Data for the Detection of Prosopis and Vachellia Spp. in Kenya. Remote Sens. 9, 74; https://doi.org/https://doi.org/10.3390/rs9010074 (2017).
Kiage, K. B., Liu, K. B., Walker, N. D., Lam, N. & Huh, O. K. Recent land-cover/use change associated with land degradation in the lake baringo catchment, Kenya, East Africa: evidence from landsat TM and ETM+. Int. J. Remote Sens. 28, 4285–4309. https://doi.org/10.1080/01431160701241753 (2007).
Van Cotthem, W. Range Rehabilitation in the Lake Baringo Basin, Kenya, available online: https://desertification.wordpress.com/2012/04/30/range-rehabilitation-using-reseeded-enclosures-in-lake-baringo-basin-kenya/, Accessed May 13, 2020 (2011).
Mureithi, S. M., Verdoodt, A. & Van Ranst, E. Effects and Implications of Enclosures for Rehabilitating Degraded Semi-Arid Rangelands: Critical Lessons from Lake Baringo Basin, Kenya. In: Land Degradationa and Desertification. 111–129 (eds. Zdruli, P.,Pagliai, M., Kapur, S. & Faz Cano, A.) Springer Dordrecht Heidelberg, (2010).
RAE Trust. Rehabilitation of Arid Environments Charitable Trust, available online: https://www.raetrust.org/, Accessed Jan 9, 2020 (2007).
Chabay, I. et al. (eds) Land restoration: reclaiming landscapes for a sustainable future (Elsevier/AP, Academic Press is an imprint of Elsevier, Waltham MA, 2016).
Leys, B. A., Marlon, J. R., Umbanhowar, C. & Vannière, B. Global fire history of grassland biomes. Ecol. Evol. 8, 8831–8852. https://doi.org/10.1002/ece3.4394 (2018).
Cenchrus ciliaris L. in GBIF Secretariat. GBIF Backbone Taxonomy. Checklist dataset; https://doi.org/https://doi.org/10.15468/39omei, Accessed via GBIF.org on 2020–05–27 (2019).
Enteropogon Macrostachyus (Hochst.ex A. Rich) Munro ex Benth. in J.linn.Soc 19, 101 (1881).
Eragrostis superba Peyr. in GBIF Secretariat. GBIF Backbone Taxonomy. Checklist Dataset; https://doi.org/https://doi.org/10.15468/39omei, Accessed via GBIF.org on 2020–05–27 (2019).
Cymbopogon pospischilii (K.Schum.) C.E.Hubb. in GBIF Secretariat. GBIF Backbone Taxonomy. Checklist dataset; https://doi.org/https://doi.org/10.15468/39omei, Accessed via GBIF.org on 2020–05–27 (2019).
Sehima nervosum Stapf in GBIF Secretariat. GBIF Backbone Taxonomy. Checklist dataset; https://doi.org/https://doi.org/10.15468/39omei, ACCESSED via GBIF.org on 2020–05–27 (2019).
Bogdan, A. V. & Pratt, D. J. Reseeding Denuded Pastoral Land in Kenya; Bulletin; Ministry of Agriculture and Animal Husbandry: Kenya, p 63 (1967).
Anderson, D. M. The beginning of time? evidence for catastrophic drought in baringo in the early Nineteenth century. J. East. Afr. Stud. 10, 45–66. https://doi.org/10.1080/17531055.2015.1134532 (2016).
Kiage, L. M. & Liu, K. Palynological evidence of climate change and land degradation in the Lake Baringo Area, Kenya, East Africa, since AD 1650. Palaeogeogr, Palaeoclimatol, Palaeoecol. 279, 60–72. https://doi.org/10.1016/j.palaeo.2009.05.001 (2009).
Little, P. D. The elusive granary: herder, farmer, and state in Northern Kenya, 1st ed.; II; Cambridge University Press: Cambridge, UK; 63, pp. 285–287; DOI: https://doi.org/https://doi.org/10.2307/1160856 (1992).
Hoyle, F. C. Managing soil organic matter: a practical guide. Grains Research & Development Corporation (GRDC); Kingston Act, Australia, (2013).
Don, A., Schumacher, J. & Freibauer, A. Impact of tropical land-use change on soil organic carbon stocks - a meta-analysis: soil organic carbon and land-use change. Glob. Change Biol. 17, 1658–1670. https://doi.org/10.1111/j.1365-2486.2010.02336.x (2011).
Anderson, J. M. & Ingram, J. S. I. Tropical soil biology and fertility: a handbook of methods. J. Ecol. 78, 547. https://doi.org/10.2307/2261129 (1994).
Klute, A. Methods of Soil Analysis, 2nd ed., 1, Agronomy; American Society of Agronomy, Inc: USA, (1986)
R Core Team. R: A Language and Environment for Statistical Computing., R Foundation for Statistical Computing: Vienna, Austria, (2020).
Pinheiro, J., Bates, D., Sarkar, D. & R Core Team. Nlme: Linear and Nonlinear Mixed Effects Models. R Package Version 3.1–147; (2020).
Abdallah, M. A. B., Mata-González, R., Noller, J. S. & Ochoa, C. G. Ecosystem carbon in relation to woody plant encroachment and control: juniper systems in Oregon USA. Agric. Ecosyst. Environ. 290, 106762. https://doi.org/10.1016/j.agee.2019.106762 (2020).
Grüneberg, E., Ziche, D. & Wellbrock, N. Organic carbon stocks and sequestration rates of forest soils in Germany. Glob. Change Biol. 20, 2644–2662. https://doi.org/10.1111/gcb.12558 (2014).
Acknowledgements
This research was funded by the Swiss National Science Foundation (SNSF) and the Swiss Agency for Development and Cooperation (SDC) as part of the Swiss Programme for Research on Global Issues for Development (r4d), for the project “Woody invasive alien species in East Africa: Assessing and mitigating their negative impact on ecosystem services and rural livelihood” (Grant Number: 400440_152085). Urs Schaffner was supported by CABI with core financial support from its member countries (see https://www.cabi.org/about-cabi/who-we-work-with/key-donors/). We specially thank RAE Trust, particularly Mr. Murray Roberts, Dr. Elizabeth Meyerhoff and staff, for allowing data collection on their grassland restoration sites in Baringo. We also thank the Kenya Forestry Research Institute (KEFRI) and the Kenya Agricultural and Livestock Research Organization –KALRO-Kabete for sample analyses.
Author information
Authors and Affiliations
Contributions
P.R.M., U.S., T.E.W.L., S.E. and R.E. designed the experiment, P.R.M. and T.E.W.L. collected the data, S.K.C. provided administrative and fieldwork logistical support, P.R.M. and R.E. performed the statistical analysis, P.R.M. wrote the first draft and all authors contributed to the revisions.
Corresponding author
Ethics declarations
Competing interests
The authors declare no competing interests.
Additional information
Publisher's note
Springer Nature remains neutral with regard to jurisdictional claims in published maps and institutional affiliations.
Supplementary information
Rights and permissions
Open Access This article is licensed under a Creative Commons Attribution 4.0 International License, which permits use, sharing, adaptation, distribution and reproduction in any medium or format, as long as you give appropriate credit to the original author(s) and the source, provide a link to the Creative Commons licence, and indicate if changes were made. The images or other third party material in this article are included in the article's Creative Commons licence, unless indicated otherwise in a credit line to the material. If material is not included in the article's Creative Commons licence and your intended use is not permitted by statutory regulation or exceeds the permitted use, you will need to obtain permission directly from the copyright holder. To view a copy of this licence, visit http://creativecommons.org/licenses/by/4.0/.
About this article

Cite this article
Mbaabu, P.R., Olago, D., Gichaba, M. et al. Restoration of degraded grasslands, but not invasion by Prosopis juliflora, avoids trade-offs between climate change mitigation and other ecosystem services. Sci Rep 10, 20391 (2020). https://doi.org/10.1038/s41598-020-77126-7
Received:
Accepted:
Published:
DOI: https://doi.org/10.1038/s41598-020-77126-7
This article is cited by
-
Characterization of carbon fluxes, stock and nutrients in the sacred forest groves and invasive vegetation stands within the human dominated landscapes of a tropical semi-arid region
Scientific Reports (2024)
-
Global spatial distribution of Prosopis juliflora - one of the world’s worst 100 invasive alien species under changing climate using multiple machine learning models
Environmental Monitoring and Assessment (2024)
-
Experimental prosopis management practices and grassland restoration in three Eastern African countries
CABI Agriculture and Bioscience (2023)
-
Predicting the impacts of urban land change on LST and carbon storage using InVEST, CA-ANN and WOA-LSTM models in Guangzhou, China
Earth Science Informatics (2023)
-
Policy coherence for national climate change adaptation and invasive species management in four countries
CABI Agriculture and Bioscience (2022)
Comments
By submitting a comment you agree to abide by our Terms and Community Guidelines. If you find something abusive or that does not comply with our terms or guidelines please flag it as inappropriate.
