
Abstract
Non-alcoholic fatty liver disease (NAFLD) is a significant problem because its prevalence is increasing worldwide. Recent animal studies have identified gut microbiota as a potentially important player in the pathogenesis of NAFLD. Previously, we reported that the administration of branched-chain amino acids (BCAAs) reduces hepatic fat accumulation in experimental animal models. This study aimed to clarify how changes in the intestinal microbial flora following the administration of BCAAs affect a high-fat diet (HF)-induced fat accumulation in the liver. We examined whether the administration of BCAAs alters the development of hepatic fat accumulation as well as intestinal microbial flora. The oral administration of BCAAs (3% kcal) induced a significant increase in Ruminococcus flavefaciens (R. flavefaciens) and portal acetic acid levels, and it reduced hepatic fat accumulation in HF-fed rats. In addition, BCAAs reduced the expression of the lipogenesis-related genes FAS and ACC in the liver. Furthermore, we observed that R. flavefaciens is essential for promoting a BCAA-induced reduction in hepatic fat accumulation. These data suggest that BCAA treatment induces the proliferation of intestinal flora including R. flavefaciens and that portal acetic acid synthesized from intestinal flora improves NAFLD by downregulating the expression of FAS and ACC in the liver.
Introduction
Non-alcoholic fatty liver disease (NAFLD) is a significant public health problem because of the dramatic increase in the prevalence of obesity. The accumulation of triglycerides in hepatocytes (hepatic steatosis) is the most common liver phenotype in NAFLD. Recently, the gut microbiota has gained great attention in metabolic diseases since gut dysbiosis has been demonstrated in patients with NAFLD as well as those with obesity and metabolic syndrome 1,2. A previous study identified gut microbiota as a potentially important player in the pathogenesis of NAFLD 2. A “multiple-hit hypothesis” has been proposed for the aetiology of NAFLD. In this model, various elements are posited to be involved in the development of the disease state, and the intestinal flora is identified as one of these elements 3. Moreover, changes in the amounts of lipopolysaccharides 4,5, bile acids 6,7 and short-chain fatty acids (SCFAs) 8,9,10,11 in association with intestinal bacteria have been suggested to influence the mechanism of NAFLD development.
The gut microbiota influences the host metabolic phenotype via a range of mechanisms, including the production of energetic substrates by fermentation, especially SCFAs such as acetic acid 12. Acetic acid is the main SCFA produced by several intestinal bacteria, and cellulose intake is essential for synthesizing acetic acid. In the field of gastroenterology, branched-chain amino acid (BCAA) preparations have mainly been used to improve hypoalbuminaemia and hepatic encephalopathy in patients with cirrhosis. In addition, through research using animal models and human subjects, BCAAs have been reported to inhibit carcinogenesis in hepatocytes and reduce oxidative stress 13,14,15,16. Previously, we reported that the administration of BCAAs in experimental animal models of NAFLD promotes fat consumption in muscle tissues and reduces hepatic fat accumulation 17. Little is known about the link between BCAAs and intestinal flora in humans, although the administration of BCAAs has been reported to increase specific bacterial species primarily within the stomachs of herbivores 18,19,20. Furthermore, no report has identified how changes in intestinal flora due to the administration of BCAAs for the treatment of NAFLD bring about its physiological changes.
The goal of the present study is to determine whether (1) there are specific compositional and functional characteristics of the gut microbiome in obese-induced fat accumulation in the liver, which may be associated with BCAA administration, using select microbial taxa found to be differentially abundant in next generation sequencing data, and (2) changes in intestinal flora as a result of BCAA administration is also related to portal acetic acid levels as well as fat accumulation in the liver.
Results
Summary of experimental plan “Design 1”
In the intestinal flora, BCAA supplementation increased the proportion of R. flavefaciens and portal acetic acid levels in animals subjected to a HF. Moreover, BCAA treatment induced the activity of AMPK which downregulated lipogenesis-related enzymes such as fatty-acid synthase (FAS) and acetyl-CoA carboxylase (ACC), and improved fat accumulation in the liver.
Summary in experimental plan “Design 2”
In animals subjected to a high-fat diet, the BCAA-induced alterations in intestinal flora, portal acetic acid levels, AMPK activity, expression of lipogenesis-related enzymes, and hepatic fat accumulation was disappeared due to cellulose deficiency.
Effect of BCAA supplementation on daily caloric intake, body weight, serum BCAA levels and biochemical data
In Design 1, there was no difference in body weight among all groups, although the daily caloric intake of the HF-BCAA group was significantly greater than that of a standard diet (ST)-fed group. In addition, there was no significant alteration in the serum BCAA, alanine aminotransferase (ALT), total cholesterol (TC), triglyceride (TG) and glucose levels among all groups (Supplementary table. S1). In Design 2, there was no difference in daily caloric intake, body weight, or serum parameters described above among all groups (Supplementary table. S2).
Effect of BCAA supplementation on intestinal flora
We examined whether BCAA administration affects intestinal flora in Design 1 at the genus level and the species level (Supplementary figure. S1). At the genus level, there was no significant difference among the groups except that the proportion of the genus Coprococcus was significantly reduced following HF feeding regardless of BCAA supplementation (Fig. 1A, Supplementary fig. S1). At the species level in Design 1, there was no significant difference in the groups except that BCAA supplementation elevated the proportion of Ruminococcus flavefaciens (R. flavefaciens) in the HF feeding group but not in the ST feeding group (Fig. 1B, Supplementary fig. S1).

Effects of BCAA supplementation on the proportion of genus Coprococcus (A) and R. flavefaciens (B), portal acetic acid concentrations (C) and hepatic AMPK activity (D). The rate of intestinal flora was calculated from the number of sequenced leads. Values are expressed as the means ± S.D. *p < 0.05 between the groups connected by a line. ST, fed a standard diet; ST-BCAA, fed a ST with added BCAAs; HF, fed a high-fat diet; and HF-BCAA, fed a HF with added BCAAs.
Effect of BCAA supplementation on portal acetic acid levels
Moreover, BCAA administration increased portal acetic acid levels in the HF feeding group (HF group, 2.30 ± 0.28 mg/dl; HF-BCAA group, 4.29 ± 0.36 mg/dl) but not in the ST feeding group (ST group, 3.04 ± 0.51 mg/dl; ST-BCAA group, 2.65 ± 0.18 mg/dl; Fig. 1C).
Effect of BCAA supplementation on the pAMPK/AMPK ratio in the liver
In the HF feeding group, a significant increase in the pAMPK/AMPK ratio was observed following BCAA treatment which elevated the portal acetic acid concentration, indicating that BCAA treatment activated hepatic AMPK in the HF feeding group (Fig. 1D).
Effect of BCAA supplementation on hepatic fat accumulation and liver fibrosis
In addition, the morphological findings (Fig. 2A) and results of hepatic TG content analysis (Supplementary fig. S2) showed that BCAA treatment attenuated HF-induced fat accumulation in the liver, although these findings were not observed in the ST feeding group. We also calculated the NAFLD activity score for steatosis. BCAA administration decreased the HF-induced elevation in the steatosis score, indicating that BCAA treatment resulted in a significant improvement in liver steatosis in the HF feeding group (Supplementary fig. S2). However, there was hardly any liver fibrosis observed in each group (Supplementary fig. S2).

Effects of BCAA supplementation on HF-induced fat accumulation in the liver (A) and hepatic lipogenesis-related protein expression of FAS (B) and ACC (C). Representative adipophilin immunostaining of the liver (A). Values are expressed as the means ± S.D. (B, C). *p < 0.05 between the groups connected by a line. Scale bar = 20 μm. A representative band of each group was trimmed. Full-length gels are presented in Supplementary figure. S9. ST, fed a standard diet; ST-BCAA, fed a ST with added BCAAs; HF, fed a high-fat diet; and HF-BCAA, fed a HF with added BCAAs.
Effect of BCAA supplementation on the expression of lipogenesis-related genes and proteins
We investigated whether BCAA administration altered the expression of lipogenesis-related genes, such as FAS, which encodes an enzyme that catalyses fatty acid synthesis, and ACC, which encodes an enzyme that catalyses fatty acid synthesis in the liver. Quantitative RT-PCR analyses showed that HF feeding increased the transcription of FAS and ACC, which were completely reversed by BCAA treatment (Supplementary fig. S3). We also evaluated the protein expression of FAS and ACC in the liver. Similar to the transcription data for these mRNAs, HF-induced an increase in the expression of FAS (Fig. 2B, Supplementary fig. S9) and ACC (Fig. 2C, Supplementary fig. S9) proteins, but they were was suppressed by BCAA supplementation in the HF feeding group.
Effect of BCAA supplementation on intestinal flora and portal acetic acid levels in cellulose-deficient HF feeding conditions
Furthermore, we investigated the role of R. flavefaciens in the BCAA-induced alteration in hepatic fat accumulation. In Design 2, we examined whether the proliferation of R. flavefaciens induced by BCAA treatment was altered in cellulose-deficient feeding because R. flavefaciens proliferates mainly using cellulose as a substrate. At the genus level in Design 2, BCAA treatment increased the proportion of the genus Ruminococcus and this finding was disappeared in conditions of cellulose deficiency (Supplementary fig. S4). At the species level, we observed that the BCAA-induced increase in the R. flavefaciens proportion was suppressed by cellulose deficiency, indicating that cellulose is necessary for R. flavefaciens to proliferate (Fig. 3A, Supplementary fig. S4).

Effects of cellulose on the BCAA-induced alteration of the R. flavefaciens rate (A), portal acetic acid concentrations (B) and hepatic AMPK activity (C). Values are expressed as the means ± S.D. *p < 0.05 between the groups connected by a line. HF, fed a high-fat diet; HF-cel(–), fed a HF without cellulose; HF-BCAA, fed a HF with added BCAAs; and HF-cel(–)-BCAA, fed a cellulose-free HF with added BCAAs.
Moreover, the concentration of acetic acid in portal vein blood for each respective group [HF group, 3.59 ± 0.10 mg/dl; HF-cel(−) group, 3.86 ± 0.19 mg/dl; HF-BCAA group, 5.75 ± 0.32 mg/dl; and HF-cel(−)-BCAA group, 3.78 ± 0.12 mg/dl] indicated that cellulose deficiency inhibited BCAA-induced elevation of portal acetic acid levels and that the proliferation of R. flavefaciens is related to the increase in portal acetic acid levels caused by BCAA supplementation (Fig. 3B).
Effect of BCAA supplementation on the hepatic pAMPK/AMPK ratio in cellulose-deficient HF feeding conditions
In Design 2, the BCAA-induced increase in pAMPK/AMPK ratio in the liver was disappeared due to cellulose deficiency, suggesting that cellulose is needed to promote the hepatic activity of AMPK by BCAA supplementation in HF feeding conditions (Fig. 3C).
Effect of BCAA supplementation on hepatic fat accumulation and liver fibrosis in cellulose-deficient HF feeding conditions
In Design 2, the morphological findings (Fig. 4A) and results of hepatic TG content analysis (Supplementary fig. S5) show that cellulose deficiency suppressed BCAA-induced decrease in fat accumulation in the liver, although cellulose deficiency itself did not alter fat accumulation in the liver. BCAA treatment also reduced the steatosis score, but this improvement disappeared in cellulose deficient conditions, indicating that cellulose is needed to improve hepatic steatosis by BCAA administration (Supplementary fig. S5). Similar to Design 1, we did not observe liver fibrosis in each group (Supplementary fig. S5).

Effects of cellulose on the BCAA-induced reduction of hepatic fat accumulation (A) and hepatic lipogenesis-related protein expression of FAS (B) and ACC (C). Representative adipophilin immunostaining of the liver in each group (A). Values are expressed as the means ± S. D (B, C). *p < 0.05 between the groups connected by a line. Scale bar = 20 μm. A representative band of each group was trimmed. Full-length gels are presented in Supplementary figure. S10. HF, fed a high-fat diet; HF-cel(−), fed a HF without cellulose; HF-BCAA, fed a HF with added BCAAs; and HF-cel(−)-BCAA, fed a cellulose-free HF with added BCAAs.
Effect of BCAA administration on the expression of lipogenesis-related genes and proteins in cellulose-deficient HF feeding conditions
We observed that cellulose deficiency attenuated the BCAA-induced decrease in the transcription of FAS and ACC in the HF feeding group (Supplementary fig. S6). We also evaluated the protein expression of FAS and ACC in the liver. Furthermore, we found that cellulose deficiency repressed the BCAA-induced reduction in the protein levels of FAS (Fig. 4B, Supplementary fig. S10) and ACC (Fig. 4C, Supplementary fig. S10), which is consistent with the transcriptional changes observed for these mRNAs, suggesting that cellulose is necessary for BCAA treatment to reduce hepatic fat accumulation.
Discussion
In this study, we examined whether BCAA supplementation alters the development of hepatic fat accumulation through alterations of intestinal microbial flora. BCAA supplementation induced the proliferation of R. flavefaciens and the increase of portal levels of acetic acids synthesized from R. flavefaciens improves HF-induced hepatic fat accumulation by downregulating the expression of FAS and ACC in the liver.
We tested supplementation with BCAA at a concentration of 3%, because other studies indicated that 3% BCAA supplementation reduced the amount of hepatic triglyceride accumulation and the expression of inflammatory cytokines in the liver as well as drug-induced liver fibrosis 17,21,22. Using terminal restriction fragment polymorphism (T-RFLP) analysis and next-generation sequencing, we found that R. flavefaciens, which produces acetic acid primarily from cellulose, was more abundant in HF feeding conditions with BCAA supplementation, indicating that BCAAs might be necessary to increase the proportion of R. flavefaciens 23,24,25. Several laboratories have reported a relationship between BCAAs and R. flavefaciens. In herbivores, BCAAs are synthesized from branched-chain volatile fatty acids (BCVFAs) by microorganisms in the stomach, and these BVCFAs are necessary for the increase in cellulolytic bacteria such as R. flavefaciens 26,27. Moreover, they promote the decomposition of dietary fibre and the growth of bacteria 18. In studies in which BCAAs have been removed from cell culture medium to induce intragastric fermentation in vitro, bacterial proliferation was inhibited 19. Moreover, when the same amounts of BCAAs and BCVFAs were added, BCAAs were found to promote the decomposition of dietary fibre in the stomach by bacteria more effectively 20. In this study, we have revealed that oral administration of BCAAs promotes the proliferation of R. flavefaciens, which is a cellulolytic bacterium. On the other hand, we observed that the genus Coprococcus was significantly decreased by HF feeding conditions. The genus Coprococcus produces butyric acid, mainly in the intestinal tract of its host, using carbohydrates as a substrate 28. It has been reported that the genus Coprococcus is less abundant in patients with NAFLD than it is in healthy controls, which is consistent with our data 29. Moreover, a relatively low abundance of the genus Coprococcus was also observed in patients with other inflammatory conditions, suggesting that a low abundance of the genus Coprococcus can promote chronic inflammation that may contribute to NAFLD pathogenesis 30.
Here, the question arises as to why BCAA administration does not lead to proliferation of R. flavefaciens in ST-fed rats. We found that the proportion of the genus Coprococcus (12.9%) was increased more than that of R. flavefaciens (3.6%) in the ST, although the proportion of R. flavefaciens (8.9%) was more abundant than that of the genus Coprococcus (6.7%) in the HF conditions. One possible explanation is that the ST contains 60% carbohydrates, which the genus Coprococcus uses as a substrate, whereas the HF only contains 35% carbohydrate. Thus, we speculate that the genus Coprococcus might dominate the intestinal flora in the ST, and the BCAA-induced proliferation of R. flavefaciens might be masked by the increase in the genus Coprococcus. In addition, the present study showed no difference in body weight between the ST and HF groups. There is a report that eight week of intake of a 60% HF does not induce obesity in young rats, but the total calorie intake is increased in HF feeding, which is consistent with our results 31. While there was a trend for the HF-fed groups to have a higher body weight (Supplementary table S1), it was not significant probably due to the relatively short duration of HF feeding.
Several studies have demonstrated that SCFAs contribute greatly to energy homeostasis and lipid metabolism in multiple tissues 32,33. Furthermore, SCFAs are well known for their anti-inflammatory effects, such as suppressing inflammatory reactions in the intestines, although it is uncertain how the anti-inflammatory effects of SCFAs are connected to systemic metabolic inflammation in obesity 34. One interesting note is that acetic acid-administered obese rats had less hepatic lipid accumulation than water-administered obese rats 10. When acetic acid is orally administered, it is immediately taken up from the intestine, excreted into the bloodstream, and absorbed by the tissues. Considering our results in which BCAA supplementation increased portal acetic acid levels in HF-fed rats and reduced HF-induced fat accumulation in the liver as well as improved steatosis, one part of the NAFLD activity score, BCAA administration might be useful for suppressing the development of NAFLD by acetic acid produced through intestinal bacteria such as R. flavefaciens.
There was no significant alteration in the plasma BCAA levels in Design 1. Amino acids, including BCAAs, exist as free amino acids inside the body and are called the "amino-acid pool". The consistency of the plasma concentration of amino acids is maintained by the "amino-acid pool", and excess amino acids are oxidatively decomposed 35. Therefore, the plasma concentration of BCAAs was not significantly altered by BCAA supplementation in Design 1.
As already mentioned, cellulose is essential for maintaining the proportion of R. flavefaciens and for producing acetic acid from R. flavefaciens. To further understand the impact of the proliferation of R. flavefaciens by BCAA administration on the elevation of portal acetic acid levels and fat accumulation in the liver, we examined whether the downregulation of R. flavefaciens proliferation by cellulose deficiency influences BCAA-induced proliferation of R. flavefaciens, elevation of portal acetic acid levels and reduction of hepatic fat accumulation. We observed that BCAA-induced increases in R. flavefaciens in the intestine and portal acetic acid levels were not observed in the cellulose-free diet. Similarly, the BCAA-induced reduction of fat accumulation and steatosis in the liver disappeared with cellulose deficiency, indicating that R. flavefaciens might play a role in inhibiting the development of NAFLD by BCAA administration. This is the first report showing that acetic acid produced by R. flavefaciens, which requires cellulose to proliferate in the intestinal tract, might be associated with the mechanism of action by which BCAAs alleviate fat accumulation in the liver.
The acetic acid transported to the liver is activated to acetyl-CoA with the concomitant formation of AMP. The increase in AMP concentration leads to an increase in the AMP/ATP ratio following the phosphorylation of AMPK, which is its active form in the liver. AMPK acts as the key metabolic “master switch” and regulates a number of enzymes involved in lipid homeostasis. It has been reported that the activation of AMPK leads to the inactivation of carbohydrate response element (ChRE)-binding protein (ChREBP). ChREBP upregulates two key liver lipogenic enzymes: ACC and FAS36. Therefore, the inhibition of lipogenesis by acetic acid might be assumed to occur in the liver through the activation of AMPK 8. We investigated the effect of acetic acid transported to the liver through the portal vein on hepatic fat accumulation and its mechanism, mainly focusing on lipogenesis. In this study, we clarified that the oral administration of BCAAs, which elevates portal acetic acid levels by increasing the rate of R. flavefaciens, activates hepatic AMPK and downregulates the transcription of FAS and ACC which are lipogenesis genes and it activates the expression of these proteins in the liver. There are some similar changes in the liver in previous studies, and oral administration of SCFAs decreased FAS expression as well as fat accumulation in pigs 37. In addition, oral administration of acetic acid to obese rats reduced the expression of lipogenesis genes such as FAS and ACC, and the intake of acetic acid contributed to lowering the accumulation of abdominal fat and protecting against the accumulation of lipids in the liver 5,38. On the other hand, this study showed that the portal acetic acid level was increased by 1.5 ~ 2.0 mg/dl with BCAA supplementation compared to that of the HF-fed group, which might seem to be a slight alteration. However, a previous study reported that 150 µM acetic acid increased AMPK activity due to an increase in the AMP content of primary hepatocytes. Acetic acid at concentration of 150 µM is expected to have a potency equivalent to the 0.9 mg/dl plasma acetic level, indicating that the BCAA-induced increase in the portal acetic acid concentration observed in this study is sufficient to reduce fat accumulation in the liver.
In the present study, we demonstrate that BCAA-induced reduction of hepatic fat accumulation occurs at an early stage of NAFLD based on chronic overnutrition for eight weeks. This animal model reproduces the early stage of liver disease, as shown by steatosis with low inflammation and no fibrosis. From a methodological point of view, this is of paramount importance, since the pathogenic mechanisms responsible for the transition from steatosis to steatohepatitis and fibrosis in early stage NAFLD could be a potential therapeutic target. Furthermore, we used a 45% fat diet to produce early- stage NAFLD because other studies have demonstrated that BCAA supplementation ameliorates obesity induced by a 45% fat diet but not by a 60% fat diet 17,39. These findings indicate that the significant effects of BCAAs appear to be sensitive to fat levels in the diet.
Our study has some limitations. First, the low number of samples may influence the results. Second, differences in types of high-fat diets such as diets containing 60% or 45% fat may influence the gut microbiota. Third, regarding faecal sample collection, there was variability among many studies, which may affect the gut microbiota. Currently, the gut microbiota has been widely recognized as a remarkable factor that leads to the development of obesity, although disparities exist. Differences in data analysis techniques and reference databases could result in discrepancies, which were excluded from this study. However, different ages of animals and different commercial dealers are also potential confounding factors that may affect a component of microbiota, which is a limitation of this study 40. In addition, different 16S rRNA gene regions used in individual datasets may cause differences in taxonomic categories. In the future, more studies under consistent conditions should be performed.
In conclusion, we found that the administration of BCAAs promotes R. flavefaciens proliferation and subsequently increases the amount of acetic acid produced from R. flavefaciens. This acetic acid is thought to be excreted into the portal venous bloodstream and, when absorbed in the liver and metabolized, is thought to suppress the expression of lipogenesis-related genes, thereby reducing fat accumulation in the liver (Fig. 5). These findings indicate that BCAAs may be useful in preventing the development of NAFLD, although further studies are needed to assess this hypothesis.
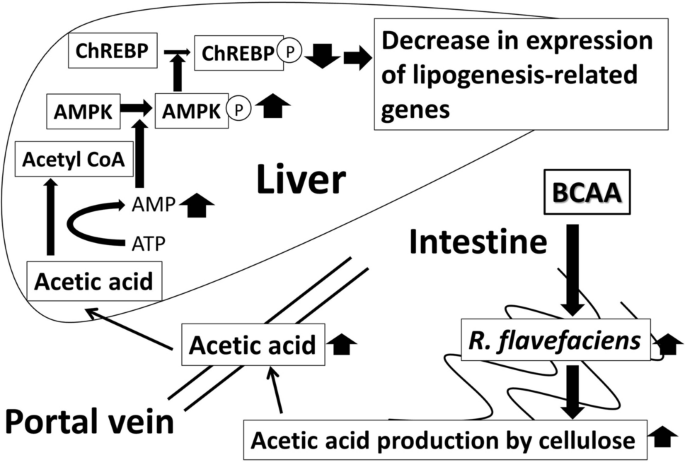
Mechanism of action by which BCAAs improve NAFLD. The administration of BCAAs promotes R. flavefaciens proliferation and subsequent synthesis of acetic acid which suppresses the expression of lipogenesis-related genes in the liver.
Material and methods
Animals
Male 8-week-old Sprague–Dawley rats (270–330 g; Charles River Laboratories, Inc., Kanagawa, Japan) were housed in individual cages in a room with daily illumination from 07:00 to 19:00 (12-h/12-h light/dark cycle) and were maintained at 21 ± 1 °C with 55 ± 5% humidity. Animals were provided ad libitum access to chow and tap water. All experiments were performed in accordance with the guidelines established by the National Institutes of Health, USA, regarding the care and use of animals for experimental procedures. Additionally, the ethics committee of the Division of Laboratory Animal Science, Research Promotion Project of Oita University, specifically approved this study.
Diets
The basal diet consisted of six types: a standard diet (ST; 10% fat, 70% carbohydrate, 20% protein; Research Diets, Inc., New Brunswick, NJ, USA), a ST plus BCAA diet (ST-BCAA; 10% fat, 67% carbohydrate, 23% protein), a high-fat diet (HF; 45% fat, 35% carbohydrate, 20% protein; Research Diets, Inc.), a HF plus BCAA diet (HF-BCAA; HF; 45% fat, 33% carbohydrate, 22% protein), a HF without cellulose diet [HF-cel(-); 45% fat, 35% carbohydrate, 20% protein] and a cellulose-free HF plus BCAA diet [HF-cel(-)-BCAA; 45% fat, 33% carbohydrate, 22% protein]. The ingredients and nutrient compositions of each diet are shown in Supplementary fig. S7. The absolute amounts of leucine, isoleucine and valine per 100 g diet supplemented with BCAAs were 2.7 ~ 3.4 g, 1.5 ~ 1.8 g, and 2.0 ~ 2.5 g, respectively.
Experimental protocol
Design 1 Twenty-four rats were assigned to one of four groups. In group 1 (ST group, n = 6), rats were fed the standard diet for 8 weeks. In group 2 (ST-BCAA group, n = 6), rats were fed a ST supplemented with BCAAs (accounting for 3% of the total kcals) for 8 weeks. In group 3 (HF group, n = 6), rats were fed a HF for 8 weeks. In group 4 (HF-BCAA group, n = 6), rats were fed a HF supplemented with BCAAs (accounting for 3% of the total kcals) for 8 weeks. The daily dietary intake, body weight and the increase in body weight during the experiment were measured.
Design 2 Twenty-four rats were assigned to one of four groups. In group 1 (HF group, n = 6), rats were fed a HF for 8 weeks. In group 2 (HF-cel(-) group, n = 6), rats were fed a HF without cellulose for 8 weeks. In group 3 (HF-BCAA group, n = 6), rats were fed a HF supplemented with BCAAs (accounting for 3% of the total kcals) for 8 weeks. In group 4 (HF-cel(-)-BCAA group, n = 6), rats were fed a cellulose-free HF supplemented with BCAAs (accounting for 3% of the total kcals) for 8 weeks. The daily dietary intake, body weight and increase in body weight during the experiment were measured.
The protocols of Designs 1 and 2 are shown in the Supplementary fig. S8.
16S metagenomics
The faecal samples were lysed by incubating the samples in lysis buffer, and these were homogenized by bead beating with zirconium beads (0.1 mm and 0.3 mm) using a TissueLyser (Qiagen, Tokyo, Japan) for 15 min at a speed of 25 m/s. Then, DNA was extracted from each 20-mg ileum stool sample using a QIAamp DNA Stool Mini Kit (Qiagen), in accordance with the method described by the manufacturer. Forward and reverse primers were prepared as described by Caporaso et al. 41, and the 16S V4 region of the DNA was PCR amplified using TaKaRa Ex Taq (Takara Bio, Inc., Siga, Japan). Thereafter, we purified the amplified DNA using a DNA purification kit (Qiagen) according to the method described by the manufacturer. We measured the DNA concentration of each sample by RT-PCR using a Light Cycler (Roche Diagnostics K.K., Tokyo, Japan) with a SYBR Green PCR kit (Qiagen), and we created a calibration curve using DNA standards (KAPA Biosystems, Wilmington, MA, USA) and equalizing the concentration to 1000 ng/ml. The equalized samples were subjected to electrophoresis using a 1% agarose gel with a 20-bp DNA ladder (Takara Bio, Inc.) as a control, and we ensured that there were no unnecessary bands and that there was a band of approximately 250 bp. We prepared a mixture containing 2-μl of each sample to generate a mixed library using a MiSeq reagent kit v2 (Illumina, Inc., San Diego, CA, USA) for MiSeq sequencing. We prepared a mixture of 200 μl of library solution (5 μl of mixed library, 5 μl of 0.2 N NaOH and 990 μl of HT1 buffer), 150 μl of PhiX solution (2 μl of 10 nM PhiX control v3 (Illumina, Inc.), 3 μl of EB buffer (Qiagen), 0.5 μl of 0.2 N NaOH, and 990 μl of HT1 buffer) and 250 μl of HT1 buffer as a final sample to be analysed. Read 1, read 2 and index primers were prepared as described by Caporaso et al. 41. The library was subjected to primary analysis using MiSeq (Illumina, Inc.), while secondary analysis was performed using the sequencing hub application “16S metagenomics v1.0”, which is provided on “Base Space”, a cloud service provided by Illumina, Inc.
Measurement of portal acetic acid levels and hepatic triglyceride (TG) contents
After anaesthetization with sodium pentobarbital (50 mg/kg, i.p.), blood was obtained from the portal vein of each rat and it was centrifuged at 4000×g for 10 min at 4 °C. Serum was immediately frozen and stored at − 80 °C until analysis. Finally, the rats were exsanguinated following transcardial perfusion with 100 ml of saline containing 200 U of heparin. Livers were removed, immediately frozen and stored at − 80 °C until analysis. The concentration of short-chain fatty acids was measured in portal vein blood with gas chromatography tandem mass spectrometry using GCMS-QP2020 (Shimadzu Corporation, Kyoto, Japan). The area from the baseline of the obtained waveform was used as an indicator of the concentration of acetic acid. The concentration was calculated based on a calibration curve created using step diluted acetic acid. Liver tissue (100 mg) was homogenized for 10 min in 1 ml of a solution containing 150 mM NaCl, 0.1% Triton X-100, and 10 mM Tris using a Polytron homogenizer (NS-310E; Micro Tech Nichion, Chiba, Japan). Liver TG contents was measured using an automatic analyser (SRL, Tokyo, Japan).
Histological analyses
Liver tissue samples were fixed with 4% paraformaldehyde and then were embedded in paraffin. Sections of 5-µm thickness were cut with a vibratome, stained with haematoxylin and eosin (HE) and examined under a microscope (Olympus, Tokyo, Japan). For assessing liver fibrosis, reticulin staining using silver impregnation was performed to detect reticulin fibres. We observed the tissue stained with HE and generated a score for steatosis and fibrosis of the NAFLD activity score (NAS). The score was defined from medium-power evaluation (100× magnification) of parenchymal involvement by steatosis as follows: 0 (< 5%), 1 (5–33%), 2 (34–66%), and 3 (> 66%). Each sample was scored based on 10 views, and the mean score was calculated. The fibrosis score was also defined as follows: 0 (none), 1 (pericellular fibrosis), 2 (sinusoid and pericellular), 3 (bridging fibrosis), and 4 (cirrhosis).
We performed tissue immunostaining with adipophilin to stain the membrane of the lipid droplet. We used an adipophilin rabbit polyclonal antibody (LifeSpan BioSciences Inc., Seattle, WA, USA) as the primary antibody and completed the immunohistochemical staining with a biotin-labelled secondary antibody.
RT-PCR
Total RNA was isolated from liver tissue using an RNeasy mini kit (Qiagen) in accordance with the method described by the manufacturer and reverse-transcribed to obtain cDNA using the PrimeScript RT Reagent Kit (Takara Bio, Inc.).
2 μg cDNA was used for relative quantitative PCR analysis with specific primers such as ACC, FAS, and β-actin. The sequences of the primers were as follows: ACC (NM022193, sense: CCTTCTTCTACTGGCGACTGAG, antisense: TAAGCCTTCACTGTGCCTTCC), FAS (NM017332, sense: GAGGACTTGGGTGCCGATTAC, antisense: GCTGTGGATGATGTTGATGATAGAC), and β-actin (NM031144, sense: GGCACCACACTTTCTACAAT, antisense: AGGTCTCAAACATGATCTGG). RT-PCR was performed for 40 cycles using the following cycling conditions and TB Green Premix Ex Taq II (Takara Bio, Inc.): 30 s of denaturation at 95 °C, 5 s of annealing at 95 °C and 30 s of extension at 60 °C.
Western blotting
Frozen liver tissue preparations were homogenized with sodium dodecyl sulfate (SDS) sample buffer, clarified by centrifugation, and boiled. The total protein concentration in each tissue sample was quantified by the Bradford method, and 8 µg of total protein per sample was loaded onto 8% SDS–polyacrylamide gels for electrophoresis (PAGE). The separated proteins were transferred onto polyvinylidene difluoride (PVDF) membranes (Bio-Rad Laboratories). The membranes were incubated with a primary antibody solution consisting of 5 g/L polyclonal antiserum with specificity for FAS, ACC and β-actin. These primary antibodies were purchased from Santa Cruz Biotechnology (Texas, USA). Immunoreactive bands were detected by enhanced chemiluminescence (Amersham Life Science, Buckinghamshire, UK) and were quantified using National Institutes of Health imaging software. We measured the FAS, ACC and β-actin of each specimen and determined each protein level as a ratio to that of β-actin between each group.
AMPK and pAMPK in ELISA
We measured total AMPK and pAMPK levels using the following kits in accordance with the method described by the manufacturer: rat phosphorylated AMP-activated protein kinase ELISA kit (MBS7230575; MyBioSource, Inc., San Diego, CA, USA) for measuring pAMPK levels, and rat total AMP-activated protein kinase (AMPK) ELISA kit (MBS1602983; MyBioSource, Inc.) for measuring AMPK levels.
Biochemical data
Serum alanine aminotransferase (ALT) and total cholesterol (TC) were measured using an automatic analyser (RINTEC, Japan). Serum triglyceride (TG) and glucose levels were measured with each assay kit (Wako, Tokyo, Japan). Serum amino acid levels such as BCAAs were measured with liquid chromatography using a JLC-500 (JEOL Ltd., Tokyo, Japan) fully automated amino acid analyser.
Statistical analysis
Data were analysed by one-way analysis of variance and Tukey’s or Fischer’s post hoc test using SPSS, and p < 0.05 was assumed to indicate statistical significance.
Data availability
All data generated or analysed during this study are included in this article and its supplementary information.
References
Murphy, E. F. et al. Divergent metabolic outcomes arising from targeted manipulation of the gut microbiota in diet-induced obesity. Gut 62, 220–226 (2013).
Boursier, J. & Diehl, A. M. Implication of gut microbiota in nonalcoholic fatty liver disease. PLoS Pathog. 11, e1004559 (2015).
Buzzetti, E., Pinzani, M. & Tsochatzis, E. A. The multiple-hit pathogenesis of non-alcoholic fatty liver disease (NAFLD). Metabolism. 65, 1038–1048 (2016).
Cani, P. D. et al. Changes in gut microbiota control metabolic endotoxemia-induced inflammation in high-fat diet-induced obesity and diabetes in mice. Diabetes 57, 1470–1481 (2008).
Creely, S. J. et al. Lipopolysaccharide activates an innate immune system response in human adipose tissue in obesity and type 2 diabetes. Am. J. Physiol. Endocrinol. Metab. 292, E740-747 (2007).
Zheng, X. et al. Bile acid is a significant host factor shaping the gut microbiome of diet-induced obese mice. BMC Biol. 15, 120 (2017).
Parséus, A. et al. Microbiota-induced obesity requires farnesoid X receptor. Gut 66, 429–437 (2017).
Rahat-Rozenbloom, S., Fernandes, J., Gloor, G. B. & Wolever, T. M. Evidence for greater production of colonic short-chain fatty acids in overweight than lean humans. Int. J. Obes. 38, 1525–1531 (2014).
Fernandes, J., Su, W., Rahat-Rozenbloom, S., Wolever, T. M. & Comelli, E. M. Adiposity, gut microbiota and faecal short chain fatty acids are linked in adult humans. Nutr Diabetes. 4, e121 (2014).
Shepherd, M. L., Ponder, M. A., Burk, A. O., Milton, S. C. & Swecker, W. S. Fibre digestibility, abundance of faecal bacteria and plasma acetate concentrations in overweight adult mares. J. Nutr. Sci. 3, e10 (2014).
Perry, R. J. et al. Acetate mediates a microbiome-brain-β cell axis promoting metabolic syndrome. Nature 534, 213–217 (2016).
Wong, J. M., de Souza, R., Kendall, C. W., Emam, A. & Jenkins, D. J. Colonic health: fermentation and short chain fatty acids. J. Clin. Gastroenterol. 40, 235–243 (2006).
Marchesini, G. et al. Nutritional supplementation with branched-chain amino acids in advanced cirrhosis: a double-blind, randomized trial. Gastroenterology 124, 1792–1801 (2003).
Kakazu, E. et al. Branched chain amino acids enhance the maturation and function of myeloid dendritic cells ex vivo in patients with advanced cirrhosis. Hepatology 50, 1936–1945 (2009).
Muto, Y. et al. Overweight and obesity increase the risk for liver cancer in patients with liver cirrhosis and long-term oral supplementation with branched-chain amino acid granules inhibits liver carcinogenesis in heavier patients with liver cirrhosis. Hepatol. Res. 35, 204–214 (2006).
Muto, Y. et al. Effects of oral branched-chain amino acid granules on event-free survival in patients with liver cirrhosis. Clin. Gastroenterol. Hepatol. 3, 705–713 (2005).
Arakawa, M., Masaki, T., Nishimura, J., Seike, M. & Yoshimatsu, H. The effects of branched-chain amino acid granules on the accumulation of tissue triglycerides and uncoupling proteins in diet-induced obese mice. Endocr. J. 58, 161–170 (2011).
Andries, J. I., Cottyn, B. G., De Keersmaecker, S. & Buysse, F. X. Effects of the addition of iso-acids to feed on ruminal fermentation, in sacco degradation of dry matter and the concentration of several blood parameters in cows. Reprod. Nutr. Dev. 2, 181s–182s (1990).
Wang, M., Wang, H., Cao, H., Li, G. & Zhang, J. Effects of limiting amino acids on rumen fermentation and microbial community in vitro. Agric. Sci. China 7, 1524–1532 (2008).
Yang, C. M. Response of forage fiber degradation by ruminal microorganisms to branched-chain volatile fatty acids, amino acids, and dipeptides. J. Dairy Sci. 85, 1183–1190 (2002).
Iwasa, J. et al. Dietary supplementation with branched-chain amino acids suppresses diethylnitrosamine-induced liver tumorigenesis in obese and diabetic C57BL/KsJ-db/db mice. Cancer Sci. 101, 460–467 (2010).
Terakura, D. et al. Preventive effects of branched-chain amino acid supplementation on the spontaneous development of hepatic preneoplastic lesions in C57BL/KsJ-db/db obese mice. Carcinogenesis 33, 2499–2506 (2012).
Gokarn, R. R., Eiteman, M. A., Martin, S. A. & Eriksson, K. E. Production of succinate from glucose, cellobiose, and various cellulosic materials by the ruminal anaerobic bacteria Fibrobacter succinogenes and Ruminococcus flavefaciens. Appl. Biochem. Biotechnol. 68, 69–80 (1997).
Latham, M. J. & Wolin, M. J. Fermentation of cellulose by Ruminococcus flavefaciens in the presence and absence of Methanobacterium ruminantium. Appl. Environ. Microbiol. 34, 297–301 (1977).
Goel, G., Makkar, H. P. & Becker, K. Inhibition of methanogens by bromochloromethane: effects on microbial communities and rumen fermentation using batch and continuous fermentations. Br. J. Nutr. 101, 1484–1492 (2009).
Allison, M. J., Bryant, M. P. & Doetsch, R. N. Studies on the metabolic function of branched-chain volatile fatty acids, growth factors for ruminococci I Incorporation of isovalerate into leucine. J. Bacteriol. 83, 523–532 (1962).
Feng, Y. L. Ruminant Animal Nutrition (Science press, Beijing, 2004).
Sartor, R. B. Key questions to guide a better understanding of host-commensal microbiota interactions in intestinal inflammation. Mucosal. Immunol. 4, 127–132 (2011).
Zhu, L. et al. Characterization of gut microbiomes in nonalcoholic steatohepatitis (NASH) patients: a connection between endogenous alcohol and NASH. Hepatology 57, 601–609 (2013).
Shaw, K. A. et al. Dysbiosis, inflammation, and response to treatment: a longitudinal study of pediatric subjects with newly diagnosed inflammatory bowel disease. Genome Med. 8, 75 (2016).
Furnes M.W., Zhao C.M., Chen D. Development of obesity is associated with increased calories per meal rather than per day. A study of high-fat diet-induced obesity in young rats. Obes Surg. 19, 1430–1438 (2009).
Gao, Z. et al. Butyrate improves insulin sensitivity and increases energy expenditure in mice. Diabetes 58, 1509–1517 (2009).
Kimura, I. et al. The gut microbiota suppresses insulin-mediated fat accumulation via the short-chain fatty acid receptor GPR43. Nat. Commun. 4, 1829 (2013).
Richards, J. L., Yap, Y. A., McLeod, K. H., Mackay, C. R. & Mariño, E. Dietary metabolites and the gut microbiota: an alternative approach to control inflammatory and autoimmune diseases. Clin. Transl. Immunol. 5, e82 (2016).
Gan, J. C. & Jeffay, H. Origins and metabolism of the intracellular amino acid pools in rat liver and muscle. Biochim. Biophys. Acta. 148, 448–459 (1967).
Yamashita, H. et al. A glucose-responsive transcription factor that regulates carbohydrate metabolism in the liver. Proc. Natl. Acad. Sci. USA 98, 9116–9121 (2001).
Jiao A.R., et al. Oral administration of short chain fatty acids could attenuate fat deposition of pigs. PLoS One. 13, e0196867, https://doi.org/10.1371/journal.pone.0196867 (2018).
Yamashita, H. et al. Improvement of obesity and glucose tolerance by acetate in Type 2 diabetic Otsuka Long-Evans Tokushima Fatty (OLETF) rats. Biosci Biotechnol Biochem. 71, 1236–1243 (2007).
Nairizi, A., She, P., Vary, T. C. & Lynch, C. J. Leucine supplementation of drinking water does not alter susceptibility to diet-induced obesity in mice. J. Nutr. 139, 715–719 (2009).
Ericsson A. C., et al. Effects of vendor and genetic background on the composition of the fecal microbiota of inbred mice. PLoS One. 10, e0116704; https://doi.org/10.1371/journal.pone.0116704 (2015).
Caporaso, J. G. et al. Ultra-high-throughput microbial community analysis on the Illumina HiSeq and MiSeq platforms. ISME J. 6, 1621–1624 (2012).
Acknowledgements
This work was supported by a grant-in-aid for scientific research in Japan.
Author information
Authors and Affiliations
Contributions
M.I., M.A, M.E., K.H., M.S and K.M. designed this study. M.I. collected the data and wrote the manuscript. K.G., M.A., M.E., K.H., M.S. and K.M. collected the data. K.G., M.A., M.E., K.H., M.S., K.M. and H.S. contributed to discussion. H.S. reviewed and edited the manuscript. K.G. is the guarantor of this work and, as such, had full access to all of the data in the study and takes responsibility for the integrity of the data and the accuracy of the data analysis.
Corresponding author
Ethics declarations
Competing interests
The authors declare no competing interests.
Additional information
Publisher's note
Springer Nature remains neutral with regard to jurisdictional claims in published maps and institutional affiliations.
Supplementary information
Rights and permissions
Open Access This article is licensed under a Creative Commons Attribution 4.0 International License, which permits use, sharing, adaptation, distribution and reproduction in any medium or format, as long as you give appropriate credit to the original author(s) and the source, provide a link to the Creative Commons licence, and indicate if changes were made. The images or other third party material in this article are included in the article's Creative Commons licence, unless indicated otherwise in a credit line to the material. If material is not included in the article's Creative Commons licence and your intended use is not permitted by statutory regulation or exceeds the permitted use, you will need to obtain permission directly from the copyright holder. To view a copy of this licence, visit http://creativecommons.org/licenses/by/4.0/.
About this article

Cite this article
Iwao, M., Gotoh, K., Arakawa, M. et al. Supplementation of branched-chain amino acids decreases fat accumulation in the liver through intestinal microbiota-mediated production of acetic acid. Sci Rep 10, 18768 (2020). https://doi.org/10.1038/s41598-020-75542-3
Received:
Accepted:
Published:
DOI: https://doi.org/10.1038/s41598-020-75542-3
This article is cited by
-
SGLT1 and SGLT2 inhibition, circulating metabolites, and cerebral small vessel disease: a mediation Mendelian Randomization study
Cardiovascular Diabetology (2024)
-
Impaired flux of bile acids from the liver to the gut reveals microbiome-immune interactions associated with liver damage
npj Biofilms and Microbiomes (2023)
-
Gut microbiota bridges dietary nutrients and host immunity
Science China Life Sciences (2023)
Comments
By submitting a comment you agree to abide by our Terms and Community Guidelines. If you find something abusive or that does not comply with our terms or guidelines please flag it as inappropriate.
