
Abstract
Machine learning (ML) algorithms have shown potential in automatically detecting and measuring stomata. However, ML algorithms require substantial data to efficiently train and optimize models, but their potential is restricted by the limited availability and quality of stomatal images. To overcome this obstacle, we have compiled a collection of around 11,000 unique images of temperate broadleaf angiosperm tree leaf stomata from various projects conducted between 2015 and 2022. The dataset includes over 7,000 images of 17 commonly encountered hardwood species, such as oak, maple, ash, elm, and hickory, and over 3,000 images of 55 genotypes from seven Populus taxa. Inner_guard_cell_walls and whole_stomata (stomatal aperture and guard cells) were labeled and had a corresponding YOLO label file that can be converted into other annotation formats. With the use of our dataset, users can (1) employ state-of-the-art machine learning models to identify, count, and quantify leaf stomata; (2) explore the diverse range of stomatal characteristics across different types of hardwood trees; and (3) develop new indices for measuring stomata.
Background & Summary
Stomatal responses to environmental factors, such as humidity and soil moisture, are crucial for driving photosynthesis, productivity, water yield, ecohydrology, and climate forcing1,2,3,4. However, to fully understand these responses, we must improve our understanding of the mechanistic basis of stomatal response to environmental factors5. Unfortunately, current stomatal studies are limited by the laborious and time-consuming process of manually counting and measuring stomatal properties, resulting in small dataset size and image scales when observing stomata. Therefore, having large stomatal image datasets for developing fast and high-throughput methods for studying stomata is highly warranted.
The potential of artificial intelligence (AI) for developing annotated, high-throughput stomatal measuring methods is high, which could significantly enhance scientists’ ability to conduct large-scale and intensive stomatal studies. Recently, state-of-the-art machine learning algorithms, such as deep learning, specifically convolutional neural networks (CNNs), have been designed to solve complex image detection and segmentation problems, resulting in various applications tailored to specific objectives6,7. One of the most efficient and straightforward CNN architectures is You Only Look Once (YOLO), proposed by Redmon, et al.8. This architecture has been used for stomatal detection, counting9,10,11,12, and measuring12,13. These studies have shown the potential of using machine learning algorithms for automated stomatal detection and measurement. However, fine-tuning and improvement of machine learning-based stomatal study methods are currently limited by the small, inconsistent, and monotypic nature of stomatal image datasets, which are also poorly accessible.
Many studies have increased stomatal image datasets during machine learning training to avoid overfitting using augmentation techniques such as random translation, rotation, flipping, and zooming9,14. While image preprocessing techniques can increase the training sample size, model performance may still be limited due to variability in stomatal characteristics. For example, some methods trained using specific species datasets may only be sensitive to those species and cannot be generalized for other species9. Therefore, it is crucial to create a publicly accessible leaf stomatal image database to develop machine learning-based, state-of-the-art stomatal measuring methods to be used by ecologists, plant biologists, and ecophysiologists.
Our collection consists of around 11,000 unique images of hardwood leaf stomata collected from projects conducted between 2015 and 2022. Within the hardwood stomatal dataset, there are more than 7,000 images of 17 common hardwood species, such as oak, maple, ash, elm, and hickory. Additionally, the dataset contains over 3,000 images of 55 genotypes from seven Populus taxa (Tables 1, 2). We labeled inner_guard_cell_walls as “0”, whole_stomata (stomatal aperture and guard cells) as “1” and created a YOLO label file for each image. These images and corresponding labels are freely accessible, making it easier to train machine-learning models and analyze leaf stomatal traits. With the help of our dataset, individuals can: (1) utilize cutting-edge machine learning models to train for high-throughput detection, counting, and measurement of leaf stomata of temperate hardwood trees; (2) investigate the diversity in stomatal characteristics across various types of hardwood trees; (3) develop novel indices for measuring stomata.
Methods
Leaves and micrographs collection
The study utilized stomatal images from two datasets: Hardwood and Populus spp., acquired from 2015 to 2022. The Hardwood dataset contained 16 species, including American elm (Ulmus americana Planch), cherrybark oak (Quercus pagoda Raf.), Nuttall oak (Quercus texana Buckley), shagbark hickory (Carya ovata (Mill.) K. Koch), Shumard oak (Quercus shumardii Buckley), swamp chestnut oak (Quercus michauxii Nutt.), water oak (Quercus nigra L.), willow oak (Quercus phellos L.), ash (Fraxinus L.), black gum (Nyssa sylvatica Marshall), deerberry (Vaccinium stamineum Linneaus), leatherwood (Dirca palustris L.), red maple (Acer rubrum L.), post oak (Quercus stellata Wangenh.), willow (Salix spp.), and winged elm (Ulmus alata Michx.), with the age of seedlings ranging from 1–3 years for Nuttall oak, water oak, and Shumard oak, and 30–50 years for the rest. Using a compound light microscope (Olympus, Tokyo, Japan) equipped with a digital microscope camera (MU300, AmScope, USA) with a 5 mm lens and a fixed microscope adapter (FMA050, AmScope), over 10,000 stomatal images were captured. The Populus dataset consisted of over 3,000 images from 55 genotypes of seven taxa of hybrid poplar and eastern cottonwood (Populus deltoides), which were 4 to 5 years old. Detailed taxa and genotype information are shown in Tables 1 and 2.
Between June and August 2020 to 2022, we selected trees and measured their photosynthetic CO2 response curves (AC/i), after which we collected one fully expanded, fresh leaf from each tree. The leaves were placed in labeled plastic bags and kept in a cooler for transportation to the laboratory, where they were stored in a 4 °C refrigerator. Following the method described by Hilu and Randall15, we prepared the leaves for stomatal peels by drying any moisture on the leaves surface with paper towels and applying clear nail polish to 4–6 locations on the abaxial epidermis of the leaves. After allowing the nail polish to dry for approximately 5–8 minutes, we removed it from the leaves and placed it on pre-cleaned microscope slides, covering it with one or two coverslips. We used a 10X upper eyepiece and either an X20 or X40 magnification lens to capture three to ten images per leaf.
Annotation process
We used manual and pre-trained model labeling methods to process image labels. Specifically, we manually labeled 1,000 images, 300 from Populus and 700 from other hardwood species, to train a YOLO model for detecting and measuring inner_guard_cell_walls and whole_stomata. The StoManager1, which incorporates our trained model, has been made publicly available on Zenodo13,16. It has a user-friendly, Graphical User Interface (GUI) version designed for Windows-based systems. We used it to automatically label inner_guard_cell_walls and whole_stomata while exporting the label coordinates to YOLO Darknet format files. It is possible to convert our YOLO Darknet format labeling files into various other annotation formats, including Pascal VOC. Users who require labeling annotations in the Pascal VOC format can utilize online conversion tools, such as Roboflow’s public workspace and open-source GitHub repositories17,18.
The typical format for saving YOLO annotations is a.txt file with five columns containing information about the classes (0, 1) and four variables: x_center, y_center, width, and height of the bounding boxes. The x_center and y_center are expressed as normalized coordinates that correspond to the center of the bounding box, while width and height are normalized values that represent the relative width and height of the box concerning the dimensions of the image. Since StoManager1 exported annotations were structured slightly differently from YOLO annotations, we reformatted them in R and the code is publicly available on a GitHub repository (https://github.com/JiaxinWang123/ScientificData_Labeled_Hardwood_Images).
Label quality check
Labels created by StoManager1 were manually reviewed and adjusted using LabelImg (https://github.com/heartexlabs/labelImg) as necessary. After reviewing and modifying the labels, a subset of images was randomly chosen and used to train YOLO models for detecting the labeled classes, which included inner_guard_cell_walls and whole_stomata. To verify the accuracy of the annotations, a random selection of labeled images was split and used to train YOLOv7 and YOLOv8 models.
Data Records
The dataset contains original images, labels, and data records available to the public on figshare19 and Zenodo20. The data records are presented in a table with 10,715 observations and seven variables. Each observation in the table corresponds to a single image, and each variable represents a column that describes the image name, species name, scientific name, magnification, width, height, and resolution (pixels per 0.1 mm line).
Every image in the dataset has a distinct file name and a corresponding label file, which contains information about classes, coordinates, width, and height. These values are expressed as ratios to the image’s width and height and pertain to the bounding boxes of inner_guard_cell_walls and whole_stomata. Figures 1, 2, and Table 3 provide more comprehensive details regarding the original images, labels, and data records. It is essential to note that magnification, width, height, and resolution are crucial variables for studying leaf stomatal area, stomatal density, and stomatal area variance because they determine the scale of stomatal observation and measurement.

(a) The number of stomata per image of the 17 hardwood species in the dataset, (b) histogram of the number of stomata across Hardwood and Populus datasets. Dots in plot (a) indicate the mean of the stomatal density and the lines represent the range of the stomatal density. Blue dotted lines represent the percentage quantiles.
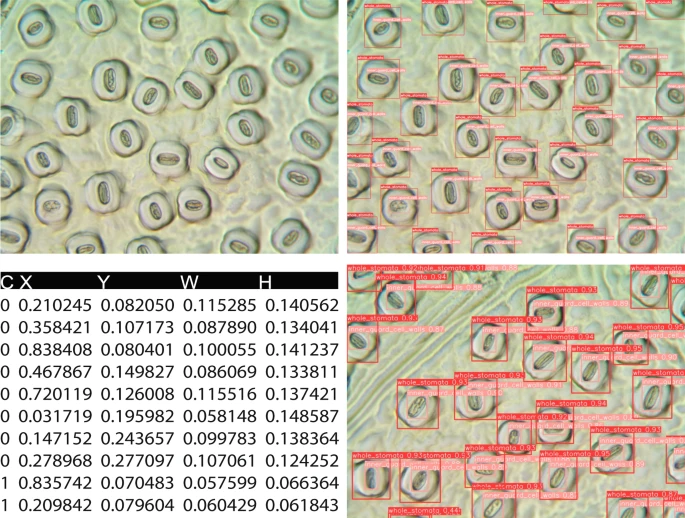
Original and annotated leaf stomatal images and the label file structure. C, X, Y, W, H represent class, x_center, y_center, width, and height of the bounding boxes, respectively. The x_center and y_center are expressed as normalized coordinates that correspond to the center of the bounding box, while width and height are normalized values that represent the relative width and height of the box concerning the dimensions of the image. Note that “C, X, Y, W, H” do not exist in label files, and we used these headings for explanation.
Technical Validation
Images, labels, and data records underwent a rigorous review process to ensure accuracy. The stomatal image dimension (number of pixels in width and height) was verified based on its property information, and the resolution (pixels per 0.1 mm line) was measured and verified using ImageJ software21. To assess and validate the quality of images and labels for model training, the dataset was evaluated using YOLOv7 and YOLOv8 models. Figure 3 presents the results obtained from the testing and validation process. To illustrate, we randomly selected 1,123 images for training, and the YOLOv8 models were trained for 993 epochs, and the most optimal model achieved a precision of 0.99168, a recall of 0.98522, a mean average precision at intersection over union (IOU) = 0.50 (mAP@50) of 0.9915, and a mAP@50–95 of 0.9297.

Training and validation results of YOLOv8 models using our hardwood stomatal image dataset (a), and the model performance (b) and (c). Train/box_loss, train/cls_loss, train/dfl_loss indicate the bounding boxes loss, class loss, and distribution focal loss, respectively, during the training process; Val/box_loss, val/cls_loss, val/dfl_loss represent the bounding boxes loss, class loss, and distribution focal loss, respectively, during the validation process; metrics/mAP50(B), metrics/recall(B) represent the model evaluation metrics, the mAP50 represents mean average precision at intersection over union (IOU) = 0.50, B is used to distinguish the metrics of segmentation (i.e., metrics/precision(B) for detection and metrics/precision(M) for segmentation).
Usage Notes
To prepare the dataset for object detection model training, we recommend uploading the desired images and labels to Roboflow. This platform can be used to verify and correct annotations, convert existing YOLO annotations to other formats, and perform operations such as resizing, grayscale conversion, auto-orientation, and contrast adjustments. The dataset can also be randomly divided into training, validation, and testing subsets. To create a machine learning model that can be applied to a wider range of species, it is advisable to prepare a training image dataset comprising various species, dimensions, magnifications, and image quality. Including images with diverse quality levels, such as noise (i.e., different color points, stain, and patches), blur, or other imperfections, is also recommended. This will enable the model to learn to identify different stomata of different species even in low-quality images.
Once the models are trained, users can extract the detected features and use them to create new indices for assessing stomatal arrangement, operation, and potential functionalities. For instance, the YOLO model’s detected bounding box width and height can be employed for stomatal orientation, estimation of stomatal area, and stomatal area variance13. Additionally, regression models can be constructed to estimate other indices, such as leaf stomatal guard cell and aperture width, length, and area, based on the detected bounding box width, height, and/or orientation. A conceptual diagram of this approach is provided in Fig. 4. Specifically, guard cell length is typically defined as the distance between the tips of the two guard cells surrounding the stomatal pore22. Therefore, to accurately derive the guard cell length from the output of StoManager1, users may need to incorporate the width, height, and orientation of the inner_guard_cell_walls and whole_stomata. One possible approach could be to use the orientation information to determine the angle between the two guard cells and then use trigonometry to calculate the guard cell length based on the width and the height of the bounding boxes measurements. Alternatively, users can build the relationships between guard cell length, width, and the bounding boxes’ width, height, and orientation. We also developed two weighted multivariate linear regression models using bounding boxes’ height and width of inner_guard_cell_walls and whole_stomata as independent variables, which can explain over 81 and 88% variation in measured stomatal guard cell length and width respectively (Fig. 5). Detailed model fitting and plotting can be found in the GitHub repository (https://github.com/JiaxinWang123/ScientificData_Labeled_Hardwood_Images).

Schematic diagram of measuring leaf stomatal guard cell length and width.

Trained weighted multiple linear regression models to estimate guard cell width and length. Models were trained using bounding boxes’ height and width of inner_guard_cell_walls and whole_stomata as independent variables.
Code availability
To ensure that the dataset can be easily reproduced and expanded upon in the future, we have made all the Python and R code used to generate and validate the resource available on a code repository (https://github.com/JiaxinWang123/ScientificData_Labeled_Hardwood_Images). StoManager1’s source code and an online demonstration are available on GitHub (https://github.com/JiaxinWang123/StoManager1), along with a user-friendly Windows application on Zenodo13.
References
Lawlor, D. W. Limitation to photosynthesis in water‐stressed leaves: stomata vs. metabolism and the role of ATP. Annals of botany 89, 871–885 (2002).
Warrit, B., Landsberg, J. & Thorpe, M. Responses of apple leaf stomata to environmental factors. Plant, Cell & Environment 3, 13–22 (1980).
Aphalo, P. & Jarvis, P. Do stomata respond to relative humidity? Plant, Cell & Environment 14, 127–132 (1991).
Casson, S. & Gray, J. E. Influence of environmental factors on stomatal development. New phytologist 178, 9–23 (2008).
Buckley, T. N. How do stomata respond to water status? New Phytologist 224, 21–36 (2019).
O’Shea, K. & Nash, R. An introduction to convolutional neural networks. arXiv preprint arXiv:1511.08458, (2015).
LeCun, Y., Bengio, Y. & Hinton, G. Deep learning. Nature 521, 436–444 (2015).
Redmon, J., Divvala, S., Girshick, R. & Farhadi, A. You only look once: Unified, real-time object detection. Proceedings of the IEEE conference on computer vision and pattern recognition. 779–788 (2016).
Casado-García, A. et al. LabelStoma: A tool for stomata detection based on the YOLO algorithm. Computers and Electronics in Agriculture 178, 105751 (2020).
Ren, F. et al. Identification of plant stomata based on YOLO v5 deep learning model. 5th International Conference on Computer Science and Artificial Intelligence. 78–83 (2021).
Zhang, F., Ren, F., Li, J. & Zhang, X. Automatic stomata recognition and measurement based on improved YOLO deep learning model and entropy rate superpixel algorithm. Ecological Informatics 68, 101521 (2022).
Pathoumthong, P., Zhang, Z. & Roy, S. J. & El Habti, A. Rapid non-destructive method to phenotype stomatal traits. Plant Methods 19, 1–9 (2023).
Wang, J., Renninger, H. & Ma, Q. StoManager1: Automated, High-throughput Tool to Measure Leaf Stomata Using Convolutional Neural Networks. Zenodo https://doi.org/10.5281/zenodo.7686022 (2023).
Fetter, K. C., Eberhardt, S., Barclay, R. S., Wing, S. & Keller, S. R. StomataCounter: a neural network for automatic stomata identification and counting. New Phytologist 223, 1671–1681 (2019).
Hilu, K. W. & Randall, J. L. Convenient method for studying grass leaf epidermis. Taxon 33, 413–415 (1984).
Wang, J., Renninger, H. J. & Ma, Q. StoManager1: Automated, High-throughput Tool to Measure Leaf Stomata Using Convolutional Neural Networks. arXiv preprint arXiv:2304.10450, (2023).
Shin, D.-J. & Kim, J.-J. A Deep Learning Framework Performance Evaluation to Use YOLO in Nvidia Jetson Platform. Applied Sciences 12, 3734 (2022).
Chazhoor, A. & Sarobin, V. R. Intelligent automation of invoice parsing using computer vision techniques. Multimedia Tools and Applications 81, 29383–29403 (2022).
Wang, J. & Renninger, HJ. Labeled 17 Hardwood Species and 55 Genotypes ofPopulusStomatal Images Datasets, figshare, https://doi.org/10.6084/m9.figshare.22255873 (2023).
Wang, J. & Renninger, H. Labeled 17 Hardwood Species and 55 Genotypes ofPopulusStomatal Images Datasets, Zenodo, https://doi.org/10.5281/zenodo.8266240 (2023).
Rueden, C. T. et al. ImageJ2: ImageJ for the next generation of scientific image data. BMC bioinformatics 18, 1–26 (2017).
Spence, R., Wu, H., Sharpe, P. & Clark, K. Water stress effects on guard cell anatomy and the mechanical advantage of the epidermal cells. Plant, Cell & Environment 9, 197–202 (1986).
Acknowledgements
Qin Ma received financial support from the National Natural Science Foundation of China (42201366) and Nanjing Normal University (184080H202B349). This study is a part of the APPS grant (Advancing Populus Pathways in the Southeast) funded by the USDA National Institute of Food and Agriculture (2018-68005-27636) to HJR. This work contributes to the Forest and Wildlife Research Center at Mississippi State University. We thank T. Hall, T. Durbin, A. Gentry, and H. Miles for the leaf collection.
Author information
Authors and Affiliations
Contributions
Jiaxin Wang: Conceptualization, Methodology, Software, Formal analysis, Writing-original draft, Investigation, Writing-review & editing. Heidi Renninger: Supervision, Funding acquisition, Project administration, Writing-review & editing. Qin Ma: Funding acquisition, Writing-review & editing.
Corresponding author
Ethics declarations
Competing interests
The authors declare no competing interests.
Additional information
Publisher’s note Springer Nature remains neutral with regard to jurisdictional claims in published maps and institutional affiliations.
Rights and permissions
Open Access This article is licensed under a Creative Commons Attribution 4.0 International License, which permits use, sharing, adaptation, distribution and reproduction in any medium or format, as long as you give appropriate credit to the original author(s) and the source, provide a link to the Creative Commons licence, and indicate if changes were made. The images or other third party material in this article are included in the article’s Creative Commons licence, unless indicated otherwise in a credit line to the material. If material is not included in the article’s Creative Commons licence and your intended use is not permitted by statutory regulation or exceeds the permitted use, you will need to obtain permission directly from the copyright holder. To view a copy of this licence, visit http://creativecommons.org/licenses/by/4.0/.
About this article

Cite this article
Wang, J., Renninger, H.J. & Ma, Q. Labeled temperate hardwood tree stomatal image datasets from seven taxa of Populus and 17 hardwood species. Sci Data 11, 1 (2024). https://doi.org/10.1038/s41597-023-02657-3
Received:
Accepted:
Published:
DOI: https://doi.org/10.1038/s41597-023-02657-3
