
Abstract
Chemiresistors that are based on monolayer-capped metal nanoparticles (MCNPs) have been used in a wide variety of innovative sensing applications, including detection and monitoring of diagnostic markers in body fluids, explosive materials, environmental contaminations and food quality control. The sensing mechanism is based on reversible swelling or aggregation and/or changes in dielectric constant of the MCNPs. In this protocol, we describe a procedure for producing MCNP-based chemiresistive sensors that is reproducible from device to device and from batch to batch. The approach relies on three main steps: (i) controlled synthesis of gold MCNPs, (ii) fabrication of electrodes that are surrounded with a microbarrier ring to confine the deposited MCNP solution and (iii) a tailor-made drying process to enable evaporation of solvent residues from the MCNP sensing layer to prevent a coffee-ring effect. Application of this approach has been shown to produce devices with ±1.5% variance—a value consistent with the criterion for commercial sensors—as well as long shelf life and stability. Fabrication of chemical sensors based on dodecanethiol- or 2-ethylhexanethiol-capped MCNPs with this approach provides high sensitivity and accuracy in the detection of volatile organic compounds (e.g., octane and decane), toxic gaseous species (e.g., HCl and NH3) in air and simulated mixtures of lung and gastric cancer from exhaled breath.
Introduction
Chemiresistors based on monolayer-capped metal nanoparticles (MCNPs) have been proven to determine and classify a number of diseases from exhaled breath, including lung cancer (LC)1,2,3, colorectal cancer1,4, head and neck cancer1, ovarian cancer1,5,6, bladder cancer1, prostate cancer1,7, kidney cancer1, gastric cancer (GC)1,8,9,10,11, Crohn’s disease1, ulcerative colitis1,12, irritable bowel syndrome1,12, idiopathic Parkinson1,13,14,15, atypical parkinsonism1,14, multiple sclerosis1,16,17, pulmonary arterial hypertension1,18,19,20, preeclampsia1,21, chronic kidney disease22,23, tuberculosis24 and coronavirus disease 201925. The detection and discrimination between these diseases was possible because of a unique profile made of 15 volatile organic compounds (VOCs) that characterized each type. These VOCs are 2-ethylhexanol, 3-methylhexane, 5-ethyl-3-methyloctane, acetone, ethanol, ethyl acetate, ethylbenzene, isononane, isoprene, nonanal, styrene, toluene, decane, octane and undecane. Other studies have shown the effectiveness of MCNP-based sensors for environmental monitoring, i.e., indoor air quality monitoring26, through the detection of benzene, xylene, ethylbenzene and toluene. MCNP-based sensors were applied in smart heating, ventilation and air conditioning control systems, human health monitoring (capnography), home monitoring kits and even growth condition monitoring in greenhouses. Sensors based on MCNPs offer advantages such as (sub-)ppb detection limits of VOCs, a wide dynamic range for detection, ambient room operation, tolerance for interruptive molecules, reasonable dimensions and low cost1,8,10,27,28,29,30,31,32,33,34,35,36,37.
There are many reasons why it is advantageous to design assays around MCNPs, but there are three that are noteworthy here:8,25,30
-
1
The first reason is the versatility in the composition of the MCNP itself, which relates to the presumed ability to synthesize, if not at will, then with much control, nearly any type of MCNP one wishes. Several studies have shown the ability to modify the MCNP’s core type (i.e., Au, Ag, Pd and Pt) as well as the capping ligands (e.g., alkylthiols with C3–C24 chains, ω-functionalized alkanethiolates, arenethiolate and (γ-mercaptopropyl)tri-methyloxysilane, dialkyl disulfides)1,2,3,4,5,6,7,8,9,10,11,12,13,14,15,16,17,18,19,20,21,22,23,24,25. For sensing applications, this feature implies that one can obtain MCNPs with a variety of synergetic combinations of chemical and physical functions, which, in turn, affect the sensitivity and selectivity of the sensors.
-
2
The second reason is the ability to vary the particles’ size and shape and, therefore, the surface-to-volume ratio35,38. For sensing applications, these features allow deliberate control over the domination of surface properties and, consequently, over the interaction ‘quality’ with the analyte molecules27,39. Generally speaking, MCNPs with longer chain lengths present increasing responses and greater sensitivities to many VOCs and humidity levels.
-
3
The third reason is summarized in the ability to prepare films of MCNPs with controllable porous properties35,37. This allows controllable mass transport (e.g., via diffusion), adsorption of analyte molecules within the empty pores, induced swelling of the MCNP films and changes in the permittivity of the medium between the MCNP cores.
MCNPs that rely on a gold nanoparticle core are considered an important candidate owing to their chemical inertness, environmentally benign nature and biocompatibility when functionalized with an appropriate ligand/group of ligands40,41. The versatility in selection of the sensing layer composition (e.g., alkylthiols, dialkyl disulfides, DNA, proteins and alkanethiols) widens the range of the possible targets and application.
Overview for the production of MCNP-based chemiresistors
The production of MCNP-based chemiresistors starts with a synthesis of nanoparticles with specific organic ligands8,42. Methodologically, several approaches has been proposed for the synthesis of MCNPs, including the two-phase42, one-phase43 and water-soluble44,45 approaches. Synthesis is followed by the assembly of thin films made of MCNPs between adjacent microelectrodes36. There are several deposition methods for microelectrodes, such as drop-casting46, layer-by-layer deposition47,48,49, spin coating50, spraying51 and others52,53 Nevertheless, the lack of reproducibility and repeatability and/or the complexity of the device fabrication or packaging of the devices have limited their application to laboratory and research purposes.
The problem of low reproducibility in these devices
The low reproducibility in both production and analytical results is due mainly to uneven evaporation of the MCNP-contained drying drop applied on the surface; as the liquid evaporates, the solid material remaining forms coffee rings and other irreproducible topologies54. This phenomenon occurs despite strict control over printing volume, temperature, relative humidity and surrounding gas atmosphere55,56,57. It is speculated that this coffee-ring phenomenon is caused by the ‘Marangoni’ effect, viz. a process in which the volatile compound evaporates faster near the fluid–substrate contact line55,58,59,60,61,62 In this mechanism, different attraction and repulsion forces create irregular movements of matter within the drying droplet, resulting in nonuniform thickness across the film and/or formation of ‘coffee rings’ in the matured chemiresistors55,63,64,65.
Researchers have made many attempts to solve the irregularity problems of the MCNP-based films as well as the ‘coffee ring’ phenomenon62,66. Nevertheless, the reported approaches have been shown to introduce other complications, as detailed below in the ‘Comparison with other methods’ section.
This protocol addresses this challenge by controlling the synthesis parameters and the use of a microbarrier ring around the electrodes to confine the formation of the MCNP-based sensing layer. The use of the microbarrier could dictate the shape of the drop and hinder the coffee-ring formation, yielding uniform chemiresistors, in terms of both structure and function8.
Comparison with other methods
To overcome the reproducibility challenges in the fabrication of MCNP-based chemiresistors, inkjet printing has been developed and implemented for the deposition of the MCNP solution on top of (micro-)electrodes49,65. Typically, inkjet printing technology is based on thermal or piezoelectric heads that generate droplets in small (0.3 ± 0.02 nl) volumes of ink. This allows deposition of precise ink volumes in predefined locations on the substrate harboring the electrodes67. Nevertheless, there is currently no inkjet printing technique that results in films that are sufficiently uniform for making chemiresistors reproducibly.
One of the solutions to solve the irregularities in the MCNP-based sensing layer relied on the addition of dipolar aprotic and a high-boiling-point solvent, such as 4% (vol/vol) N-methyl-2-pyrrolidone (NMP), to water-based MCNP solution. The formation of a specific contact angle between the printed emulsion and the solid surface influences the extent of the Marangoni effect. This is the contact angle at which evaporation relative to the volume of liquid is maximum. In this way, as the contact line is rapidly deprived of solution, the slower evaporating component of the dual buffer will act in place of the MCNPs and concentrate itself near the contact line of the drying drop57,58,68,69. This approach was found to reduce the pinning effect of the contact line with the substrate and, therefore, the coffee-ring effect64. Yet, water-based solutions are less suitable for the production of functioning MCNP-based chemireisistors because of hydrophobic nature of the ligands. Furthermore, during printing, it is desired to have volatile solvents for fast evaporation.
Anyfantakis et al.70 have shown that the addition of surfactant to the MCNP solution could lead to the transformation of typical coffee rings to fully homogeneous disk-shaped patterns. The effectiveness of the surfactant addition depends on its concentration as well as the nanoparticle/surfactant electrostatic charge. Hu et al.55 have examined the effect of two different organic solvents with different vapor pressures on the quality of the formed MCNP-based films. They found this approach to partly mitigate some of the coffee-ring effects. The result is the formation of two (or more) opposing vortices that affect the in-time and in-space distribution of the MCNPs within the droplet59. These two opposing vortices inhibit coffee-ring pinning55,71,72 and lower the contact angle hysteresis, facilitating lateral actuation of the drying drop.
Experimental design
The fabrication process of the MCNP-based sensors has four main steps: electrode fabrication, monolayer-capped gold nanoparticle (MCGNP) synthesis, inkjet nanoprinting and device conditioning (Fig. 1). For more details, please refer to the ‘Procedure’ section. For the sake of clear presentation, the presentation on the MCNPs will be focused on gold nanoparticles (MCGNPs). The fabrication of electrode arrays involves standard microfabrication methods. Figure 2 presents a flowchart including all steps involved in the development and optimization of the MCGNP-based sensors.

a, MCGNP synthesis by Brust method42. b, Inkjet printing above interdigital electrodes. c, MCGNP on the surface after drying.

MCGNP synthesis, fabrication of electrodes, dispensing procedure, drying in vacuum oven and measuring the sensors’ response after exposure to specific gaseous compounds. In this process, several parameters can be changed, including the MCGNP synthesis, the way the different chemistries and reducing agents are added into the synthesis process, and the structural design of the electrodes. VI, variability index.
Each step can be optimized to find the conditions that result in the highest, most uniform response from the chemiresistors. In the first stage, synthesis optimization was carried out. Here the critical parameters were (i) the MCGNP synthesis temperature and (ii) the injection rate of the reducing agent (Box 1). In the next step, a microbarrier was fabricated and optimized, both in terms of material type and height, to enable most effective confinement of the MCGNP droplet. Then, for each chemistry type, the volume and concentration of the dispensed MCGNP solution as well as the conditioning parameters in a vacuum oven were evaluated. The duration of the conditioning step is critical. This is because insufficient drying would cause a drift in the baseline resistance because of evaporation of solvent residues captured within the film. On the other hand, overdrying could decrease the content of the organic ligands capping the nanoparticles73. This brings the nanoparticles in the film closer to each other and reduces in the overall thickness of the film. All these changes can lead to a substantial decrease in the baseline resistance and a loss of chemical sensitivity73. After conditioning, experiments were done to see how the product responded to exposure to specific VOCs. The parameters that resulted in the lowest VI are selected for use in the chosen application.
Optimizing MCGNP synthesis
The synthesis of the MCGNP was achieved by the two-phase Brust method42. For the sake of clear presentation, the current protocol will be focused on two representative ligands as organic capping layers: dodecanethiol and 2-ethylhexanethiol. The synthesis process starts with the transfer of AuCl4− from an aqueous HAuCl4· 3H2O solution to a toluene layer using a phase-transfer reagent, tetraoctylammonium bromide. Excess thiols are added to the isolated toluene solution, and an aqueous solution of NaBH4 reducing agent is added in large excess. The reaction occurs under vigorous stirring at room temperature (RT, 22–25 °C) for >3 h, producing a dark-brown solution of the thiol-capped gold nanoparticles. The solvent is removed with a rotary evaporator, and the MCGNPs are washed many times in ethanol and toluene36.
To precisely control the MCGNPs’ core size and distribution, which would in turn affect the sensitivity and stability of the formed sensing film, two parameters were optimized: (i) the temperature of the synthesis (−20 °C, +4 °C and +30 °C) and (ii) the injection period of the NaBH4 solution (1 s, 2 min, 3 min and 4 min). For the two represented chemistries, the best performance of sensors was achieved when the synthesis of dodecanethiol took place at 30 ± 1 °C solution temperature and in a 1-s injection period for NaBH4 and at 4 ± 1 °C and in a 30 ± 0.5-s NaBH4 injection period for 2-ethylhexanethiol. More details on the synthesis are outlined in the procedure section below. Transmission electron microscopy (TEM) analysis showed these conditions to produce, respectively, gold nanoparticles with core diameter of 2.4 ± 0.7 nm and 2.2 ± 0.4 nm in the case of dodecanethiol and 2-ethylhexanethiol capping layers (Extended Data Fig. 3).
Preparation of electrodes
In parallel to the synthesis process, electrodes were fabricated on a silicon wafer with 1 µm thermal silicon oxide (SiO2) by two photolithography steps: (i) metal evaporation and (ii) polymer barrier (SU-8) deposition. The interdigitated electrodes are based on titanium (adhesive layer) and platinum. The external diameter of the circular electrode area is 1 mm, and the gap between the electrodes is 10 µm (Supplementary Data 1 and Supplementary Software).
Fabrication and characterization of a microbarrier ring
In this part of the method development, it is important to be able to measure the thickness, cross-section and chemical composition at different places in the dried nanoparticle layer. We do so by atomic force microscopy and/or by scanning electron microscopy (SEM).
Optimization of conditioning without the microbarrier ring
An overall volume of 20 ± 0.3 nl MCGNP solution was deposited via successive injection of 0.3 ± 0.02 nl droplets in the middle of the microelectrodes (1 mm external diameter of the circular electrode and 10 µm gap between the electrodes) using the sciFLEXARRAYER S3 dispenser system (Supplementary Data 1 and Supplementary Software). This volume was selected after an optimization process to assure no solution spillage from the ring. Following a stabilization process74, it was found that the best performance and longest stability could be achieved when the MCGNP layers are conditioned in a vacuum oven at 55 °C for 72 h in the case of dodecanethiol capping ligand (5 mg/ml) and at 55 °C for 48 h in the case of 2-ethylhexanethiol capping ligand (30 mg/ml). Extended Data Fig. 2 shows the topology of the drying droplets producing the sensing layers. As seen in the figure, the layers exhibited a ‘coffee-ring’ topology with varied thickness from 0.3 to 2.5 µm (Extended Data Fig. 2c).
X-ray photoelectron spectroscopy (XPS) analysis, carried out with a Versaprobe III (Physical Electronics) having an AlKα monochromatic X-ray source (hv = 1486.6 eV; 15 kV) with 100 µm diameter, has shown that the different thicknesses of the rings within this topology exhibit different chemical and composition features75,76. For example, the relative concentration of O1s peak, which indicates oxidation process, was found to be higher (20.83%) in the thick area (2.5 µm) than in the (0.3 µm) thin area (3.72%) (Fig. 4d and Supplementary Fig. 16). This difference indicates that thin and uniform layers are desirable for the production of stable sensors.
As a way to achieve reproducible and uniform film with a low percentage of topological irregularities, a microbarrier ring around the electrodes was developed to confine the deposited MCGNP solution during the evaporation process (Fig. 3a). The approach, which adds only a single step to the chemiresistor fabrication process, can be used to produce microbarrier rings from a wide variety of insulating materials, such as SiO2, epoxy or photosensitive polymer (SU-8). Figure 3b,c depicts the production process of the microbarriers from SU-8 and SiO2, respectively.

a–c, Schematic depiction of chips with eight MCGNP-based sensors and a resistor for temperature control, fabrication process of SU-8-made microbarrier (see Supplementary Data 1) (b) and SiO2-made microbarrier (c). d, Microscopic images of sensors based on dodecanethiol-capped gold nanoparticles with and without microbarrier. The dark edges on the outer side of the electrodes are the ring-like barriers.
The efficacy of MCGNP deposition highly depends on the interface between the MCGNP solution and the inner side of the microbarrier ring. We thought that the most important parameter in determining the quality of this interface might be the wetting properties of the interacting surface. This is because the contact line is minimized with the lower-wettability surface during the deposition of the MCNP solution, thus holding the solution within the walls of the ring. The most commonly used method for analyzing surface wetting is to determine the contact angle between the surface and a droplet of the liquid of interest. The contact angles between water droplet with SU-8 and SiO2 were examined using an optical goniometer. As seen in Extended Data Fig. 3a, pristine SU-8 exhibited a high contact angle to water (θ = 90° contact angle77), indicating low hydrophilicity. Treating the SU-8 with oxygen plasma could reduce the contact angle to θ = 35° (Extended Data Fig. 3b). On the other hand, wetting analysis on SiO2 shows high wetting (θ = 180°) (Extended Data Fig. 3c), indicating high hydrophilicity. To gain more insight into the MCGNP–substrate interface, the microbarrier structure between the two materials was examined by SEM. Extended Data Fig. 4a,b shows that the edge of the microbarrier made from SiO2 is rough and uneven, probably due to the lift-off process. Conversely, the edge shape of the microbarrier made of SU-8 polymer is straight and vertical to the underlying substrate (Extended Data Fig. 4c,d). Overall, these characterizations indicate that microbarriers made of SU-8 are advantageous, mainly because of their superior ability to hold the MCGNP solution, thus preventing any ‘spillover’ and/or migration of the deposited MCGNP droplet.
To evaluate the effect of the microbarrier on the sensing performance, several sets of MCNGP-based chemiresistors were prepared: without microbarriers and with SiO2 or SU-8 microbarriers. Each set included several chips, each with eight electrodes, viz. sensors. Each electrode in the aforementioned set was injected with 40 nl or 20 nl droplet volume (Supplementary Information). Figure 4a,d shows light-microscopy images of chemiresistors that were prepared, respectively, by injection of 40 nl 2-ethylhexanthiol-capped and dodecanethiol-capped gold nanoparticles without use of any microbarrier. As seen in the figure, the deposited layers were nonuniform with flow outside the external border of the electrodes. The addition of a SiO2 microbarrier (Fig. 4b,e) partially restricted the flow of the printed emulsion at the time the existence of the SU-8 microbarrier (Fig. 4c,f) held the MCGNP drop strictly within its borders and unified the morphology of the resulting sensing layers. To evaluate the effect of the MCGNP film morphology on the sensing response, each set of sensors was exposed to escalating doses of octane. Each exposure dose included 5 s entrance of the specific concentration of simulation gas (i.e., n-octane), 5 min exposure to the simulation gas (closed chamber, no valves open) and 5 min vacuum. For more details, please refer to Steps 72–81, in the ‘Measuring the sensors’ response’ section of the Procedure.

a–c, The chemiresistors were prepared by depositing 40 nl 2-ethylhexanethiol-capped gold nanoparticles (20 mg/ml) on electrodes without a microbarrier (a), with a SiO2 microbarrier (b) and with a SU-8 microbarrier (c). d–f, For comparison, similar image formats are presented for chemiresistors prepared by deposition of 40 nl dodecanthiol-capped gold nanoparticles (5 mg/ml) on electrodes: without microbarrier (d); with SiO2 microbarrier (e); and with SU-8 microbarrier (f). Sensing responses to octane were achieved after drying in a vacuum oven at 55 °C for 48 h in the case of 2-ethylhexanethiol-capped gold nanoparticles and at 55 °C for 72 h in the case of dodecanethiol-capped gold nanoparticles.
As seen in Fig. 4, the addition of the microbarrier rings increased the uniformity of the sensing responses of the fabricated sensors. Indeed, the VIs for 2-ethylhexanthiol changed from 7.8% in the case of the bare electrodes (i.e., without microbarrier) to 5.6% for the SiO2 microbarrier, and to 1.6% in for the microbarrier made of SU-8. Consistently, the VI for dodecanethiol-capped gold nanoparticles decreased from 12.6% of the bare electrodes to 2.5% for the microbarrier made from SU-8 polymer (Fig. 4c,f).
Optimization of the microbarrier height
Evaporation of solution at small scales depends heavily on the characteristics of the thin surface–tension-driven interface effects. Therefore, the effect of the microbarrier height on the evaporation of MCGNP solution droplet as well as on the obtained quality of the sensing layer was examined (Extended Data Fig. 5). Optimizing the physical parameters of the ring for different chemistries is carried out by looking for the lowest possible VI while keeping the amplitude as high as possible. Since there is a trade-off between VI and magnitude of response, they are presented side by side in Extended Data Fig. 5. (Note that the amplitude is ∆R/Rb and is denoted as percentage.)
In this context, different microbarrier heights (2.4, 5.5 and 17 µm) were evaluated. Figure 4 and Extended Data Fig. 6a show that sensors prepared from 40 nl solution of 2-ethylhexanethiol-capped gold nanoparticle in 2.4 µm and 5.5 µm microbarrier heights exhibit good VIs (1.3% and 1.6%, respectively). On the other hand, the microbarrier height affected the sensing response substantially, as expressed in its amplitude. As seen in Extended Data Fig. 6b, the response amplitude of the 2.4 µm microbarrier height was 0.31%, whereas the response amplitude in the case of the 5.5 µm microbarrier height was 0.77%. To determine the source of these differences, complementary analysis was carried out. Figure 10c shows that dodecanethiol-capped gold nanoparticles printed in 2.4 µm and 5.5 µm microbarrier heights had similar VIs (2.5% and 2.6%, respectively). However, each barrier height worked best with a different printed volume. A droplet volume of 40 nl worked best for a 2.5 µm barrier, and a droplet of 120 nl worked best for a 5.5 µm barrier. Interestingly, the amplitude (Extended Data Fig. 6d) showed a trade-off between the two microbarrier heights. If 40 nl was printed on a 2.5 µm ring, an amplitude of 0.41% could be reached; however, when printing 120 nl on a 5.5 µm ring, an amplitude of 1.14% could be reached. Overall, these results indicate that the coffee ring on the surface can be prevented and the best sensing performance can be achieved when the height of dropped solution is strictly the same as the barrier height.
Stability and storage conditions
Storage conditions
Different storage conditions can affect the configuration of the MCGNP films as well as the stability and the amplitude of the sensing signals. To identify the most suitable conditions to store the sensors for a long time, storage conditions were evaluated in different conditions for a period of 9 months. Sensors were stored and sealed in aluminum-laminate pouches using an aluminum bag sealer (MeC Impulse Sealer) and a needle (BD Microlance 3) in three conditions: (i) vacuum at 300 mbar; (ii) nitrogen at 99.9998% purity and (iii) room air at 18 °C and 40 ± 2% relative humidity.
The evaluation of the stability was carried out upon exposure to 272 ppb of 1-methylnaphthalene in nitrogen for three repetitions at different time points during the 9-month period. Each repetition included a cycle of 5 s for entrance of the simulation gas (i.e., 1-methylnaphthalene), 5 min of exposure to the simulation gas (closed chamber, no valves open) and 5 min of vacuum. This cycle is repeated three times with the same concentration and conditions. For the sensing response analysis, ΔRend/Rb (where ΔR is the difference between the resistance before and at the end of the exposure to 1-methylnaphthalene and Rb is the baseline resistance) was used.
Extended Data Fig. 7 summarizes the change in the ΔRend/Rb during the various storage conditions of 24 dodecanethiol-capped gold nanoparticle sensors as a representative example. As seen in the figure, the change in the room air storage condition (35%) after a 9-month period was significantly larger than that in the vacuum and nitrogen conditions (19% and 17%, respectively). Moreover, the variances between the sensors’ reading under room air and nitrogen storage, as can be seen by the height of the boxes, were larger than those in vacuum condition. These results can be understood intuitively, as the presence of compounds in the room air condition (for example oxygen and humidity) can have negative effects on the interactions of the ligands of the capped gold nanoparticles as well as their organization. Storage in nitrogen showed higher variances than in vacuum, making it the best candidate for storing capped gold-nanoparticle sensors. Nitrogen can present a second option, or a combination of both, if high vacuum is not available. If nitrogen is chosen, it is important to ensure that the purity is high, reaching at least 99.999% as has been used in this experiment.
Lifetime
The lifetime of a sensor array is most commonly defined as the time to the first sensor node failure. To examine this aspect in the context of MCGNP-based sensors, a series of repetitive tests was carried out. It consisted of 45 measurement cycles per day (10 min each) × 5 d/week × 9 weeks, bringing it to a total of 2,025 measurements. On each measuring day, the sensors were taken out of the desiccator and placed in the analysis chamber. During this short transfer period, the sensors were exposed to air in the laboratory (~ 18 °C, 40% relative humidity), after which they were examined under successive cycles of 272 ppb exposure to 1-methylnaphthalene. Figure 5b presents the flowchart of the measurement in the evaluation process of the lifetime aspect of the sensors. Figure 5c,d shows the ΔRend/Rb values of the sensors. As seen in the figure, the sensors have high responsivity on the first 25 d of exposure, i.e., a total of ~1,500 cycles. After this period (on day 26), the noise becomes very high, and therefore, the sensor has to be exchanged.

a, Typical sensor response to increasing concentrations of VOC. b, Flowchart of the measurement steps. c,d, ΔRend/Rb response of dodecanethiol-capped (c), and 2-ethylthexanethiol-capped (d) gold nanoparticle sensors upon exposure to 272 ppb 1-methylnaphthalene.
Chemical stability
To check the influence of exposure to hazardous substances, the MCGNP sensors were exposed to NH3 and HCl. The exposure of the devices caused no major direct changes in the absolute values of the base resistance of the MCGNP sensors (Fig. 6a). Figure 6b–e visualizes the exposure effect on the response of the MCGNP sensors. While for the 2-ethylhexanethiol-capped gold nanoparticle sensor the response to acetaldehyde is slightly increased after exposure to NH3 (Fig. 6c), the 2-ethylhexanethiol-capped gold nanoparticle sensor exhibited opposite behavior, showing a decreased response after NH3 exposure (Fig. 6b). After exposure to HCl, the response of the 2-ethylhexanethiol-capped gold nanoparticle sensor was not significantly changed (Fig. 6e), while the dodecanethiol-capped gold nanoparticle sensor showed a slightly increased response (Fig. 6d).

a, Base resistance of MCGNP-based chemiresistors before and after exposure to NH3 and HCl. b,c, Sensing response of dodecanethiol-capped (b) and 2-ethylhexanethiol-capped (c) gold nanoparticle sensors to 500 ppb acetaldehyde before and after exposure to NH3. d,e, Sensing response of dodecanethiol-capped (d) and 2-ethylhexanethiol-capped (e) gold nanoparticle sensors to 500 ppb acetaldehyde before and after exposure to HCl. Error bars show the standard deviation of four measurements each.
Application of the method
Recognition of chemicals can be achieved by selective detection of (pre-)identified chemicals in the presence of an interfering gaseous species or background, using a highly selective receptor designed especially for the targeted VOC29,30,34,78. This group of sensors requires laborious identification of the targeted VOC in the presence of interfering background as well as synthesis of a highly selective nanomaterial for each VOC of interest79. There are several examples of selective sensing of chemicals, including detection of acetone74,80,81,82, alkythiols37,51,83, alkylamines84 para-thiophenols85, carboxylates86 and others30,87,88,89,90,91. Still, selective MCNP-based sensors are programmed to detect specific individual targets, thus hindering the extension for detecting complicated (VOC) mixtures. An additional limitation stems from the need to synthesize separate, highly selective nanomaterials for each VOC to be detected.
An emerging strategy that is complementary to the selective sensing approach is cross-reactive (i.e., semiselective) sensor arrays in combination with pattern recognition92, which are sensitive to a broad spectrum of chemical patterns. In contrast to the selective sensing method, this approach is more suitable for rapid diagnostic methods in which evaluation of a chemical compendium is qualitative and semiquantitative91,93,94, while achieving selectivity through pattern recognition93,95,96.
To demonstrate the efficacy of the fabricated chemiresistors toward detection of VOCs, dodecanethiol- and 2-ethylhexanethiol-capped gold nanoparticle-based sensors were individually exposed to four VOCs (2-ethylhexane, isopropyl alcohol (IPA), octane and trimethylbenzene) at a concentration of 15 ppm. Principal component analysis (PCA)93 was then used to analyze the obtained signals. PCA is a statistical method to effectively reduce the multidimensional data space to its main components to allow convenient visualization of the differentiation ability of the sensor array. PCA determines the linear combinations of the sensor values so that the maximum variance between all data points can be obtained in mutually orthogonal dimensions. As shown in Fig. 14a, the first and second principal components for each VOC are drawn; the two types of sensors have different responses to the different VOCs. Figure 7b shows the PCA analysis; the results yield well-defined clusters with no overlap between the four VOCs.

a, Response of dodecanethiol-capped and 2-ethylhexanethiol-capped gold nanoparticle chemiresistors to 15 ppm 2-ethylhexane (2EH), IPA, octane and trimethylbenzene (TMB). b, PCA of the produced exposure datasets.
As an additional demonstration, the performance of dodecanethiol- and 2-ethylhexanethiol-capped gold nanoparticle sensors were evaluated in their ability to distinguish between simulated-breath biomarkers between LC (n = 170; 118 ppm average concentration of decane) and the equivalent healthy controls (HLC; n = 168; 0.5 ppm average concentration of decane) (Fig. 8a). Additional evaluation was carried out in the ability to distinguish between GC (n = 168; 117 ppm average concentration of 2-butanone) and the equivalent healthy controls (HGC; n = 168; 7 ppm average concentration of 2-butanone) (Fig. 8b). The concentration of the simulated-breath biomarkers was determined based on gas-chromatography–mass-spectrometry (GC-MS) analysis of real breath samples of LC, HLC, GC and HGC. The letter ‘n’ stands for the number of people whose breath samples were analyzed to extract the average concentration of the disease biomarker. Exposure to the breath samples or the calibration compounds resulted in rapid and reversible changes of the sensors’ electrical resistance. Breath components were identified from the time-dependent resistance response of each sensor. Each sensor responded to all (or to a certain subset) of the VOCs found in the exhaled breath samples. Breath patterns were obtained from the collective response of the sensors by applying discriminant factor analysis (DFA). The DFA output variables constitute mutually orthogonal dimensions. We divided the dataset of each analysis into training (70% samples) and test sets (30% samples). Leave-one-out cross-validation was used to calculate the classification success in terms of the numbers of true positive, true negative, false positive and false negative predictions. Given k measurements, the model was computed using k − 1 training vectors. Receiving operating characteristic analysis was used to test the performance of the training set data and to calculate the cutoff values. For the LC versus HLC comparison, the results exhibited 100% accuracy in the training phase, 100% accuracy in the validation phase and 100% in the blind analysis phase. For the GC versus HGC comparison, the results exhibited 97.9% accuracy in the training phase, 100% accuracy in the validation phase and 100% in the blind analysis phase.

a,b, The outputs were obtained from: simulated breath biomarkers between LC (n = 170; 118 ppm average concentration of decane) and the equivalent healthy controls (HLC; n = 168; 0.5 ppm average concentration of decane) (a); and simulated breath biomarkers between GC (n = 168; 117 ppm average concentration of 2-butanone) and the equivalent healthy controls (HGC; n = 168; 7 ppm average concentration of butanone) (b). Note: DFA is a supervised classification method. Using a linear combination of the input variables, DFA finds new orthogonal axes (canonical values) to minimize the variance within each given class and maximize variance between classes.
Challenges and opportunities
In the current protocol, we eliminate the uneven drying related to formation of the coffee rings by adding a physical microbarrier around the drying drop. The addition of the microbarrier ring is, therefore, speculated to eliminate the formation of a typical contact angle and, in this way, allow a more even evaporation across the drying drop. Nevertheless, if this speculation holds true, the volume of the drop needs to be proportional to the height of the microbarrier ring. Interestingly, our results are consistent with this hypothesis, showing that for each specific organic modification of the MCGNP solution, a specific volume and microbarrier height calibration is needed.
In the functional realm, avoiding the formation of coffee rings translates to a more consistent response of the resulting chemiresistor devices (Fig. 7). Indeed, some device-to-device differences will inevitably remain dependent on the precision of the analysis; yet, a marked reduction in the level of this variability is evident after addition of this microbarrier ring. This observation is consistent throughout many different modifications and seems to be independent of the gas stimuli to which the sensors respond. The presence of the microbarrier ring also holds the drying drop together and physically prevents slideover and spillover. By dictating the precise location and restricting the widening of the drying drop, it also forces aspects of its surface topology as a cured device. The capacity of this restriction may be dependent on the hydrophobicity of the material of which the microbarrier is made. Both these aspects described above contribute to the enhanced functional reproducibility of the printed devices. It is therefore up to future research to specifically analyze the different forces that are altered by the addition of the microbarrier ring. Whatever the mechanism is, this simple and practical addition has made an immense contribution to fabricating the reproducible device and will thus be used in any further investigations we conduct in the future.
One of the challenges that could affect the repeatability in the device fabrication is the variation in controlling the synthesis conditions (e.g., temperature and reducing agent injection rate). It is important to maintain the same temperature and stirring rate during synthesis. In some syntheses, the MCGNPs do not dissolve directly with ethanol in the precipitation step, and therefore a methanol solution can be used. Another possible challenge is the control of humidity during inkjet printing. Variances in humidity could affect the uniformity of the drops during and after printing, which could cause problems in fabrication and mass production of chemiresistors. After inkjet printing, the process for drying the devices in a vacuum oven needs to be optimized. The optimized time is determined by evaluating the sensor performance upon exposure to VOCs and analyzing the VI and response behavior.
Materials
Reagents
-
Silicon wafer, 4 in diameter, ~500 μm thickness, one side polished, type/orientation NP<100>, PB<100>, resistivity 1–10 Ω-cm, 1000 nm thermal SiO2 (NOVA Electronic Materials, item. no. 7375-OX)
-
Photoresist SU-8 2002 (Microchem, CAS no. T111029)
Caution
Wear safety glasses, gloves and protective clothing when handling this material. Adequate ventilation is highly recommended to avoid breathing in the vapors or mist.
-
Photoresist developer (PGMEA; Microchem, CAS no. 108-65-6)
Caution
Wear safety glasses, gloves and protective clothing when handling this material. Adequate ventilation is highly recommended to avoid breathing in the vapors or mist. Keep away from oxidants, sparks and open flames.
-
Image Reversal Photoresist AZ-5214E (MicroChemicals, CAS no. 220986)
Caution
Wear safety glasses, gloves and protective clothing when handling this material. Adequate ventilation is highly recommended to avoid breathing in the vapors or mist. Keep away from oxidants, sparks and open flames.
-
Photoresist AZ-4233 (MicroChemicals, CAS no. 220986)
Caution
Wear safety glasses, gloves and protective clothing when handling this material. Adequate ventilation is highly recommended to avoid breathing in the vapors or mist. Keep away from oxidants, sparks and open flames.
-
Tetramethylammonium hydroxide (TMAH; for AZ photoresist developing, 10% (wt/wt) solution in water; Sigma, CAS no. 75-59-2)
-
1-Methyl-2-pyrrolidinone (NMP; for PDMS etching, 99+% A.C.S. reagent; Sigma, CAS no. 443778)
Caution
Wear safety glasses and impervious clothing. Handle the compound with gloves. This chemical can cause skin and eye irritation.
-
IPA (Gadot, CAS no. 67-63-0)
Caution
Flammable.
-
Acetone (Gadot, CAS no. 67-64-1)
Caution
Flammable.
-
Sodium borohydride ReagentPlus, 99% BH4•Na (Sigma, CAS no. 16940662)
-
Tetraoctylammonium bromide 98% (TOAB) [CH3(CH2)7]4N Br (Sigma, CAS no. 14866332)
-
Gold(III) chloride trihydrate ≥99.9% trace metals basis HAuCl4•3H2O (Sigma, CAS no. 16961254)
-
Dodecanethiol ≥98% CH3(CH2)11SH (Sigma, CAS no. 112550)
-
2-Ethylhexanethiol ≥97% C8H18S (Sigma, CAS no. 7341-17-5)
-
Deionized destilled water (DDW; Milli-Q, cat. no. Z00QSV0WW)
-
Ethanol (absolute) ≥99.8% (BioLab, cat. no. 64175)
-
Toluene C7H8 [Isomers] 99.8% (BioLab, cat. no. 108883)
Caution
Flammable. Irritant to eye, skin and respiratory tract. Wear gloves and goggles, and use a properly ventilated chemical hood when handling.
-
N-octane (Sigma, CAS no. 111-65-9)
-
2-Ethylhexanol (Sigma, CAS no. 104-76-7)
Caution
Flammable and unstable explosives. Wear gloves and goggles and use a properly ventilated chemical hood when handling.
-
Dimethyl sulfide (Sigma, CAS no. 75-18-3)
Caution
Flammable.
Equipment
Clean room equipment
-
Hot plate (Prazitherm, Harry Gestigkeit, cat. no. 16271017)
-
Headway Resist Spinner (Laurell Technologies; model RWM32)
-
Contact mask aligner (Karl Suss MicroTech; model MA-6)
-
Soda-lime photolithography masks (substrate size 5′:127.0 ×127.0 mm; Technion)—two masks: one for electrode array photolithography, the other for creating the microbarrier using photosensitive polymer SU-8 (Supplementary Data 1 and Supplementary Software)
-
Optical microscope (Olympus Optical, model BX60F-3)
-
Plasma descumming system (Axis HF-8 Multimode)
-
E-beam evaporation system (Evatec, cat. no. BAK-501)
-
Ultrasonic Cleaning Bath, S30 (Elmasonic)
-
Dicer machine DAD 3350 (Disco; serial no. KB4725), dicing tape 80 µm
-
Tweezers (Rubis, 2A-SA, cat. no. 2-8028-09; 2A Axal, cat. no. 2-5149-09; F Axal, cat. no. 2-5149-20)
Wet lab equipment
-
Desiccator vacuum, lab companion cabine (Scienceware, cat. no. BAF424004021-1EA)
-
Dishes, crystallizing, 140 × 75 mm (Pyrex; Technion, cat. no. 110000705)
-
Petri dishes, complete 150 × 30 mm (Pyrex; Technion, cat. no. 110000757)
-
Round-bottomed flask (Duran, cat. no.21741440)
-
Digital pipettes, (Gilson NEO, P100 cat. no. F123615, P200 cat. no. F123601, P1000 cat. no. F123602)
-
Pipette tips, Yellow 20–200 µl (Corning, cat. no. 4866)
-
Separatory funnels (Kemtech America Synthware, cat. no. 31-501-630)
-
Weights (Kern, cat. no. WB1010788)
-
Evaporator, Hei-VAP Advantage (Heidolph, serial no. 200362253)
-
Vacuum pump (Labotal; MZ 2C NT, serial no. 104539206)
-
Digital hotplate stirrer, ‘witeg’ WiseStir, SMHS systematic multi-hotplate stirrers, 6- places, ceramic-coated plates, independent heating and stirring control, back light LCD, up to 350 °C, 80–1,500 rpm; stirring magnet(s): PTFE (Witeg Labortechnik, item no. DH.WMH03506)
-
Precision Balance (Precisa, cat. no. LX-220A)
Test, printing and other equipment
-
Dispensing system with piezoelectric nozzle (Scienion, model sciFLEXARRAYER S3)
-
Vacuum oven, ThermoStable OV (WOV) series (Daihan Scientific, cat. no. 2268)
-
Multimeter/data acquisition/switch system, Keithley model 2701 multifunction switch (Tektronix)
-
Transmission electron microscope, Tecnai T12G2 (FEI, model Tecnai G2 T20 S-Twin)
-
Respirator mask with filter (Scott Safety, cat. no. A1B1E1K1-P2/P3)
-
Vacuum pump (Edwards, cat. no. XDS5 A72501903)
-
Stainless steel chamber (home-made, Technion) with a volume of 100 cm3
-
Computerized calibration system (Umwelttechnik MCZ, Germany), model CGM 2000 (serial no. 1101-011)
-
Nitrogen generator, model M-30 (On Site Gas)
Software
-
CleWin
-
LabVIEW National Instruments
-
MATLAB
Procedure
Electrode array microfabrication in clean room conditions
Timing 6–8 h (depends on number of wafers)
Critical
Steps 1–25 must be performed in a clean room facility (for this work, a class 1,000 (ISO 6) with a class 100 (ISO 5) work area was used). Steps 1–14 were performed for nine wafers (4 in), each of which consist of 21 devices of eight sensors. This is maximum batch capacity for the Evatec BAK-501 evaporation system.
-
1
Clean the silicon wafer in an acetone bath with sonication for 5 min. Rinse the wafer with clean acetone, methanol and then isopropanol. Dry it by spinning at 3,500 rpm for 1 min. Inspect the wafer by optical microscope.
Critical step
If the storage conditions of the wafers are unknown or questionable, this cleaning step is necessary. If you know that the silicon wafer is clean, you can start the process without any precleaning.
-
2
Bake the wafer on a hot plate at 290 ± 10 °C for 5 min for dehydration and vaporization of any solvents, and then let the wafer cool to RT for 5 min.
-
3
Place the wafer in the center of the supporting chuck of the spin coater, and make sure that it sticks by applying a vacuum. Set the spinner parameters to 5,000 rpm for 1 min, with an acceleration of 10 m/s2. Dispense 2 ml of photoresist AZ-5214 on the center of the wafer and spin immediately. Note: any other negative resist that is suitable for lift-off processes could be used.
-
4
Prebake the photoresist on a hot plate at 110 °C for 1 min.
-
5
Clean the mask with the electrode array patterns (for the design of photolithography mask, see Supplementary Data 1 and Supplementary Software) in N-methyl-2-pyrrolidone and then in hot PRS-2000 solution (70 °C) during 10 min, wash with DDW water for 1–2 min. Dry the mask at 2,000 rpm for 1 min.
-
6
Load the mask and the silicon wafer into the mask aligner. Expose the wafer under i-line UV light at 365 nm and at an intensity of 14.5 mW/cm2 for 1.5 s to form the electrode array patterns. Note: the exact conditions will depend on the equipment used, the thickness of the photoresist and its thermal history. Use the MicroChemicals datasheets as a guideline.
-
7
Place the wafer on a hot plate for a postexposure bake at 120 °C for 1 min.
-
8
Expose the wafer at an intensity of 14 mW/cm2 for 9 s, without using a mask.
-
9
Develop the photoresist for 30 s using 10% (vol/vol) TMAH developer, and then wash it in DDW for 1–2 min. Dry the wafer by spinning at 3,500 rpm for 1 min.
Critical step
Check the thickness of the photoresist by profilometry. It should be >1.2 µm so that the lift-off process that follows will be effortless. Metal deposition by the lift-off method is recommended.
-
10
Check the wafer under the microscope to verify whether the patterns have developed properly.
Critical step
Check the patterns with an optical microscope. If the resist is not completely removed from the exposed areas, place the wafer back into the developer and apply further development in steps of 10 s, after which you should rinse, dry and check it again with the microscope until full development.
-
11
Use oxygen plasma descumming system for surface treatment before metal evaporation for better metal adhesion. Place the wafer in the chamber of plasma system for 1 min. Keep the pressure at 200 mTorr and the power at 100 W.
Critical step
If the chamber is not cleaned before etching the wafer, unwanted substances (depending on the previous etching process) can be deposited on the wafer surface, making it unusable.
-
12
Load the wafer into the evaporator system face down, and activate the pump. Wait until the vacuum is at least as low as 2 × 10⁻⁷ Torr. Set the parameters for metal evaporation. The thickness of first layer (titanium) is 20 nm, and the evaporation rate is 2 Å/s. The thickness of the second layer (platinum) is 130 nm, and the evaporation rate 4 Å/s. Start the evaporation. Check the rate and temperature during the evaporation.
Critical step
The metal deposition should be performed by E-beam evaporation system under high vacuum (4 × 10⁻⁷ Torr or less).
-
13
Soak the wafer in a beaker with acetone and sonicate it for 2–5 min for the metal lift-off process. Rinse it with clear acetone, methanol and isopropanol. Inspect the wafer with electrode arrays under an optical microscope. If it is clean, wash it with DDW and dry; otherwise, repeat the sonication with acetone.
Critical step
Keep the wafer wet between the rinsing and during inspection under the microscope.
-
14
Inspect the electrode array and contact pads for defects under an optical microscope.
Microbarrier (ring) fabrication
Timing 2 h for three wafers
Figure 3a shows a schematic flow diagram of microbarrier fabrication (Steps 15–24).
-
15
Heat the wafer on a hot plate at 120 °C for 5 min for dehydration and solvent vaporization. Then, let the wafer cool down to RT for 2 min.
-
16
Place the wafer in the center of the spinner chuck, making sure it sticks by applying vacuum. Dispense 2 ml SU-8 2002 at the center of the wafer, and run the following spin-coating program: spin the wafer at 500 rpm with acceleration of 50 rpm/s for 10 s to allow the resist to spread, ramp the speed up to 2,000 rpm with acceleration 200 rpm/s, hold it for 30 s and then ramp it down.
-
17
Bake the photoresist on a hot plate at 95 °C for 2 min.
-
18
Clean the mask for microbarrier patterns (for the design of the mask, see Supplementary Software and Supplementary Data 1) in NMP and then in hot PRS solution (700 °C) for 10–15 min, wash it with DDW for 1–2 min and dry the mask at 2,000 rpm for 1 min.
-
19
Load the clean mask on a mask holder of a mask aligner (Karl Suss MA6). Place the wafer on a holder of the mask aligner, then expose the wafer to an intensity of 14 mW/cm2 for 6 s (84 mJ/cm2).
-
20
Develop the photoresist for 1 min using PGMEA developer, then rinse and wash it with IPA.
-
21
Place the wafer on a spinner, and dry it by spinning at 5,000 rpm for 60 s.
-
22
Use an optical microscope to inspect the cleanliness of the substrate after SU-8 development.
Critical step
The surface of the electrodes and anything between them must be completely clean.
-
23
Measure the height of the SU-8 microbarrier by alpha step.
-
24
Cure the SU-8 patterns on a hot plate by the following program: start on a cool plate (22 °C), then heat up to 150 °C, and hold it for 15 min.
Dicing
Timing 2 h (for three wafers)
-
25
Protect the wafer by coating it with photoresist AZ-4533. Put the wafer in the center of the spinner. Activate the vacuum of spinner. Set the spinner parameters to 5,000 rpm for 1 min with an acceleration rate of 10 m/s2. Dispense 2 ml photoresist AZ-4233, and spin it. Bake the wafer at 110 °C on a hot plate for 1 min.
-
26
Attach the dicing tape on a dicing frame (80 µm). Place the wafer at the middle of the frame, and put the frame on the dicing holder.
-
27
The dicing is executed by dicer machine DAD 3350. Set the typical recipe, and enter the correct parameters required for dicing (Supplementary Manual 1).
-
Channel 1 = 15.0 mm
-
Channel 2 = 15.3 mm
-
Align the wafer
-
Check the number of lines for cutting
-
Choose the dicing direction, then start cutting
-
Turn the wafer to 90°, and resume the cutting
-
-
28
Rinse the wafer in acetone, methanol and IPA using only sprayer. The wafer remains on blue tape for this washing step. Then, dry it on a spinner or with pressurized hydrogen.
Critical step
Confirm that the wafer is clean using an optical microscope.
-
29
Store the devices on tape in a vacuum desiccator.
Synthesis of 2-ethylhexanethiol-capped gold nanoparticles
Timing 30 h (Extended Data Fig. 8 and Supplementary Data 3)
-
30
Activate the digital stirrer to 800 rpm. Place an iced water bath on the stirrer plate.
Critical step
Using thermometer, check the bath temperature (should be at 4 °C). The round-bottom flask will be kept under these conditions during the synthesis.
-
31
Gold salt solution preparation. Dissolve 3.1 mg HAuCl4 × H2O in 25 ml DDW. HAuCl4 × H2O should be transformed to a glass vial using a plastic or Teflon spatula. Then, 25 ml of DDW should be measured using a volume-measuring funnel. Mix the HAuCl4 × H2O in DDW by shaking the vial. The color of the solution should be transparent yellow.
-
32
Tetraoctylammonium bromide (TOAB) solution preparation. Dissolve 0.15 g TOAB in 80 ml toluene. Toluene is measured with a volume-measuring funnel. Then, transfer to a round-bottom flask of 500 ml volume. TOAB is measured on weighing paper and transferred directly into the toluene solvent in the round-bottom flask. Add a stirring bar. Stir the mixture for 10 min at RT and 800 rpm; the solution should be transparent.
-
33
Transfer of gold salt to toluene. Transfer AuCl4 (Step 31) from aqueous HAuCl4 × H2O solution (Step 32) to a toluene solution by the phase-transfer reagent TOAB. Mix both solutions in a separating funnel. After separation, the organic phase is on the top and is brown in color. The aqueous phase on the bottom should be transparent. Discard the aqueous phase, and use the organic phase for the next step.
-
34
Transfer the content of HAuCl4 with TOAB in toluene into a round-bottom flask (at 4 °C), and stir it vigorously at 800 rpm with a magnetic stirring plate and stirrer. Then, add 15.2 µl of 2-ethlhexanethiol using a digital pipette by fast injection.
Caution
Handle the 2-ethlhexanethiol under a chemical hood. Keep the pipette and the gloves in the hood for a few hours.
-
35
Reducing agent preparation. Measure 25 ml of DDW using a volume-measuring funnel. Transfer DDW to a vial, and cool it with ice for 10 min. Then, dissolve 380 mg (in a glass vial) of NaBH4 (0.4 M) using the cooled water. Mix the solution by shaking. Use this solution immediately after mixing.
-
36
Nucleation and growth of gold NPs. Add ice-cold NaBH4 solution from Step 35 into the HAuCl4–TOAB in toluene solution (Step 34) at 4 °C, 800 rpm of magnetic stirring plate.
Caution
NaBH4 is a very strong reducing agent. It requires safety equipment such as gloves and safety googles.
-
37
Leave the reaction to stir at 800 rpm at 4 °C for at least 3 h. Extended Data Fig. 9 shows the general reducing reaction for gold reagent using a stirring system for degrees including stabilizer and reducing reagent.
Critical step
It is important to maintain the same temperature and stirring rate during synthesis by mixing ice and water in the reaction bath.
-
38
A purification step of the MCGNP solution starts with separating the water and organic phases by using a separating funnel. The organic phase is the upper dark-brown phase, and the lower transparent phase is water. Drain the water phase, and discard it.
-
39
Transfer the organic phase from the separating funnel (containing the gold nanoparticles) to a round flask of 500 ml.
-
40
Connect the flask to a rotary evaporator according to the instructions (bath at 40 °C, rotating speed 140–170 rpm). Usually, it takes ~15–20 min to evaporate the entire 80 ml toluene. At the end of the procedure, there should be no solvent and only nanoparticle residuals.
-
41
Separate the flask from of the evaporator according to the instrument instructions.
-
42
Put 1 ml toluene in the flask, and mix until all the MCGNPs are in solution.
-
43
Add 400 ml ethanol, and store it for overnight (18–20 h) to slowly precipitate the nanoparticles out of toluene.
-
44
Transfer all the liquid content into centrifuge bottles. Centrifuge for 10 min at 3,000 rpm. At the end, a nanoparticle (NP) pellet should be stuck to the walls of the bottles.
-
45
Discard the solvent. After the NPs are dry on the walls of the bottles, dissolve them again in toluene.
-
46
Take a small round flask (25 ml), weigh it and record its weight as ‘A gram’.
-
47
Put the NP solution in toluene.
-
48
Use a rotary evaporator as described above.
-
49
Weigh the flask again after the solvent has evaporated, and record its weight as ‘B gram’.
-
50
Calculate how much solvent you need to add to reach the desired concentration of toluene to add ((B − A) × 1,000)/5). After dissolving, transfer the solution to a new glass vial and seal with parafilm.
Critical step
Store all NP solutions at 4–6 °C in glass vials.
-
51
Inspect the MCGNP solutions by TEM to examine the shape, diameter and size distribution of the MCGNPs, as well as the purity of the solution. Figure 3, e.g., shows MCGNPs with organic modification of dodecanethiol and MCGNPs with 2-ethylhexanethiol modification.
Deposition of MCGNP solution by inkjet printing
Timing 1 h
Critical
The inkjet printing of MCGNP solution uses the Scienion dispenser system (Supplementary Manual 2).
Caution
Using the toluene solution requires an air exhaust and respirator mask, with filter A1B1E1K1-P2/P3. The dispenser system must be under hood conditions.
-
52
Power on the SciFlex_s3 program, dry air insertion and vacuum pump. Set the inside humidity control at 40%.
Critical
Steps 60–68 must be performed under controlled humidity and temperature.
-
53
Place the the PDC 70 (Piezo Dispenser Capillary nozzle) without connecting it to the manifold.
-
54
Prime by washing with water. Connect the flush bottle to the manifold. Work according to the printer instruction. At the end of washing, disconnect the flush bottle. Connect the pressure differential changeover (PDC) to the manifold after verifying the initial drop existence. Continue prime washing.
-
55
Prime by washing with toluene. Repeat Step 54 with toluene.
-
56
Set up the nozzle. Move the nozzle to the camera station; set its position to the center, and focus it on the front of the camera; activate the dispense mode; set up a droplet through control of the following parameters: voltage, pulse and frequency; set nozzle parameters; check the droplet volume.
-
57
Load 60 µl MCGNP solution into the selected well in the 384-well plate, using a digital pipette.
-
58
Aspirate 15 µl of the 2-ethylhexanethiol-capped gold nanoparticle solution using the nozzle (PDC 70).
-
59
Check and optimize the droplet volume of gold nanoparticle solution by repeating Step 56. The drop volume must be 300–350 pL.
-
60
Set up the target. Go to ‘Robot setup’. Define the target position in a sheet Target substrate. Calibrate the XYZ position by moving the nozzle tip carefully to the right point. The XY spot area for the designed chip is 75,000. Spot-area no. X is 5 with the offset 15,300. Spot-area no. Y is 5 with the offset 15,000. Note: all dimensions are in μm.
-
61
Define the pattern parameters: start point, field size in the x and y direction, number of fields and dot pitch (the distance between the spots). Set up the number of fields as x = 1, y = 1 for easier system operation.
-
62
Calculate the number of drops by formula DN = RV × 1,000/DV (DN is the number of drops, RV is the required MCGNP solution volume in nl, DV is the drop volume in pl). RV = 30 nl for 2-ethlhexanethiol-capped gold nanoparticles. RV = 40 nl for dodecanethiol-capped gold nanoparticles.
-
63
Go to field setup and insert the number of drops calculated in Step 62.
-
64
Select the active well by clicking on it (the selected well turns red). Choose the field by clicking on it (the chosen field turns to light green).
-
65
Check all the selected parameters in the main window: Probe, Run and Target program.
-
66
Start run for the printing activation.
-
67
Check the printed devices with the upper camera.
Critical step
Verify if the morphology of the printed devices is as expected according to their chemistry. The devices with splitting drops around the electrodes should be excluded.
MCGNP stabilization
Timing maximum 48 h for 2-ethylhexanethiol (72 h for dodecanethiol)
-
68
Put the printed wafer into a vacuum oven (T = 55 °C, P = 75 cmHg) immediately after printing.
Critical step
The drying time of MCGNPs on the sensor surface depends on the type of ligands. The drying time for dodecanethiol and 2-ethylhexanethiol modifications are 48 h and 22 h, respectively (Box 1).
-
69
Separate the devices from the dicing tape, and put them on trays with names.
Critical step
Store the device trays in a vacuum desiccator.
Measuring the sensors’ response
Timing 2 h (eight devices in one chamber)
Critical
The setup for the sensors response examination is shown in Supplementary Data 2.
-
70
Calculate the permeation rate, molar constant and temperature for the selected concentration range (Supplementary Manual 3).
-
71
Set the permeation oven at the calculated temperature to reach the specific concentrations. Note: for n-octane at four concentrations—0, 41.5, 84.2 and 134.5 ppm—set the temperature at 110 °C.
-
72
Half-fill the diffusion 5 mm tubes with the desired VOC solution, and heat them to the selected temperature.
Critical step
It is important that the tubes be heated to the correct temperature before progressing. Allow at least 1 h for this step.
-
73
Insert the diffusion tubes into the ovens after stabilization of the required temperature.
-
74
Insert the devices into the printed circuit boards (Supplementary Data 2).
-
75
Connect the boards to the exposure chamber, and close the system to seal the chamber. The VOC inlet valve should be set as closed and the vacuum valve set as open.
-
76
Apply a pressure of at least 200 mTorr inside the exposure chamber to be sure that the baseline does not change.
-
77
Start the LabVIEW program to measure the response of the devices. The measurement exposure comprises three cycles; each cycle is 5 min of vacuum and 5 min of exposure of the VOC at increasing concentrations (Fig. 5a).
Analysis of the sensors’ response
Timing variable
-
78
The output of the measured resistance data is received in a csv file. The baseline resistance, Rb, is resistance before any gas exposure. The sensing starts when the resistance changes during espouse to gases at the stabilization stage. The difference in these resistances is called ΔRend.
-
79
Use MATLAB program or other software to extract the features. Use the program to calculate the ΔRend feature (Fig. 9). Calculate average and standard deviation of ΔRend for each device. Calculate the VI, which is the average response divided by the standard deviation, according to
$$VI = AVG\left( {\frac{{STDEV\frac{{\Delta R}}{{R_{End}}}}}{{AVG\frac{{\Delta R}}{{R_{End}}}}}} \right)$$Fig. 9 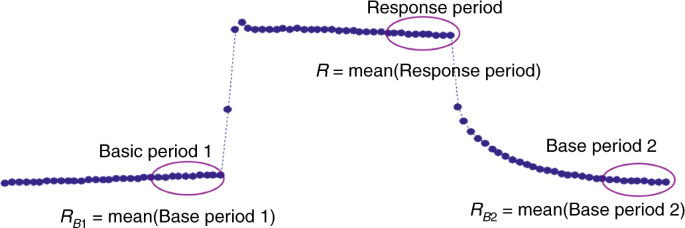
The sensing features of the MCGNP-based sensing response.
-
80
A low VI indicates small distributions between the measured sensors. Use the MATLAB program to extract the normalized response to different VOC concentrations.
-
81
Check the normalized response of the devices; it should have dose dependency with regard to the VOC concentration.

Troubleshooting
Troubleshooting advice can be found in Table 1.
Timing
-
Steps 1–14, electrode array microfabrication in clean room conditions: 8 h
-
Steps 15–24, microbarrier (ring) fabrication: 2 h
-
Steps 25–29, dicing: 2 h
-
Steps 30–51, synthesis of dodecanethiol-capped gold nanoparticles: 30 h
-
Steps 52–67, MCGNP solution deposition by inkjet printing: 1 h
-
Steps 68 and 69, MCGNP stabilization: 48 h
-
Steps 70–77, measuring the sensors’ response: 2 h
-
Steps 78–81, analysis of the sensors’ response: variable
Anticipated results
If you perform the synthesis of the MCGNPs as described in Figs. 1 and 8 and Extended Data Fig. 8, you can expect results similar to those shown in Extended Data Fig. 1. If you deposit the MCGNP solution on interdigitated electrodes without microbarrier, you can expect results similar to those in Extended Data Fig. 2. If you get ‘coffee rings’ and/or irreproducible electrical or chemical sensing properties, then you should restart the deposition of the MCGNPs in a confining ring-like structure, as shown in Fig. 3. In this case, you should expect results as shown in Figs. 4–6 and Extended Data Figs. 5–7. If you try to connect an array of MCGNP-based sensors with pattern recognition methods, then you can expect to analyze complex profiles or gaseous mixtures similar to those in Figs. 7, 8.
Data availability
The data supporting the findings of this study are available within the article, its Supplementary Information and Source Data files and the primary supporting research papers.
Code availability
The software used in this protocol is provided as Supplementary Information.
References
Nakhleh, M. K. et al. Diagnosis and classification of 17 diseases from 1404 subjects via pattern analysis of exhaled molecules. ACS Nano 11, 112–125 (2017).
Shlomi, D. et al. Detection of lung cancer and EGFR mutation by electronic nose system. J. Thorac. Oncol. 12, 1544–1551 (2017).
Feinberg, T. et al. Cancer metabolism: the volatile signature of glycolysis—in vitro model in lung cancer cells. J. Breath. Res. 11, 016008 (2017).
Amal, H. et al. Breath testing as potential colorectal cancer screening tool. Int J. Cancer 138, 229–236 (2016).
Kahn, N., Lavie, O., Paz, M., Segev, Y. & Haick, H. Dynamic nanoparticle-based flexible sensors: diagnosis of ovarian carcinoma from exhaled breath. Nano Lett. 15, 7023–7028 (2015).
Amal, H. et al. Assessment of ovarian cancer conditions from exhaled breath. Int. J. Cancer 136, E614–E622 (2015).
Peng, G. et al. Detection of lung, breast, colorectal, and prostate cancers from exhaled breath using a single array of nanosensors. Br. J. Cancer 103, 542–551 (2010).
Gharra, A. et al. Exhaled breath diagnostics of lung and gastric cancers in China using nanosensors. Cancer Commun. 40, 273–278 (2020).
Broza, Y. Y. et al. Screening for gastric cancer using exhaled breath samples. Br. J. Surg. 106, 1122–1125 (2019).
Amal, H. et al. Detection of precancerous gastric lesions and gastric cancer through exhaled breath. Gut 65, 400–407 (2016).
Amal, H. et al. Geographical variation in the exhaled volatile organic compounds. J. Breath. Res. 7, 047102 (2013).
Karban, A. et al. Programmed nanoparticles for tailoring the detection of inflammatory bowel diseases and irritable bowel syndrome disease via breathprint. Adv. Healthc. Mater. 5, 2339–2344 (2016).
Finberg, J. P. M. et al. Sensor array for detection of early stage Parkinson’s disease before medication. ACS Chem. Neurosci. 9, 2548–2553 (2018).
Nakhleh, M. K. et al. Distinguishing idiopathic Parkinson’s disease from other parkinsonian syndromes by breath test. Parkinsonism Relat. Disord. 21, 150–153 (2015).
Tisch, U. et al. Detection of Alzheimer’s and Parkinson’s disease from exhaled breath using nanomaterial-based sensors. Nanomedicine 8, 43–56 (2013).
Broza, Y. Y. et al. Exhaled breath markers for nonimaging and noninvasive measures for detection of multiple sclerosis. ACS Chem. Neurosci. 8, 2402–2413 (2017).
Ionescu, R. et al. Detection of multiple sclerosis from exhaled breath using bilayers of polycyclic aromatic hydrocarbons and single-wall carbon nanotubes. ACS Chem. Neurosci. 2, 687–693 (2011).
Cohen-Kaminsky, S. et al. Exhaled breath olfactory signature of pulmonary arterial hypertension (PAH) and chronic thromboembolic pulmonary hypertension (CTEPH). Eur. Respiratory Soc. 56, 3549 (2020).
Nakhleh, M.K., Haick, H., Humbert, M. & Cohen-Kaminsky, S. Volatolomics of breath as an emerging frontier in pulmonary arterial hypertension. Eur. Respir. J. 49 (2017).
Cohen-Kaminsky, S. et al. A proof of concept for the detection and classification of pulmonary arterial hypertension through breath analysis with a sensor array. Am. J. Respir. Crit. Care Med. 188, 756–759 (2013).
Nakhleh, M. K. et al. Artificially intelligent nanoarray for the detection of preeclampsia under real‐world clinical conditions. Adv. Mater. Technol. 1, 1600132 (2016).
Nakhleh, M. K. et al. Sensor arrays based on nanoparticles for early detection of kidney injury by breath samples. Nanomedicine 10, 1767–1776 (2014).
Marom, O. et al. Gold nanoparticle sensors for detecting chronic kidney disease and disease progression. Nanomedicine 7, 639–650 (2012).
Nakhleh, M. K. et al. Detecting active pulmonary tuberculosis with a breath test using nanomaterial-based sensors. Eur. Respir. J. 43, 1522–1525 (2014).
Shan, B. et al. Multiplexed nanomaterial-based sensor array for detection of COVID-19 in exhaled breath. ACS Nano 14, 12125–12132 (2020).
Spinelle, L., Gerboles, M., Kok, G., Persijn, S. & Sauerwald, T. Review of portable and low-cost sensors for the ambient air monitoring of benzene and other volatile organic compounds. Sensors 17 (2017).
Nakhleh, M. K., Broza, Y. Y. & Haick, H. Monolayer-capped gold nanoparticles for disease detection from breath. Nanomedicine 9, 1991–2002 (2014).
Broza, Y. Y., Vishinkin, R., Barash, O., Nakhleh, M. K. & Haick, H. Synergy between nanomaterials and volatile organic compounds for non-invasive medical evaluation. Chem. Soc. Rev. 47, 4781–4859 (2018).
García-Berríos, E. et al. Response and discrimination performance of arrays of organothiol-capped Au nanoparticle chemiresistive vapor sensors. J. Phys. Chem. C. 115, 6208–6217 (2011).
Hubble, L. J. et al. High-throughput fabrication and screening improves gold nanoparticle chemiresistor sensor performance. ACS Comb. Sci. 17, 120–129 (2015).
Konvalina, G. & Haick, H. Effect of humidity on nanoparticle-based chemiresistors: a comparison between synthetic and real-world samples. ACS Appl. Mater. Interfaces 4, 317–325 (2012).
Wu, W. & Haick, H. Materials and wearable devices for autonomous monitoring of physiological markers. Adv. Mater. 30, e1705024 (2018).
Hinterwirth, H. et al. Quantifying thiol ligand density of self-assembled monolayers on gold nanoparticles by inductively coupled plasma-mass spectrometry. ACS Nano 7, 1129–1136 (2013).
García-Berríos, E. et al. Response versus chain length of alkanethiol-capped Au nanoparticle chemiresistive chemical vapor sensors. J. Phys. Chem. C. 114, 21914–21920 (2010).
Dovgolevsky, E., Konvalina, G., Tisch, U. & Haick, H. Mono layer-Capped cubic platinum nanoparticles for sensing nonpolar analytes in highly humid atmospheres. J. Phys. Chem. C. 114, 14042–14049 (2010).
Peng, G. et al. Diagnosing lung cancer in exhaled breath using gold nanoparticles. Nat. Nanotechnol. 4, 669–673 (2009).
Joseph, Y., Guse, B., Yasuda, A. & Vossmeyer, T. Chemiresistor coatings from Pt-and Au-nanoparticle/nonanedithiol films: sensitivity to gases and solvent vapors. Sens. Actuators B Chem. 98, 188–195 (2004).
Jana, N. R., Gearheart, L. & Murphy, C. J. Wet chemical synthesis of high aspect ratio cylindrical gold nanorods. J. Phys. Chem. B 105, 4065–4067 (2001).
Segev-Bar, M. et al. Multi-parametric sensing platforms based on nanoparticles. Adv. Mater. Technol. 2, 1600206 (2017).
Blanco, E., Shen, H. & Ferrari, M. Principles of nanoparticle design for overcoming biological barriers to drug delivery. Nat. Biotechnol. 33, 941–951 (2015).
Parveen, S., Misra, R. & Sahoo, S. K. Nanoparticles: a boon to drug delivery, therapeutics, diagnostics and imaging. in Nanomedicine in Cancer (ed. Balogh, L. P.) 47–98 (Taylor & Francis, 2017).
Brust, M., Walker, M., Bethell, D., Schiffrin, D. J. & Whyman, R. Synthesis of thiol-derivatised gold nanoparticles in a two-phase liquid–liquid system. J. Chem. Soc., Chem. Commun. 7, 801–802 (1994).
Jana, N. R. & Peng, X. G. Single-phase and gram-scale routes toward nearly monodisperse Au and other noble metal nanocrystals. J. Am. Chem. Soc. 125, 14280–14281 (2003).
Martin, M. N., Basham, J. I., Chando, P. & Eah, S. K. Charged Gold Nanoparticles in Non-Polar Solvents: 10-min Synthesis and 2D Self-Assembly. Langmuir 26, 7410–7417 (2010).
Sau, T. K. & Murphy, C. J. Room temperature, high-yield synthesis of multiple shapes of gold nanoparticles in aqueous solution. J. Am. Chem. Soc. 126, 8648–8649 (2004).
Tisch, U. & Haick, H. Arrays of chemisensitive monolayer-capped metallic nanoparticles for diagnostic breath testing. Rev. Chem. Eng. 26, 171–179 (2010).
Joseph, Y., Guse, B., Vossmeyer, T. & Yasuda, A. Gold nanoparticle/organic networks as chemiresistor coatings: the effect of film morphology on vapor sensitivity. J. Phys. Chem. C. 112, 12507–12514 (2008).
Malikova, N., Pastoriza-Santos, I., Schierhorn, M., Kotov, N. A. & Liz-Marzan, L. M. Layer-by-layer assembled mixed spherical and planar gold nanoparticles: control of interparticle interactions. Langmuir 18, 3694–3697 (2002).
Suntivich, R., Shchepelina, O., Choi, I. & Tsukruk, V. V. Inkjet-assisted layer-by-layer printing of encapsulated arrays. ACS Appl. Mater. Interfaces 4, 3102–3110 (2012).
Andres, R. P. et al. Self-assembly of a two-dimensional superlattice of molecularly linked metal clusters. Science 273, 1690–1693 (1996).
Wohltjen, H. & Snow, A. W. Colloidal metal-insulator-metal ensemble chemiresistor sensor. Anal. Chem. 70, 2856–2859 (1998).
Liao, J., Bernard, L., Langer, M., Schonenberger, C. & Calame, M. Reversible formation of molecular junctions in 2D nanoparticle arrays. Adv. Mater. 18, 2444–2447 (2006).
Oh, Y., Yoon, H. G., Lee, S.-N., Kim, H.-K. & Kim, J. Inkjet-printing of TiO2 co-solvent ink: From uniform ink-droplet to TiO2 photoelectrode for dye-sensitized solar cells. J. Electrochem. Soc. 159, B34 (2011).
Li, Y.N., Yang, Q., Li, M.Z. & Song, Y.L. Rate-dependent interface capture beyond the coffee-ring effect. Sci. Rep. 6 (2016).
Hu, H. & Larson, R. G. Marangoni effect reverses coffee-ring depositions. J. Phys. Chem. B 110, 7090–7094 (2006).
Soltman, D. & Subramanian, V. Inkjet-printed line morphologies and temperature control of the coffee ring effect. Langmuir 24, 2224–2231 (2008).
Han, W. & Lin, Z. Q. Learning from ‘coffee rings’: ordered structures enabled by controlled evaporative self-assembly. Angew. Chem. 51, 1534–1546 (2012).
Bekki, S., Vignesadler, M., Nakache, E. & Adler, P. M. Solutal Marangoni Effect: I. Pure interfacial transfer. J. Colloid Interface Sci. 140, 492–506 (1990).
Pesach, D. & Marmur, A. Marangoni effects in the spreading of liquid-mixtures on a solid. Langmuir 3, 519–524 (1987).
Neogi, P. Tears-of-wine and related phenomena. J. Colloid Interface Sci. 105, 94–101 (1985).
Schriven, L. E. & Sternling, C. V. The Marangoni effect. Nature 187, 186–188 (1960).
Still, T., Yunker, P. J. & Yodh, A. G. Surfactant-induced marangoni eddies alter the coffee-rings of evaporating colloidal drops. Langmuir 28, 4984–4988 (2012).
Konvalina, G., Leshansky, A. & Haick, H. Printing nanostructures with a propelled anti-pinning ink droplet. Adv. Funct. Mater. 25, 2411–2419 (2015).
Chow, E., Herrmann, J., Barton, C. S., Raguse, B. & Wieczorek, L. Inkjet-printed gold nanoparticle chemiresistors: influence of film morphology and ionic strength on the detection of organics dissolved in aqueous solution. Anal. Chim. Acta 632, 135–142 (2009).
Sun, J., Bao, B., He, M., Zhou, H. & Song, Y. Recent advances in controlling the depositing morphologies of inkjet droplets. ACS Appl. Mater. Interfaces 7, 28086–28099 (2015).
Tekin, E., de Gans, B. J. & Schubert, U. S. Ink-jet printing of polymers—from single dots to thin film libraries. J. Mater. Chem. 14, 2627–2632 (2004).
Hutchings, I.M. & Martin, G. Inkjet Technology for Digital Fabrication (John Wiley & Sons, 2012).
Adachi, E., Dimitrov, A. S. & Nagayama, K. Stripe patterns formed on a glass-surface during droplet evaporation. Langmuir 11, 1057–1060 (1995).
Shmuylovich, L., Shen, A. Q. & Stone, H. A. Surface morphology of drying latex films: multiple ring formation. Langmuir 18, 3441–3445 (2002).
Anyfantakis, M., Geng, Z., Morel, M., Rudiuk, S. & Baigl, D. Modulation of the coffee-ring effect in particle/surfactant mixtures: the importance of particle-interface interactions. Langmuir 31, 4113–4120 (2015).
Park, J. & Moon, J. Control of colloidal particle deposit patterns within picoliter droplets ejected by ink-jet printing. Langmuir 22, 3506–3513 (2006).
Deegan, R. D. et al. Contact line deposits in an evaporating drop. Phys. Rev. E 62, 756–765 (2000).
Wang, H. et al. Sintering metal nanoparticle films. in 2008 Flexible Electronics and Displays Conference and Exhibition 1–3 (IEEE, 2008).
Xie, Z., Raju, M. V. R., Stewart, A. C., Nantz, M. H. & Fu, X.-A. Imparting sensitivity and selectivity to a gold nanoparticle chemiresistor through thiol monolayer functionalization for sensing acetone. RSC Adv. 8, 35618–35624 (2018).
Lustemberg, P. G. et al. Spontaneously formed sulfur adlayers on gold in electrolyte solutions: Adsorbed sulfur or gold sulfide? J. Phys. Chem. C. 112, 11394–11402 (2008).
Vericat, C., Vela, M. E., Benitez, G., Carro, P. & Salvarezza, R. C. Self-assembled monolayers of thiols and dithiols on gold: new challenges for a well-known system. Chem. Soc. Rev. 39, 1805–1834 (2010).
Shafrin, E. G. & Zisman, W. A. Constitutive relations in the wetting of low energy surfaces and the theory of the retraction method of preparing monolayers. J. Phys. Chem. 64, 519–524 (1960).
Briglin, S. M., Gao, T. & Lewis, N. S. Detection of organic mercaptan vapors using thin films of alkylamine-passivated gold nanocrystals. Langmuir 20, 299–305 (2004).
Göpel, W. Chemical sensing, molecular electronics and nanotechnology: interface technologies down to the molecular scale. Sens. Actuators B Chem. 4, 7–21 (1991).
Kao, K. W., Hsu, M. C., Chang, Y. H., Gwo, S. & Yeh, J. A. A sub-ppm acetone gas sensor for diabetes detection using 10 nm thick ultrathin InN FETs. Sensors 12, 7157–7168 (2012).
Righettoni, M. et al. Breath acetone monitoring by portable Si:WO3 gas sensors. Anal. Chim. Acta 738, 69–75 (2012).
Galassetti, P. et al. Breath ethanol and acetone as indicators of serum glucose levels: an initial report. Diabetes Technol. Ther. 7, 115–123 (2005).
Shiigi, H., Yamamoto, Y. & Nagaoka, T. Electrical property of a networked monolayer film prepared from Au nanoparticles. Chem. Sens. 20, 810–811 (2004).
Krasteva, N. et al. Analyte sorption and distribution profiles in thin metal nanoparticle/organic composite films-implication to the mechanism of vapor sensing. Chem. Sens. 20, 278–279 (2004).
Evans, S. D., Johnson, S. R., Cheng, Y. L. & Shen, T. Vapour sensing using hybrid organic–inorganic nanostructured materials. J. Mater. Chem. 10, 183–188 (2000).
Leopold, M. C. et al. Growth, conductivity, and vapor response properties of metal ion-carboxylate linked nanoparticle films. Faraday Discuss 125, 63–76 (2004).
Vossmeyer, T. et al. Gold nanoparticle/polyphenylene dendrimer composite films: Preparation and vapor‐sensing properties. Adv. Mater. 14, 238–242 (2002).
Silva, L. I. B., Freitas, A. C., Rocha-Santos, T. A., Pereira, M. E. & Duarte, A. C. Breath analysis by optical fiber sensor for the determination of exhaled organic compounds with a view to diagnostics. Talanta 83, 1586–1594 (2011).
Ruan, H., Kang, Y., Wang, Y.-X. & Claus, R.O. Nanostructured fiber optic sensors for detection of volatile organic compounds in breath. in Proc. SPIE 2006 https://doi.org/10.1117/12.651403 (2006).
Liu, C., Hayashi, K. & Toko, K. Au nanoparticles decorated polyaniline nanofiber sensor for detecting volatile sulfur compounds in expired breath. Sens. Actuators B Chem 161, 504–509 (2012).
Broza, Y. Y. & Haick, H. Nanomaterial-based sensors for detection of disease by volatile organic compounds. Nanomed. (Future Med., Lond.) 8, 785–806 (2013).
Haick, H., Vishinkin, R., Di Natale, C. & Marco, S. Sensor systems. in Breathborne Biomarkers and the Human Volatilome 2nd ed (eds. Beauchamp, J. et al.) 201–220 (Elsevier, 2020).
Rock, F., Barsan, N. & Weimar, U. Electronic nose: current status and future trends. Chem. Rev. 108, 705–725 (2008).
Turner, A. P. & Magan, N. Electronic noses and disease diagnostics. Nat. Rev. Microbiol. 2, 161–166 (2004).
Tisch, U. & Haick, H. Nanomaterials for cross-reactive sensor arrays. MRS Bull. 35, 797–803 (2010).
Thaler, E. R. & Hanson, C. W. Medical applications of electronic nose technology. Expert Rev. Med. Dev. 2, 559–566 (2005).
Acknowledgements
The authors acknowledge A. Gharra for development of the LabVIEW and MATLAB program for device examination and K. Weinfeld for XPS measurements and analysis.
Author information
Authors and Affiliations
Contributions
Y.M. and M.A. designed, fabricated and characterized the MCGNP-based sensors; V.K. synthesized and characterized the MCGNP solutions; E.M. characterized the sensors; Y.Y.B. provided and analyzed the clinical studies; G.S. and H.H. designed the concept and carried out the R&D process. All authors participated in writing the manuscript.
Corresponding author
Ethics declarations
Competing interests
The authors declare no competing interests.
Additional information
Peer review information Nature Protocols thanks Il-Doo Kim and Radislav Alexandrovich Potyrailo for their contribution to the peer review of this work.
Publisher’s note Springer Nature remains neutral with regard to jurisdictional claims in published maps and institutional affiliations.
Related links
Key references using this protocol
Gharra, A. et al. Cancer Commun. 40, 273-278 (2020): https://europepmc.org/article/med/32459390
Shan, B. et al. ACS Nano 14, 12125-12132 (2020): https://pubs.acs.org/doi/10.1021/acsnano.0c05657
Nakhleh, M. K. et al. ACS Nano 11, 112-125 (2017): https://pubs.acs.org/doi/10.1021/acsnano.6b04930
Hubble, L. J. et al. ACS Comb. Sci. 17, 120-129 (2015): https://pubs.acs.org/doi/10.1021/co500129v
Extended data
Extended Data Fig. 1
a–d, TEM characterization of gold nanoparticles with different organic ligands: dodecanethiol (a); 2-ethylhexanethiol (b); analysis of core size distribution of dodecanethiol (c); analysis of core size distribution of 2-ethylhexanethiol (d).
Extended Data Fig. 2 Topology characterization after printing 20±0.3 nl MCGNP solutions.
a, b, Optical microscopic images of 8-sensor chips made of dodecanethiol-capped (a) and 2-ethylhexanethiol-capped (b) gold nanoparticle films. The different morphologies appearing in a and b could be related to the application of different chemistries, which, in turn, lead to different surface tensions and evaporation process of the solvent. c, Magnification of the dodecanethiol-capped gold nanoparticle sensor around the coffee ring shape. d, XPS elemental surface analysis of dodecanethiol-caped gold nanoparticles on SiO2 surface, as a representative example (Supplementary Fig. 16).
Extended Data Fig. 3
a–c, Contact angle measurements by optical goniometery of: SU-8 without oxygen plasma (a); SU-8 with oxygen plasma (b); and SiO2 surface (c). Higher contact angle indicates higher hydrophobicity of the surface, which, in turn, better allows to hold the drops inside the barrier.
Extended Data Fig. 4
a–d, SEM images of SiO2 barrier after lift-off process (a,b); and SU-8 2002 barrier made by photolithography process (c,d).
Extended Data Fig. 5
Schematic description of the droplets behavior and effect of the microbarrier height on the evaporation of MCGNP solution droplet.
Extended Data Fig. 6 Relationship between the microbarrier height and printed MCGNP solution.
a,b, Values of VI (a) and amplitude (b) of response to decane as a function of deposited volume of ethylhexanethiol-capped gold nanoparticle solution. c,d, Values of VI (c) and amplitude (d) of response to decane as a function of deposited volume of dodecanethiol-capped gold nanoparticle solution. Note: the VI is a relative measure of the variance of the response, and the amplitude is a measure of its level. For optimized devices, one has to look for the lowest possible VI while keeping the amplitude of the sensing response as high as possible.
Extended Data Fig. 7
Boxplot of the extracted feature of 24 dodecanethiol-capped gold nanoparticle sensors for various storage conditions: vacuum, nitrogen and room air.
Extended Data Fig. 8
Schematic depiction of the MCGNP synthesis process.
Extended Data Fig. 9
Schematics of the reduction step during the MCGNP synthesis.
Supplementary information
Supplementary Information
Supplementary Data 1–4, Supplementary Manual 1–3 and Supplementary Figs. 1–15.
Supplementary Software 1
The electrodes design for the photolithography process
Rights and permissions
About this article

Cite this article
Milyutin, Y., Abud-Hawa, M., Kloper-Weidenfeld, V. et al. Fabricating and printing chemiresistors based on monolayer-capped metal nanoparticles. Nat Protoc 16, 2968–2990 (2021). https://doi.org/10.1038/s41596-021-00528-y
Received:
Accepted:
Published:
Issue Date:
DOI: https://doi.org/10.1038/s41596-021-00528-y
This article is cited by
Comments
By submitting a comment you agree to abide by our Terms and Community Guidelines. If you find something abusive or that does not comply with our terms or guidelines please flag it as inappropriate.
