
Abstract
In coastal seas, the role of atmospheric deposition and river runoff in dissolved organic phosphorus (DOP) utilization is not well understood. Here, we address this knowledge gap by combining microcosm experiments with a global approach considering the relationship between the activity of alkaline phosphatases and changes in phytoplankton biomass in relation to the concentration of dissolved inorganic phosphorus (DIP). Our results suggest that the addition of aerosols and riverine water stimulate the biological utilization of DOP in coastal seas primarily by depleting DIP due to increasing nitrogen concentrations, which enhances phytoplankton growth. This “Anthropogenic Nitrogen Pump” was therefore identified to make DOP an important source of phosphorus for phytoplankton in coastal seas but only when the ratio of chlorophyll a to DIP [Log10 (Chl a / DIP)] is larger than 1.20. Our study therefore suggests that anthropogenic nitrogen input might contribute to the phosphorus cycle in coastal seas.
Introduction
Phosphorus (P) is an essential element for microorganisms such as phytoplankton due to its relevance for the synthesis of nucleic acids, phospholipids, and the main energy currency in cells, adenosine 5′-triphosphate1,2. Dissolved inorganic phosphorus (DIP) is regarded as the main bioavailable phosphorus and its concentration is often low in the surface open oceans with the exception of coastal seas3,4. Low DIP concentrations have been widely observed in open oceans such as the Atlantic and the Pacific Oceans, and sometimes also in coastal seas4,5,6. In contrast, dissolved organic phosphorus (DOP) in the oceans is more abundant relative to DIP7,8. Thus, microbes including phytoplankton have evolved to efficiently utilize DOP through extracellular hydrolysis, which converts DOP into DIP for cellular uptake5,9 and therefore mitigates phosphorus limitation under conditions of DIP scarcity.
The most important DOP hydrolase is the alkaline phosphatase (AP), which can be active in different subcellular compartments such as the extracellular space (e.g., phycosphere), the cell wall, the plasma membrane, or as part of the cytoplasm of diverse microbes including phytoplankton1,10,11. The activity of AP (APA) is mainly composed of inducible APA and constitutive APA. Although there is evidence of background APA at relatively low levels (constitutive APA) independent of DIP concentrations12,13,14, AP usually is induced by low concentrations of DIP. Thus, the APA usually is inversely correlated with DIP concentrations, and inducible AP therefore becomes activated for the utilization of DOP when DIP concentrations fall below a certain threshold15,16,17. In addition to the DIP concentration, other factors such as the abundance and diversity of microbiomes, N:P ratios, seawater temperature, and the availability of essential enzyme co-factors such as Fe and Zn also affect APA11,18,19,20. Hence, these variables might therefore have an impact on the DIP threshold for the activation of AP as previously shown11,13,21. This complex system of variables impacting the activation of AP likely is the reason why there is no consensus yet in terms of environmental conditions that induce DOP utilization in the ocean and especially in coastal seas.
Atmospheric deposition and river runoff are considered important sources of nutrients22,23,24,25 for the surface ocean as they usually contain significant amounts of nitrogen (N) and trace metals (e.g., Fe) but relatively low concentrations of P26,27,28,29,30. Studies have shown that atmospheric deposition can contribute between 40% and 70% of the total terrigenous N input in the North Pacific, North Atlantic, and Mediterranean31,32,33. Similar, riverine input can contribute 19–37 Tg N year−1 to the global coastal seas and is considered an important reason leading to coastal eutrophication24,34. Furthermore, atmospheric and riverine inputs are known to be indispensable sources of Fe in the global ocean26,30. Hence, atmospheric deposition has been estimated to stimulate phytoplankton growth and therefore to support between 3% and 5% of global marine net primary productivity35,36, while river runoff, of which the impact is mainly concentrated in the coastal waters, has been estimated to enhance the net primary productivity by ~14% in the global coastal seas over the 1905–2010 period34. Atmospheric deposition can also supply nutrients to the deeper ocean where it supports phytoplankton growth in the deep chlorophyll a maximum layer (DCM)37,38. In the recent past, the N input through atmospheric deposition and river runoff has increased due to increasing economic activities27,34. This might lead to an excess of N especially in seawater closest to the source of anthropogenic pollution39,40,41. Hence, coastal seas are likely more affected than the open ocean in terms of an increased input of N, which can lead to elevated N:P ratios24,42 and therefore potentially a gradual shift from N deficiency to P deficiency43. Under such biogeochemical conditions, DOP might become an important source of P for phytoplankton to alleviate limitation by DIP in excess of N1,5,44. However, despite decades of research on the impacts of atmospheric deposition and riverine input of essential nutrients on marine biogeochemistry28,34,36,45, their role in DOP utilization in coastal seas remains elusive.
Thus, only a few studies so far have focused on meso-/eutrophic coastal waters when it comes to the role of atmospheric deposition and riverine input in regulating DOP utilization18,46,47. Most studies have focused on oligotrophic open oceans where only atmospheric deposition can be considered because the geographical reach of rivers is more limited due to significant mixing and advection in coastal seas. Atmospheric deposition in oligotrophic open oceans can enhance DOP utilization and therefore alleviate P stress, but primarily by supplying essential enzyme co-factors of AP such as Fe and Zn11,17. In contrast, our recent work has provided preliminary evidence that atmospheric deposition can stimulate phytoplankton growth in the China Coastal Seas even though the concentrations of DIP in this geographical area were unable to meet the cellular requirements of phytoplankton for growth46,47.
Westerly winds in East Asia can carry aerosols into the China Coastal Seas, including the Bohai Sea, the Yellow Sea, and the East China Sea48,49,50 and therefore significantly contribute to atmospheric deposition in these coastal seas. Furthermore, multiple rivers such as the Yellow River, the Xiaoqing River and the Yangtze River significantly contribute to riverine input of terrestrial nutrients in these coastal seas. In the relatively enclosed Bohai Sea, both atmospheric deposition and river runoff cause excess macro-nutrient concentrations (e.g., dissolved inorganic nitrogen, DIN) and elevated concentrations of trace metals51,52. Consequently, P has now become the main limiting nutrient53,54,55. The Yellow Sea and the East China Sea are marginal seas connected to open waters of the Northwest Pacific Ocean, with typical biogeochemistry spanning from eutrophy to oligotrophy with increasing distance from the East Asian continent56. In contrast to the increased anthropogenic input of N, DIP concentrations have been continuously decreasing since the mid-1990s, hence causing P deficiency43,57. Thus, these coastal seas provide an ideal test bed for studying the effect of atmospheric deposition and river runoff on the utilization of DOP in relatively nutrient-rich coastal waters, which contribute disproportionally to global biogeochemical cycles58,59.
To address this knowledge gap, we carried out a series of on-board microcosm experiments in the China Coastal Seas covering a gradient from eutrophic to oligotrophic conditions with the aim to reveal the impact of atmospheric deposition and riverine input on DOP utilization and therefore the role of N-rich aerosols and riverine waters in biogeochemical cycles of coastal seas (Fig. 1).

The experiments in spring and summer at Y3 (B1) are labeled as Y3Spr (B1Spr) and Y3Sum (B1Sum), respectively. The red star indicates the location of aerosol sampling. Source data are provided as a Source Data file.
Results
Characteristics of atmospheric aerosols, riverine water, and seawater of the China Coastal Seas
The concentration of DIN (0.99–2.14 μmol·m-3) in aerosols was much higher than that of DIP (0.66 × 10⁻³–8.36 × 10⁻³ μmol·m-3), resulting in high DIN:DIP ratios ( > 100), which significantly exceeded the Redfield ratio (N:P = 16:1) (Table S1). Similarly, the concentration of DIN in the riverine water was high (330.54 μM) and that of DIP was low (0.65 μM), resulting in a high N:P ratio of 509 (Table S1). In addition, the salinity of the 20 L incubation system decreased about 0.05 PSU for the River-low group and 0.2 PSU for the River-high group, which had negligible impacts on phytoplankton growth60. The DIN:DIP ratios were also high ( > 100) in the seawater at B1Spr (127) and B1Sum (107) in the Bohai Sea, E1 (151) in the East China Sea, and Y1 (200) in the Yellow Sea, while closer to the Redfield ratio at Y3Spr (12), Y1-DCM (18), and Y2 (15) in the Yellow Sea.
Generally, seawater in this study was characterized by low DIP concentrations (0.01–0.11 μM) with the highest value measured at the DCM layer. In contrast, the DIN (0.23–9.83 μM), Si(OH)4 (0.20–8.47 μM), and Chl a (0.14–4.47 μg·L−1) concentrations varied widely (Table S2). However, we were able to divide the nutrient status of the seawater used in this study for the microcosm experiments into three categories: I. Eutrophic-like: At B1Sum and DCM layer of Y1, Chl a (1.21–2.94 μg·L−1), DIN (1.99–3.60 μM), and Si(OH)4 (3.10–8.47 μM) concentrations were relatively high. At Y3Spr and B1Spr, the Chl a concentrations were also high (3.07–4.47 μg·L−1), even though DIN ( < 1 μM) and Si(OH)4 (0.20–0.79 μM) concentrations were relatively low. This is likely because the seawater was collected during a spring bloom. In contrast, DIN (9.83 μM) and Si(OH)4 (3.18 μM) concentrations were high, while the Chl a concentration was relatively low at E1(0.43 μg·L−1), which corresponded to the end of the spring bloom. II. Mesotrophic-like: The seawater of Y1 and Y3Sum had a medium level of Chl a (0.47–1.16 μg·L−1), DIN (0.23–1.53 μM), and Si(OH)4 (1.04–1.69 μM) concentrations. III. Oligotrophic-like: The seawater of Y2 had low nutrient concentrations (DIN, 0.27 μM; DIP, 0.02 μM; Si(OH)4, 1.02 μM), and lowest Chl a concentration (0.14 μg·L−1) (Table S2).
The response of phytoplankton to additions of aerosols and riverine water
Even though the in-situ Chl a and nutrient concentrations in the sampled seawater varied over an order of magnitude at different stations (Table S2), a significant response of Chl a concentrations to the addition of nutrients, aerosols, and riverine waters was found at most stations (Figs. S1 and S2). However, considering that seawater samples were collected from different nutrient regimes (eutrophic to oligotrophic) and phytoplankton growth stages (Figs. S1, S2, and Table S2), it was challenging to delineate the response of Chl a under different experimental treatments conducted with the microcosms. ΔR, which has been used to quantify the relative change of Chl a after diverse treatments in previous studies61, was therefore introduced to determine the significance of the response of Chl a to additions of nutrients, aerosols, and riverine waters. According to our ΔR calculations for nutrient treatments, phytoplankton was generally limited by N in spring, and by either P or N + P in summer (Fig. 2a). Note that phytoplankton at E1 and Y1-DCM were not growth limited by either N or P (Fig. 2a). However, additions of aerosols or riverine waters appear to have increased Chl a and ΔR in almost all experiments (p < 0.05) irrespective of the limiting nutrient, and the addition of aerosols and riverine waters with same DIN content shows a similar increase of Chl a (Figs. 2b and S2). Even under the limitations of P and N + P, the additions of aerosols or riverine waters with minimal DIP supply relative to the concentrations in natural seawater, increased Chl a concentrations over time (Figs. 2, S2, and S3).

ΔR (log10(Chl at-avg/Chl ac-avg)/t) is the Log10 ratio of the average Chl a concentration during the incubations in treatment relative to control groups. a ΔR in nutrient addition experiments. The colored dots indicate ΔR in different treatment groups (n = 3 samples). The color in boxes indicates the significant response of Chl a to treatments (limiting nutrients) calculated using one-way ANOVA and Turkey HSD post hoc test (blue = N limitation, yellow = P limitation, red = N + P colimitation, and white = not significant) (p < 0.05). The lines across the boxes represent 25th (bottom), 50th (middle), and 75th (top) percentiles. The whisker caps represent minimum (bottom) and maximum (top) values. b ΔR in aerosol and riverine water addition experiments. The boxes with blue and red dots indicate the ΔR in spring and summer, respectively. The lines across the boxes represent 25th (bottom), 50th (middle), and 75th (top) percentiles. The whisker caps represent minimum (bottom) and maximum (top) values. Significant differences (p < 0.05) between ΔR in spring and summer are indicated with a connecting line and p value (unpaired t-test, two-sided). n, number of samples. Source data are provided as a Source Data file.
The activity of alkaline phosphatases and DOP utilization in microcosm experiments
After the addition of aerosols or riverine waters, the DIN and DIP concentrations decreased in most incubations (Fig. S3). The APA in the surface seawater varied greatly during spring- and summertime. Low APAs were observed at E1 (0.4 nM P·h−1) and B1Spr (0.9 nM P·h−1) in spring with lower seawater temperature (10–17 °C), whereas much higher (9.0–179.1 nM P·h−1) APA was measured in the summer with higher seawater temperature (28–32 °C), due to the increased severity of P deficiency except for Y1-DCM (2.1 nM P·h−1) that had relatively high DIP concentrations (Table S2). This seasonal difference was most pronounced at B1 in the Bohai Sea, of which the APA in summer was more than two orders of magnitude higher than in spring (Table S2). The APA generally showed a positive response to the addition of DIN (Figs. S4a, c and S5a-b), aerosols (Fig. 3) and riverine waters (Fig. S6a, b) whereas it decreased after the addition of P or N + P (Fig. S5). A significant increase of Chl a normalized APA (APA / Chl a) was also found at B1Spr, B1Sum, and Y3Sum (Fig. S7).

APA in the experiments where dissolved inorganic phosphorus (DIP) was the main source of phosphorus (a, b), dissolved organic phosphorus (DOP) was the main source of phosphorus (c–f), and DIP was the main source of phosphorus in control and DOP was the main source of phosphorus in aerosol treatments (g). Between different groups at the same day of incubation, indistinguishable means labeled with the same letter (p < 0.05) and NS = not significant (one-way ANOVA and Turkey HSD post hoc test). Data are presented as mean values +/- SD, n = 3 samples for all except where indicated by an asterisk (n = 2 samples). Source data are provided as a Source Data file.
Compared with concentrations in surface seawater, The concentration of total dissolved phosphorus (TDP) changed by -42.5%–5.9% during the incubations (Fig. S8), indicative of substantial concentrations of P in seawater. The net utilization of DIP and DOP by phytoplankton were estimated through the change of DIP (ΔDIP) and DOP (ΔDOP), respectively, during the incubations. There were three patterns observed with respect to the utilization of P:
-
I.
DIP was the main source of phosphorus. In experiments using eutrophic seawater with relatively high DIP concentrations (0.07–0.11 μM) including E1 and Y1-DCM, DIP was the main bioavailable P nutrient, and 0.04–0.05 μM DIP was consumed by phytoplankton in the control groups (Fig. 4a and S9a, f). The DIP utilization changed by -5.5%–91.0% after aerosol addition, which was positively correlated with the added amount at Y1-DCM (Fig. S9f).
Fig. 4: Phosphorus utilization in response to aerosol additions. 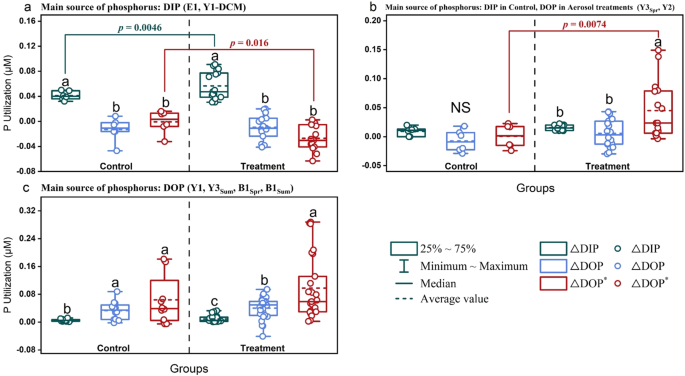
phosphorus (P) utilization in the experiments where dissolved inorganic phosphorus (DIP) was the main source of P (a), DIP was the main source of P in control and dissolved organic phosphorus (DOP) was the main source of P in aerosol treatments (b), and DOP was the main source of P (c). DIP utilization (ΔDIP) and net DOP utilization (ΔDOP) were calculated during the incubations from the change of DIP and DOP concentrations, respectively. Potential maximum DOP utilization (ΔDOP* = ΔDIN/16-ΔDIP) was calculated by the DIN (ΔDIN) and DIP (ΔDIP) utilization during the incubations using the Redfield ratio of 16:1 for N:P. Between different P utilization (ΔDIP, ΔDOP, ΔDOP*) in the same group, indistinguishable means labeled with the same letter and NS = not significant (one-way ANOVA and Turkey HSD post hoc test). Significant differences (p < 0.05) for P utilization between control and treatment groups are indicated with connecting colored lines and p values (unpaired t-test, two-sided). n, number of samples. Source data are provided as a Source Data file.
-
II.
DIP was the main source of phosphorus in the control and DOP was the main source of phosphorus in the aerosol treatments. DIP was also the main P nutrient in the control at Y3Spr and Y2 (Fig. S9b, g). Except for Y1-DCM which had higher DIP, DOP utilization was induced after the aerosol addition, leading to small uptake ( ≤ 0.02 μM) of DOP during the incubations in the aerosol treatments at E1, Y3Spr, and Y2. Aerosol addition contributed to DOP becoming the main P nutrient for phytoplankton growth, which accounted for 51.9%–59.7% of P uptake in the high-content aerosol treatment at Y3Spr and in the low- and medium-content aerosol treatments at Y2 (Fig. 4b and S9a, b, g).
-
III.
DOP was the main source of phosphorus. At B1Spr, B1Sum, Y1, and Y3Sum, where DIP was highly deficient (0.01–0.03 μM), DOP contributed 82.4%–92.5% of P and became the primary P nutrient for phytoplankton growth in the control groups (Fig. 4c). However, although DOP was still the main P nutrient in the treatment groups, no significant enhancement of ΔDOP was found after aerosol additions (Fig. S9c, d, e, h).

Note that ΔDOP as net DOP utilization did not show a significant response either to aerosol or riverine water additions in most experiments (Fig. 4, S6c-d, and S9), which was likely ascribed to the high turnover rate of easily degradable DOP in coastal seas62,63. We therefore defined ΔDOP* (ΔDIN / 16–ΔDIP, Eq. 3) on the basis of DIN (ΔDIN) and DIP (ΔDIP) utilization (Eq. 2), and the Redfield ratio for N:P requirement (16) of phytoplankton. This enabled us to estimate the potential maximum uptake of DOP (versus net uptake given as ΔDOP)11,44, which was positively correlated with ΔDOP and APA (Fig. 5a). At E1 and Y1-DCM, where DIP was the main P nutrient, ΔDOP* was low (-0.06–0.02 μM) (Fig. 4a). At Y3Spr and B1Spr with ΔDOP between -0.02 and 0.02 μM, positive ΔDOP* could be found. Moreover, at B1Sum and Y3Sum with high APA (15.5–513.7 nM P·h−1) and ΔDOP between 0.04–0.06 μM, phytoplankton had a larger potential to take up DOP (ΔDOP*, up to 0.29 μM), indicating that the total uptake of DOP during the incubations may be up to 37 times higher than the calculated net DOP uptake (ΔDOP, up to 0.06 μM) (Fig. 4, S6, and S9). In addition, ΔDOP* significantly responded to aerosol and riverine water additions at Y3Spr, B1Spr, Y2, Y3Sum, and B1Sum where DOP was the main P nutrient or might have become the main P nutrient after aerosol additions, of which the response was positively correlated with the amount added (Fig. 4b-c, S6, and S9). ΔDOP* at B1Sum in the Bohai Sea was even higher than the DOP concentration at the end of the incubations, which is in accordance with an increased turnover of DOP in the treatments with aerosol and riverine water (Figs. 4, S6, and S9). As an exception, although APA was high at Y1 (26.2–121.0 nM P·h−1), ΔDOP* did not significantly respond to aerosol additions. This is possibly due to the contribution of bacteria to DOP hydrolysis, as the Chl a normalized APA (APA / Chl a) at Y1 did not significantly respond to aerosol addition, and was much higher than that of other stations with significant DOP utilization (B1Spr, Y3Sum, B1Sum) (Figs. S7 and S9).

a Heatmap of Spearman correlations between measured variables, including the average Chlorophyll a over the time during the experimental incubations (Chl aavg), the utilization of dissolved inorganic nitrogen (ΔDIN), the net utilization of DOP (ΔDOP), the potential maximum utilization of DOP (ΔDOP*), and the average activity of alkaline phosphatase over a time course during the incubations (APAavg); n = 3 samples. The blue and red squares represent positive and negative correlations, respectively. The numbers represent the Spearman correlation index. The * and ** indicate 5% (p < 0.05) and 1% (p < 0.01) significant level, respectively (Nonparametric Spearman correlation test (r), two-sided). No adjustments were made for multiple comparisons. b Correlation between treatment-induced change of average APA over time course during incubation ((APAT-avg-APAC-avg)/APAC-avg) and change of DIN:DIP at the beginning of incubation (Δ(N:P)0). APAC-avg = APA in control group; APAT-avg = APA in treatment (aerosol and riverine water additions). The red solid line represents the best fit line of linear regression and the dashed lines represent the 95% confidence interval. p values from a two-sided test are shown. n, number of samples. Source data are provided as a Source Data file.
It should be noted that although phytoplankton can alleviate P limitation by increasing the N:P uptake ratio under P-limited conditions64, the higher ΔDOP* relative to ΔDIP was also identified using three (ΔDOP*48 = ΔDIN / 48–ΔDIP, generally indicative of obvious P deficiency) and even if five (ΔDOP*80 = ΔDIN / 80–ΔDIP) times the Redfield ratio (Fig. S10). Thus, our results do not appear to be significantly impacted by differences in the Redfield ratio, which therefore corroborates the robustness of the parameter ΔDOP*.
Discussion
The APA and therefore the utilization of DOP usually is controlled by various factors such as the DIP concentration, seawater temperature, phytoplankton biomass, and the biodiversity and overall activity of the microbial communities. Furthermore, trace metals used as essential enzyme co-factors (e.g., Fe, Zn) for the activity of AP1,11,20,44,65 play a key role. However, the DIP concentration is regarded as the most important factor controlling the DOP utilization. DIP is known to be inversely correlated with the APA1,17. Previous studies5,13,16,17,21 have shown that APA increases when the DIP concentration is below a certain threshold, known as the DIP threshold for the APA (Table S3). This DIP threshold has been confirmed by our study through applying a segmented regression approach (Fig. S11). For instance, at stations in the Bohai Sea, the DIP threshold was identified to be at 0.02 μM DIP in the summer (B1Sum) although no threshold was identified in spring (B1Spr) at the same station (Fig. S11b). In the East China Sea and the Yellow Sea, the DIP threshold was 0.02 μM but only when the only oligotrophic station (Y2) was excluded (Fig. S11a). The APA and DIP concentration at Y2 characterized as oligotrophic-like were also close to those measured in oligotrophic open oceans17,21,66, which corroborates the validity of our data. However, even though the importance of DIP has been well studied, the DIP thresholds generally vary in different oceanic regions (Table S3).
In addition, we found that Chl a concentrations were positively correlated with APA, ΔDOP and ΔDOP* (Fig. 5a). Chl a normalized APA (APA / Chl a) was also significantly increased after aerosol and riverine water additions in the Bohai Sea (B1Spr, B1Sum) and Yellow Sea (Y3Sum) (Fig. S7), which suggests that phytoplankton biomass plays a key role in the DOP utilization in coastal seas65. The Log10 ratio of Chl a / DIP [Log10 (Chl a / DIP)] was therefore introduced as an indicator for the likelihood of elevated P requirement by phytoplankton. A positive correlation was found between Log10 (Chl a / DIP) and the relative change of APA after the additions of aerosol and riverine water, indicating DOP utilization as a consequence of aerosol deposition and river runoff in coastal seas (Fig. 6a). In addition, the relative change of APA was not significantly correlated with N* (DIN–16 × DIP) in terms of DIP deficiency or P* (DIP–DIN / 16) in terms of DOP consumption or accumulation44,67 (Fig. S12), suggesting the important role of phytoplankton biomass (Chl a) in affecting DOP utilization in coastal seas. Moreover, APA always increased in our experiments when Log10 (Chl a / DIP) was ≥ 1.20 (Fig. 6a). This suggests that Log10 (Chl a / DIP) might serve as a new index which can be applied globally because our experiments covered surface marine ecosystems from oligotrophy to eutrophy (Figs. 6b and S2–3).

a Correlation between the relative change of activity of alkaline phosphatase (APA) and the ratio of chlorophyll a to dissolved inorganic phosphorus [Log10 (Chl a / DIP)] for control (APAC) and treatment groups (APAT). The blue and red lines (best-fit line) with shades (95% confidence level) represent the results of the linear regression with and without data of the oligotrophic station (Y2), respectively. p values from a two-sided test are shown. n, number of samples. b The distribution of Log10 (Chl a / DIP) in the global surface ocean (upper 20 m) calculated using average Chl a data from SeaWIFS and MODIS-Aqua and average DIP data from WOA 2018. Green points represent Log10 (Chl a / DIP) larger than 1.20, which is considered the threshold for DOP utilization stimulated by atmospheric deposition. The color scale indicates the climatological Log10 (Chl a / DIP) in the global ocean (1° × 1°). Source data are provided as a Source Data file.
We also found that the relative change of APA after aerosol and riverine water additions was positively correlated with the aerosol and riverine water derived-increase of DIN:DIP (Fig. 5b). APA showed a similar positive response (differences no larger than ±21.0%) to DIN and aerosol additions with same DIN content at Y1, B1Spr, and B1Sum (Fig. 3c, e, f and S5a-c). Although the role of essential trace metals such as Zn and Co for the APA was not tested in our study, the APA did not significantly respond to Fe or N+Fe additions (Figs. S4 and S5), and the APA in the aerosol treatment was comparable to those of the riverine water treatment (Fig. 3e-f and S6a-b), suggesting that other trace metals usually enriched in aerosol and riverine water were likely not having a substantial impact on our results. Indeed, the concentrations of trace metals are generally deemed to be elevated in coastal seas30,68,69,70. Our results were corroborated by a study in the Western English Channel where the increase in APA was associated with increased river runoff resulting in elevated N:P ratios18. Thus, apart from the atmospheric deposition, river runoff likely also enhances DOP utilization in the coastal seas through a similar mechanism. However, air pollutants relative to river runoff will have an impact over larger geographical areas because of atmospheric long-range transport41.
The seawater temperature, although an important factor determining enzyme activity20, is likely not the main determining factor for DOP utilization although it has an influence due to the temperature-dependence of enzyme activity. For example, in the subtropical Atlantic at relatively high seawater temperatures (21–29 °C) and off the coast of northern Oregon at relatively low seawater temperatures (11–12 °C), AP was activated regardless of the water temperature when phytoplankton experienced P stress13,17.
Collectively, our results demonstrate that aerosol and riverine water enhance the APA primarily by providing N, leading to an increase of DIN:DIP ratios and Chl a concentrations. Thus, our results suggest that aerosol deposition and river runoff activate a nitrogen pump (Anthropogenic Nitrogen Pump, ANP) exacerbating DIP deficiency, which stimulate the utilization of DOP (Fig. 7). Moreover, using the new index [Log10 (Chl a / DIP)], we identified that the regions with positive Log10 (Chl a / DIP) values were generally corresponding to low DIP and DOP concentrations, indicating the geographic location where DIP deficiency and DOP utilization maybe observed4,44. Higher Log10 (Chl a / DIP) ( ≥ 1.20) values were mainly identified in coastal seas at a global scale where the imbalance of N and P nutrients has become increasingly prevalent in recent years39, including the Mediterranean Sea, the Gulf of Mexico, and the Red Sea where APA has been detected1 and a wide range of coastal seas where no relevant studies have been done yet (Fig. 6b). Therefore, the ANP has the potential to enhance DOP utilization across global coastal seas. The Arctic Coastal Seas appears to be a special case because although the Arctic shelf generally is characterized by elevated DIP and DOP concentrations4,44, higher Log10 (Chl a / DIP) ( ≥ 1.20) values were also found. This might be related to the decrease of sea-ice cover due to rapid global warming in the Arctic, which reduces nutrient concentrations in surface waters71. Furthermore, our study indicates the vital role of DOP as the main phosphorus source in enhancing DIN uptake by phytoplankton with consequences for the N:P ratios (Figs. 2, 5, and S13). Thus, the utilization of DOP can support phytoplankton to cope with phosphorus limitation5,72, and can even shift the limiting nutrient to N as shown at station B1Spr in the central Bohai Sea (Fig. 2a and Table S2), which usually is characterized as an ecosystem that limits phytoplankton productivity by the availability of P53.

In coastal seas, atmospheric deposition and river runoff are mainly contributing dissolved inorganic nitrogen (DIN) whereas in the surface open ocean, atmospheric deposition is mainly contributing essential trace metals for enhancing the activity of the alkaline phosphatase (APA). DIN therefore increases in surface waters of the coastal seas leading to higher N:P ratios, enhanced phytoplankton growth, and the uptake of dissolved inorganic phosphorus (DIP). Once DIP is below a certain threshold, the APA significantly increases. This process leads to an increase in the utilization of dissolved organic phosphorus (DOP).
Increasing anthropogenic N input in recent years at a global level has elevated the N:P ratios in coastal seawater, and progressively expanded beyond the coastal regions23,24,39,43. In the context of decreased prevalence of N deficiency over time, the impact of N input is gradually shifting from alleviating N limitation to increasing DIP limitation, especially in coastal regions39,43,73. Over the past four decades, the disproportionate and sustained input of N relative to P into the China Coastal Seas has led to the transition from N to P limitation in extensive coastal areas43, which has also been observed around the globe wherever coastal seas receive significant input of N either by atmospheric deposition or through riverine input. If this N input continues under a ‘business-as-usual’ scenario, coastal biogeochemical processes require re-examination because our data suggest that DOP utilization by phytoplankton will become increasingly important with consequences for P-cycling in coastal seas. Atmospheric N input to the ocean has significantly increased from 1850 (10 Tg N yr−1) to 2005 (39 Tg N yr−1), and is expected to remain elevated until at least 2100 (-17%–+8%)23 at a business-as-usual scenario. Thus, the Anthropogenic Nitrogen Pump is at least expected to have a continued impact on the biogeochemistry of coastal seas globally, and its role might even become more prominent under increasing N deposition22 unless we reduce the input of terrigenous N-rich material such as part of aerosols and riverine water.
Methods
Collection and chemical analysis of atmospheric aerosols and riverine water
Atmospheric aerosols were collected at the Atmospheric Environment Monitoring Station in the Laoshan campus of the Ocean University of China, Qingdao, China (36.16° N, 120.50° E), about seven kilometers off the coast of the Yellow Sea (Fig. 1). The sampling was conducted under haze weather (visibility <10 km, relative humidity <90%) in January 2018 (Aerosol 1), January 2019 (Aerosol 2), and June 2019 (Aerosol 3) (Table S1). The aerosols were collected onto an acid washed filter (Whatman, 41#) through a high-volume sampler (KC-1000, Laoshan electronic instrument company of Qingdao) operated at a flow rate of 1.0 m3·min−1 for about 20 hours uninterruptedly, and a blank was simultaneously collected at a flow rate of 0 m3·min−1 under the same condition74.
The aerosol sample was divided up into several aliquots for chemical analyses and the on-board microcosm experiments. For chemical analyses, two parts of the filter were extracted ultrasonically with deionized water (18.2 MΩ cm) in an ice-water bath for 40 minutes and the extracts was filtered instantly through a PES membrane (aperture 0.45 μm). The first extract was used for nutrient (NO3- + NO2-, NH4+, DIP, and Si (OH)4) analysis using an QuAAtro continuous-flow analyser (SEAL Analytical)47. The second extract was digested using 15.5 mol·L−1 HNO3 and then evaporated. The solution was used for dissolved trace metal analysis using an Agilent 7500c ICP-MS75. The detection limit was 0.4 μg·L−1 for Fe and was 0.09 μg·L−1 for other metals. The third part of the filter was used for aerosol amendments in the microcosm experiments. It was extracted before the microcosm experiments took place following the same procedure as described above for the nutrient analysis76,77.
The riverine water was collected using a surface-water collector in the Xiaoqing River in 2019. The riverine water was filtered through acid-washed acetate fiber membranes (0.45 μm pore size) and stored in HDPE bottles at -20 °C. It was defrosted in the dark at room temperature (18–20 °C) before measuring the chemical composition. Nutrient concentrations (NO3- + NO2-, NH4+, DIP, and Si (OH)4) of riverine water were then measured using the QuAAtro continuous-flow analyser (SEAL Analytical)47.
Set up of microcosm experiments
Eight on-board microcosm experiments were carried out at five stations in the East China Sea, the Yellow Sea, and the Bohai Sea using surface seawater collected in spring (March—April) and summer (July—August) during the cruises 2018 by R/V Dongfonghong 2 and 2019 by R/V Beidou, respectively (Fig. 1). Surface seawater (3–5 m depth) as well as water from the DCM layer of Y1 were collected by Teflon-coated Niskin bottles assembly on a SeaBird CTD and pre-filtered through 200 μm acid-washed nylon mesh to eliminate large zooplankton. They were transferred into transparent polycarbonate bottles, and instantly spiked with the extract of aerosol sample (20 L bottle experiments, Nalgene 2251-0050) and combinations of nutrients / trace metals (KNO3, 2 μM; KH2PO4, 0.2 μM; FeCl3, 2 nM) (2 L bottle experiments, Nalgene 2015-2000), respectively (Table S4). Aerosol 1 was used for the microcosm experiments at Y2, Y3Spr, and Y3Sum, Aerosol 2 for those at E1 and B1Spr, and Aerosol 3 for those at Y1 and B1Sum (Table S4). Riverine water amendments were also set up in the 20 L bottle experiments at B1Spr and B1Sum, to make a comparison with aerosol treatments under the condition of same DIN supply. The added amount of aerosol and riverine water was calculated based on their DIN (NO3- + NO2- + NH4+) concentrations (0.5, 1, 2 μM, Table S4). Three parallel experiments (n = 3 samples) were set up for each treatment. The bottles were placed in three microcosm tanks and incubated for 4–6 days for 20 L bottle experiments and 3–5 days for 2 L bottle experiments with flow-through surface seawater to keep the temperature stable and like in-situ conditions. The experiments were covered by photomask to attenuate photosynthetically active radiation by around 40%78.
Sampling and measurements
To mix the substances in bottles adequately, samples were taken after gentle shaking. Subsamples for the Chl a and nutrient analysis were taken every 24 h during most of the incubations. Samples for APA analysis were mostly taken at the beginning, middle and the end of the incubations, and samples for the DOP measurements were taken at the beginning and end of the incubations.
Chlorophyll a measurements
Triplicate samples of 200–300 mL were filtered through 20 (nylon, Millipore), 2 (polycarbonate, Whatman) and 0.2 (polycarbonate, Whatman) μm aperture sized membranes in time series, and total Chl a concentrations were calculated by combining size-separated Chl a concentrations for the 20 L incubation systems, and 100–150 mL were filtered through a GF/F membrane (Whatman) to measure total Chl a for the 2 L incubation systems. The pigments on the membranes were extracted with 90% acetone at -20 °C for 20 h in the dark. The extract was used for measuring Chl a using a 7200-000 Trilogy fluorometer (Turner Designs)47.
Inorganic and organic nutrients
100 mL samples of 20 L bottle experiments were filtered through 0.45 μm acid-washed acetate membrane, and the filtrate was stored in acid-washed HDPE bottles at -20 °C. The samples were melted at room temperature 48 hours before measuring them. 50 mL of filtrate was used for determining inorganic nutrients (NO3- + NO2-, NH4+, DIP, Si(OH)4) using a QuAAtro continuous-flow analyser (SEAL Analytical)47. The detection limits of NO3- + NO2-, NH4+, and Si(OH)4 were ≤0.02 μM, ≤0.02 μM, and ≤0.03 μM, respectively47. The long optical fiber technology was used to measure DIP concentration and its detection limit was estimated to be ≤0.005 μM79. The error margin for the DIP analysis was 1.39% of the average value of 0.06 μM, which represents the relative standard deviation of five replicates. To measure total dissolved phosphorus (TDP) and dissolved organic phosphorus (DOP), 40 mL filtrate and 4 mL oxidizing agent were put into a Teflon digestion tank and were disintegrated at 120 °C for 20 min in an autoclave to enable the detection of TDP. The oxidizing agent was made by dissolving 10 g K2S2O8 and 6 g H3BO3 in 200 mL prepared NaOH solution (0.375 mol·L−1)80. The detection limit of TDP was 0.02 μM, and the error margins for TDP analysis was 0.77% of the average value of 0.20 μM through the same calculating method as that of DIP. DOP was estimated by subtracting DIP from TDP. The detection limit (0.025 μM) for DOP analysis was calculated by the sum of those of DIP and TDP (DLDIP + DLTDP). The error margin for DOP analysis (1.27% of the average value of 0.14 μM) was calculated using the standard deviations (SD) and average values (avg) of five replicates for TDP and DIP analysis (Eq. 4).
Activity of Alkaline Phosphatase (APA)
4-methylumpholone phosphate (MUF-P) was used as the substrate to analyze APA. MUF-P was converted to PO43- and 4-methylumpholone (MUF) by the alkaline phosphatase, in which MUF showed fluorescence when pH is above 1081. For 2 L bottle experiments in 2019 and 20 L bottle experiments in 2018 in summer and in 2019, 45 mL sample with 200–1000 nM MUF-P was incubated in the microcosm tank in the dark after gently mixing11. The fluorescence and therefore the APA (nM P·h−1) were calculated estimated by time-course measurements (0, 1.5, and 3 h) using the 7200-000 Trilogy fluorometer (Turner Designs) with the long wavelength UV module (P/N 7000-967) after adding borate buffer (pH = 10.8–11.2) to the samples82. The concentration of MUF corresponding to the fluorescence was calculated using the standard curve (0–1 μM) configured with MUF-2Na5,82.
Data analyses
As the seawater was collected at different nutrient status and phytoplankton growth stage, the Chl a concentration and its response to different treatment were variable (Figs. S1 and S2). The response of phytoplankton to nutrient, aerosol, and riverine water additions was there quantified by ∆R61, which was expressed as:
where Chl ac-avg and Chl at-avg stand for the average Chl a concentration in the control and N, P, N + P, aerosol, or riverine water treatment groups, respectively, over the time course during the microcosm experiments (n = 3 samples); t represents duration of microcosm experiment in days.
Nutrient utilizations were estimated by the decrease of nutrient concentrations (DIN, DIP, or DOP) over time during the incubations:
where the X0 and Xt represent the nutrient concentrations at the beginning and the end of the incubations, respectively (n = 3 samples) (Figs. S3 and S8).
P* = DIP–DIN / 16 is often used to determine excess of available dissolved inorganic phosphorus (DIP). A positive correlation between surface DOP concentration and P* was found on a global level11,44. The potential maximum DOP utilization during the incubations was therefore calculated according to:
where the ΔDIN and ΔDIP represent the change of DIN and DIP concentrations, respectively, during the incubations. The number 16 represents the standard Redfield Ratio for N:P requirement of phytoplankton. Although the nutrient uptake ratio can vary83, the POC:PON ratios in this study (4.07–10.50, mean = 6.96) were close to Redfield ratio (C:N = 6.63) and positive correlations were measured between ΔDOP*, ΔDOP, and APA, indicating the robustness of the parameter ΔDOP* in this study (Fig. 5a and S14).
The error margin for DOP analysis was calculated using the standard deviations (SD) and average values (avg) of five replicates for TDP and DIP analysis according to:
Statistical analyses
The response of Chl a to nutrient additions (Fig. 2a), the response of APA to nutrient, aerosol, and riverine water additions (Figs. 3 and S4–7), and the differences in P utilization (Fig. 4, S6, and S9) were evaluated using one-way ANOVA. A Tukey HSD post hoc test was used to identify statistically significant differences. We used the “aov” function for one-way ANOVA, and the “TukeyHSD” function for Tukey HSD post hoc test in the R package “stats”61. Unpaired t-test (two-sided) was used to identify statistically significant differences between the response of Chl a to treatments (aerosol and riverine water) in spring and summer (Fig. 2b), and between the P utilization in control and treatments (aerosol and riverine water) (Fig. 4). We used the “t.test” function for unpaired t-test in the R package “stats”84. Nonparametric Spearman correlation test (r) (two-sided) was used to evaluate the correlation between parameters (Chl a, ΔDIN, ΔDIP, ΔDOP, and ΔDOP*) that could impact DOP utilization (Fig. 5a). Linear regression was used in Figs. 5b, 6a, and S12. To explore the statistically significant threshold of APA and DIP concentrations, a segmented regression was conducted through R package “segmented”85. To investigate Log10 (Chl a / DIP) in the global surface ocean (upper 20 m, 1° × 1°), we obtained Chl a concentration data at 9-km spatial resolution from SeaWiFS86 and MODIS-Aqua87 ocean color observations and the climatological mean for DIP data from World Ocean Atlas 201888.
Reporting summary
Further information on research design is available in the Nature Portfolio Reporting Summary linked to this article.
Data availability
Data of microcosm experiments, chemical analyses of aerosols and riverine water used in this study are available in figshare under accession code [https://figshare.com/s/aed72ac92028a0e0f705]. The Level-3 satellite data (Chlorophyll a) used in this study are available in the SeaWIFS database [https://oceancolor.gsfc.nasa.gov/data/seawifs/] and MODIS-Aqua database [https://oceancolor.gsfc.nasa.gov/data/aqua/]. The data used for generating the climatological mean for the dissolved inorganic phosphorus are available in the World Ocean Atlas 2018 database [https://www.ncei.noaa.gov/products/world-ocean-atlas]. Maps were generated in matlab using M_Map (https://www.eoas.ubc.ca/~rich/mapug.html). Source data are provided with this paper.
References
Lin, S., Litaker, R. W. & Sunda, W. G. Phosphorus physiological ecology and molecular mechanisms in marine phytoplankton. J. Phycol. 52, 10–36 (2016).
Duhamel, S. et al. Phosphorus as an integral component of global marine biogeochemistry. Nat. Geosci. 14, 359–368 (2021).
Justić, D., Rabalais, N. N., Turner, R. E. & Dortch, Q. Changes in nutrient structure of river-dominated coastal waters: stoichiometric nutrient balance and its consequences. Estuar., Coast. Shelf Sci. 40, 339–356 (1995).
Moore, C. M. et al. Processes and patterns of oceanic nutrient limitation. Nat. Geosci. 6, 701–710 (2013).
Zhang, X., Zhang, J., Shen, Y., Zhou, C. & Huang, X. Dynamics of alkaline phosphatase activity in relation to phytoplankton and bacteria in a coastal embayment Daya Bay, South China. Mar. Pollut. Bull. 131, 736–744 (2018).
Mo, Y., Ou, L., Lin, L. & Huang, B. Temporal and spatial variations of alkaline phosphatase activity related to phosphorus status of phytoplankton in the East China Sea. Sci. Total Environ. 731, 139192 (2020).
Thomson, B. et al. Relative Importance of Phosphodiesterase vs. Phosphomonoesterase (Alkaline Phosphatase) Activities for Dissolved Organic Phosphorus Hydrolysis in Epi- and Mesopelagic Waters. Front. Earth Sci. 8, 560893 (2020).
Reynolds, S., Mahaffey, C., Roussenov, V. & Williams, R. G. Evidence for production and lateral transport of dissolved organic phosphorus in the eastern subtropical North Atlantic. Glob. Biogeochem. Cycle 28, 805–824 (2014).
Kolowith, L. C., Ingall, E. D. & Benner, R. Composition and cycling of marine organic phosphorus. Limnol. Oceanogr. 46, 309–320 (2001).
Duhamel, S., Björkman, K. M., Van Wambeke, F., Moutin, T. & Karl, D. M. Characterization of alkaline phosphatase activity in the North and South Pacific Subtropical Gyres: Implications for phosphorus cycling. Limnol. Oceanogr. 56, 1244–1254 (2011).
Browning, T. J. et al. Iron limitation of microbial phosphorus acquisition in the tropical North Atlantic. Nat. Commun. 8, 15465 (2017).
Sebastián, M., Arístegui, J., Montero, M. F., Escanez, J. & Xavier Niell, F. Alkaline phosphatase activity and its relationship to inorganic phosphorus in the transition zone of the North-western African upwelling system. Prog. Oceanogr. 62, 131–150 (2004).
Dyhrman, S. T. & Ruttenberg, K. C. Presence and regulation of alkaline phosphatase activity in eukaryotic phytoplankton from the coastal ocean: Implications for dissolved organic phosphorus remineralization. Limnol. Oceanogr. 51, 1381–1390 (2006).
Fitzsimons, M. F., Probert, I., Gaillard, F. & Rees, A. P. Dissolved organic phosphorus uptake by marine phytoplankton is enhanced by the presence of dissolved organic nitrogen. J. Exp. Mar. Biol. Ecol. 530-531, 151434 (2020).
Ma, J., Wang, P., Ren, L., Wang, X. & Paerl, H. W. Using alkaline phosphatase activity as a supplemental index to optimize predicting algal blooms in phosphorus-deficient lakes: A case study of Lake Taihu, China. Ecol. Indic. 103, 698–712 (2019).
Suzumura, M., Hashihama, F., Yamada, N. & Kinouchi, S. Dissolved phosphorus pools and alkaline phosphatase activity in the euphotic zone of the western North Pacific Ocean. Front. Microbiol. 3, 99 (2012).
Mahaffey, C., Reynolds, S., Davis, C. E. & Lohan, M. C. Alkaline phosphatase activity in the subtropical ocean: insights from nutrient, dust and trace metal addition experiments. Front. Mar. Sci. 1, (2014).
Rees, A. P. et al. Alkaline phosphatase activity in the western English Channel: Elevations induced by high summertime rainfall. Estuar., Coast. Shelf Sci. 81, 569–574 (2009).
Ruttenberg, K. C. & Dyhrman, S. T. Dissolved organic phosphorus production during simulated phytoplankton blooms in a coastal upwelling system. Front. Microbiol. 3, 274 (2012).
Yoshihiro, I. et al. Characteristics of psychrophilic alkaline phosphatase. Biosci., Biotechnol., Biochem. 62, 2246–2250 (1998).
Lomas, M. W. et al. Sargasso Sea phosphorus biogeochemistry: an important role for dissolved organic phosphorus (DOP). Biogeosciences 7, 695–710 (2010).
Gruber, N. & Galloway, J. N. An Earth-system perspective of the global nitrogen cycle. Nature 451, 293–296 (2008).
Jickells, T. D. et al. A reevaluation of the magnitude and impacts of anthropogenic atmospheric nitrogen inputs on the ocean. Glob. Biogeochem. Cycle, 31, 289–305 (2017).
Wang, J. et al. Spatially Explicit Inventory of Sources of Nitrogen Inputs to the Yellow Sea, East China Sea, and South China Sea for the Period 1970–2010. Earth’s Future 8, e2020EF001516 (2020).
Zheng, L. & Zhai, W. Nutrient dynamics in the Bohai and North Yellow seas from seasonal to decadal scales: Unveiling Bohai Sea eutrophication mitigation in the 2010s. Sci. Total Environ. 905, 167417 (2023).
Baker, A. R. & Jickells, T. D. Atmospheric deposition of soluble trace elements along the Atlantic Meridional Transect (AMT). Prog. Oceanogr. 158, 41–51 (2017).
Qi, J., Yu, Y., Yao, X., Gang, Y. & Gao, H. Dry deposition fluxes of inorganic nitrogen and phosphorus in atmospheric aerosols over the Marginal Seas and Northwest Pacific. Atmos. Res. 245, 105076 (2020).
Jickells, T. D. et al. Global iron connections between desert dust, ocean biogeochemistry, and climate. Science 308, 67–71 (2005).
Beusen, A. H. W., Bouwman, A. F., Van Beek, L. P. H., Mogollón, J. M. & Middelburg, J. J. Global riverine N and P transport to ocean increased during the 20th century despite increased retention along the aquatic continuum. Biogeosciences 13, 2441–2451 (2016).
Harmesa, W., Lestari, A. J., & Taufiqurrahman, E. Variability of trace metals in coastal and estuary: Distribution, profile, and drivers. Mar. Pollut. Bull. 174, 113173 (2022).
Prospero, J. M. & Savoie, D. L. Effect of continental sources on nitrate concentrations over the Pacific Ocean. Nat. (Lond.) 339, 687–689 (1989).
Paerl, H. W. & Whitall, D. R. Anthropogenically-derived atmospheric nitrogen deposition, marine eutrophication and harmful algal bloom expansion: is there a link? Ambio 28, 307–311 (1999).
Stefano, G. et al. The role of atmospheric deposition in the biogeochemistry of the Mediterranean Sea. Prog. Oceanogr. 44, 147–190 (1999).
Lacroix, F., Ilyina, T., Mathis, M., Laruelle, G. G. & Regnier, P. Historical increases in land‐derived nutrient inputs may alleviate effects of a changing physical climate on the oceanic carbon cycle. Glob. Change Biol. 27, 5491–5513 (2021).
Krishnamurthy, A., Moore, J. K., Mahowald, N., Luo, C. & Zender, C. S. Impacts of atmospheric nutrient inputs on marine biogeochemistry. Journal of Geophys. Res. 115, G01006 (2010).
Duce, R. A. et al. Impacts of atmospheric anthropogenic nitrogen on the open ocean. Science 320, 893–897 (2008).
Hodges, B. A. & Rudnick, D. L. Simple models of steady deep maxima in chlorophyll and biomass. Deep Sea Res. Part I: Oceanogr. Res. Pap. 51, 999–1015 (2004).
Gong, X. et al. Analytical solution of the nitracline with the evolution of subsurface chlorophyll maximum in stratified water columns. Biogeosciences 14, 2371–2386 (2017).
Penuelas, J. & Sardans, J. The global nitrogen-phosphorus imbalance. Science 375, 266–267 (2022).
Kim, T. W., Lee, K., Najjar, R. G., Jeong, H. D. & Jeong, H. J. Increasing N abundance in the northwestern pacific ocean due to atmospheric nitrogen deposition. Science 334, 505–509 (2011).
Galloway, J. N. et al. Transformation of the nitrogen cycle: recent trends, questions, and potential solutions. Science 320, 889–892 (2008).
Li, H. et al. Nutrient budgets for the Bohai Sea: Implication for ratio imbalance of nitrogen to phosphorus input under intense human activities. Mar. Pollut. Bull. 179, 113665 (2022).
Moon, J. Y. et al. Anthropogenic nitrogen is changing the East China and Yellow seas from being N deficient to being P deficient. Limnol. Oceanogr. 66, 914–924 (2021).
Liang, Z., Letscher, R. T. & Knapp, A. N. Dissolved organic phosphorus concentrations in the surface ocean controlled by both phosphate and iron stress. Nat. Geosci. 15, 651–657 (2022).
Moore, C. M. et al. Relative influence of nitrogen and phosphorus availability on phytoplankton physiology and productivity in the oligotrophic sub-tropical North Atlantic Ocean. Limnol. Oceanogr. 53, 291–305 (2008).
Chu, Q. et al. Promotion effect of asian dust on phytoplankton growth and potential dissolved organic phosphorus utilization in the South China Sea. J. Geophys. Res.: Biogeosci. 123, 1101–1116 (2018).
Zhang, C. et al. Phytoplankton growth response to Asian dust addition in the northwest Pacific Ocean versus the Yellow Sea. Biogeosciences 15, 749–765 (2018).
Uno, I. et al. Asian dust transported one full circuit around the globe. Nat. Geosci. 2, 557–560 (2009).
Tan, S., Li, J., Che, H., Chen, B. & Wang, H. Transport of East Asian dust storms to the marginal seas of China and the southern North Pacific in spring 2010. Atmos. Environ. 148, 316–328 (2017).
Uno, I. et al. Numerical study of the atmospheric input of anthropogenic total nitrate to the marginal seas in the western North Pacific region. Geophys. Res. Lett. 34, L17817 (2007).
Shou, W., Zong, H., Ding, P. & Hou, L. A modelling approach to assess the effects of atmospheric nitrogen deposition on the marine ecosystem in the Bohai Sea, China. Estuar., Coast. Shelf Sci. 208, 36–48 (2018).
Zhang, J. et al. Dynamics of inorganic nutrient species in the Bohai seawaters. J. Mar. Syst. 44, 189–212 (2004).
Liu, H. & Yin, B. Numerical investigation of nutrient limitations in the Bohai Sea. Mar. Environ. Res. 70, 308–317 (2010).
Liu, S. et al. Water quality assessment by pollution-index method in the coastal waters of Hebei Province in western Bohai Sea, China. Mar. Pollut. Bull. 62, 2220–2229 (2011).
Sharples, J., Middelburg, J. J., Fennel, K. & Jickells, T. D. What proportion of riverine nutrients reaches the open ocean? Glob. Biogeochem. Cycle 31, 39–58 (2017).
Wang, B., Wang, X. & Zhan, R. Nutrient conditions in the Yellow Sea and the East China Sea. Estuar., Coast. Shelf Sci. 58, 127–136 (2003).
Lin, C., Ning, X., Su, J., Lin, Y. & Xu, B. Environmental changes and the responses of the ecosystems of the Yellow Sea during 1976–2000. J. Mar. Syst. 55, 223–234 (2005).
Longhurst, A., Sathyendranath, S., Platt, T. & Caverhill, C. An estimate of global primary production in the ocean from satellite radiometer data. J. Plankton Res. 17, 1245–1271 (1995).
Holt, J. et al. Modelling the global coastal ocean. Philos. Trans. R. Soc. A: Math., Phys. Eng. Sci. 367, 939–951 (2009).
PILKAITYTË, R., SCHOOR, A. & SCHUBERT, H. Response of phytoplankton communities to salinity changes: a mesocosm approach. Hydrobiologia 513, 27–38 (2004).
Andersen, I. M., Williamson, T. J., González, M. J. & Vanni, M. J. Nitrate, ammonium, and phosphorus drive seasonal nutrient limitation of chlorophytes, cyanobacteria, and diatoms in a hyper‐eutrophic reservoir. Limnol. Oceanogr. 65, 962–978 (2020).
Nausch, M. et al. Concentrations and Uptake of Dissolved Organic Phosphorus Compounds in the Baltic Sea. Front. Mar. Sci. 5, 386 (2018).
Nausch, M. & Nausch, G. Dissolved phosphorus in the Baltic Sea — Occurrence and relevance. J. Mar. Syst. 87, 37–46 (2011).
Giovannoni, S. J. & Stingl, U. Molecular diversity and ecology of microbial plankton. Nature 437, 343–348 (2005).
Labry, C., Delmas, D. & Herbland, A. Phytoplankton and bacterial alkaline phosphatase activities in relation to phosphate and DOP availability within the Gironde plume waters (Bay of Biscay). J. Exp. Mar. Biol. Ecol. 318, 213–225 (2005).
Browning, T. J. et al. Nutrient co‐limitation in the subtropical Northwest Pacific. Limnol. Oceanogr. Lett. 7, 52–61 (2022).
Sarmiento, N. G. J. L. Global patterns of marine nitrogen fixation and denitrification. Glob. Biogeochem. Cycle 11, 235–266 (1997).
Karavoltsos, S., Sakellari, A., Dassenakis, M., Bakeas, E. & Scoullos, M. Trace metals in the marine surface microlayer of coastal areas in the Aegean sea, Eastern Mediterranean. Estuar., Coast. Shelf Sci. 259, 107462 (2021).
Gaulier, C. et al. Trace metal speciation in North Sea coastal waters. Sci. Total Environ. 692, 701–712 (2019).
Gao, X., Zhou, F. & Chen, C. A. Pollution status of the Bohai Sea: An overview of the environmental quality assessment related trace metals. Environ. Int. 62, 12–30 (2014).
Randelhoff, A. et al. Pan-Arctic Ocean Primary Production Constrained by Turbulent Nitrate Fluxes. Front. Mar. Sci. 7, 150 (2020).
Zhou, L., Tan, Y., Huang, L. & Wang, W. Enhanced utilization of organic phosphorus in a marine diatom Thalassiosira weissflogii: A possible mechanism for aluminum effect under P limitation. J. Exp. Mar. Biol. Ecol. 478, 77–85 (2016).
Kwon, E. Y. et al. Nutrient uptake plasticity in phytoplankton sustains future ocean net primary production. Sci. Adv. 8, eadd2475 (2022).
Wang, L., Qi, J. H., Shi, J. H., Chen, X. J. & Gao, H. W. Source apportionment of particulate pollutants in the atmosphere over the Northern Yellow Sea. Atmos. Environ. 70, 425–434 (2013).
Shi, J. et al. High Production of Soluble Iron Promoted by Aerosol Acidification in Fog. Geophys. Res. Lett. 47, e2019GL086124 (2020).
Meng, X., Chen, Y., Wang, B., Ma, Q. W. & Wang, F. J. Responses of phytoplankton community to the input of different aerosols in the East China Sea. Geophys. Res. Lett. 43, 7081–7088 (2016).
Zhang, C. et al. Fertilization of the Northwest Pacific Ocean by East Asia Air Pollutants. Glob. Biogeochem. Cycle 33, 690–702 (2019).
Zhang, C. et al. Dynamics of phytoplankton and nutrient uptake following dust additions in the northwest Pacific. Sci. Total Environ. 739, 139999 (2020).
MA, J., YUAN, D., ZHANG, M. & LIANG, Y. Reverse flow injection analysis of nanomolar soluble reactive phosphorus in seawater with a long path length liquid waveguide capillary cell and spectrophotometric detection. Talanta 78, 315–320 (2009).
Ridal, J. J. & Moore, R. M. A re-examination of the measurement of dissolved organic phosphorus in seawater. Mar. Chem. 29, 19–31 (1990).
Hoppe, H. Significance of exoenzymatic activities in the ecology of brackish water: measurements by means of methylumbelliferyl-substrates. Mar. Ecol. Prog. Ser. 11, 299–308 (1983).
Sohm, J. A., Mahaffey, C. & Capone, D. G. Assessment of relative phosphorus limitation of Trichodesmium spp. in the North Pacific, North Atlantic, and the north coast of Australia. Limnol. Oceanogr. 53, 2495–2502 (2008).
Martiny, A. C. et al. Strong latitudinal patterns in the elemental ratios of marine plankton and organic matter. Nat. Geosci. 6, 279–283 (2013).
Fazio, F. et al. Environmental Investigations and Tissue Bioaccumulation of Heavy Metals in Grey Mullet from the Black Sea (Bulgaria) and the Ionian Sea (Italy). Animals 10, 1739 (2020).
Muggeo, V. M. R. Estimating regression models with unknown break-points. Stat. Med. 22, 3055–3071 (2003).
NASA Goddard Space Flight Center, Ocean Ecology Laboratory & Ocean Biology Processing Group. Sea-viewing Wide Field-of-view Sensor (SeaWiFS) Chlorophyll Data; Reprocessing. NASA OB.DAAC, Greenbelt, MD, USA. https://doi.org/10.5067/ORBVIEW-2/SEAWIFS/L3M/CHL/2022. (2022).
NASA Goddard Space Flight Center, Ocean Ecology Laboratory & Ocean Biology Processing Group. Moderate-resolution Imaging Spectroradiometer (MODIS) Aqua Chlorophyll Data; Reprocessing. NASA OB.DAAC, Greenbelt, MD, USA. https://doi.org/10.5067/AQUA/MODIS/L3M/CHL/2022. (2022).
NutrientsGarcia, H. E., et al. World Ocean Atlas 2018, Volume 4: Dissolved Inorganic Nutrients (phosphate, nitrate and nitrate+nitrite, silicate). A. Mishonov Technical Ed.; NOAA Atlas NESDIS 84, 35 pp (2018).
Acknowledgements
This work was funded by NSFC-Shandong Joint Fund (U1906215), National Key R&D Program of China (2022YFF0803000), National Natural Science Foundation of China (NSFC) (41906119, 41876125, 42176022), Fundamental Research Funds for the Central Universities (202072001). Data and samples for microcosm experiments were collected onboard of R/V “Dongfanghong 2”, R/V “Beidou”, and R/V “Lanhai101” implementing the open research cruise NORC2018-1, NORC2019-1, NORC2020-1, and NORC2023-1 supported by NSFC Shiptime Sharing Project (project number: 41576118, 41849901, 41949901, and 42249901). T.M. acknowledges funding provided by NERC under grant NE/W005654/1 and the School of Environmental Sciences for partial support to supervise Haoyu Jin and to write and edit this paper.
Author information
Authors and Affiliations
Contributions
H.J., C.Z. and H.G. conceptualized the work and designed the study. H.J. drafted the first version of the manuscript. C.Z., T.M., X.D., Y.Z., L.M., X.Y., Y.G. and H.G. contributed to later visions of the manuscript. H.J., C.Z., Q.W., S.M. and X.D. performed the field investigation. F. S. contributed additional experiments and analyses to address reviewers’ comments. H.J., C.Z., S.M. and H.G. conducted the data analysis and visualization. C.Z. and H.G. received funding to conduct this work. C.Z., T.M. and H.G. were responsible for supervision of H.J. All authors gave feedback on the manuscript and have approved the final version of the paper.
Corresponding authors
Ethics declarations
Competing interests
The authors declare no competing interests.
Peer review
Peer review information
Nature Communications thanks Mark Fitzsimons and the other, anonymous, reviewers for their contribution to the peer review of this work. A peer review file is available.
Additional information
Publisher’s note Springer Nature remains neutral with regard to jurisdictional claims in published maps and institutional affiliations.
Supplementary information
Source data
Rights and permissions
Open Access This article is licensed under a Creative Commons Attribution 4.0 International License, which permits use, sharing, adaptation, distribution and reproduction in any medium or format, as long as you give appropriate credit to the original author(s) and the source, provide a link to the Creative Commons license, and indicate if changes were made. The images or other third party material in this article are included in the article’s Creative Commons license, unless indicated otherwise in a credit line to the material. If material is not included in the article’s Creative Commons license and your intended use is not permitted by statutory regulation or exceeds the permitted use, you will need to obtain permission directly from the copyright holder. To view a copy of this license, visit http://creativecommons.org/licenses/by/4.0/.
About this article

Cite this article
Jin, H., Zhang, C., Meng, S. et al. Atmospheric deposition and river runoff stimulate the utilization of dissolved organic phosphorus in coastal seas. Nat Commun 15, 658 (2024). https://doi.org/10.1038/s41467-024-44838-7
Received:
Accepted:
Published:
DOI: https://doi.org/10.1038/s41467-024-44838-7
Comments
By submitting a comment you agree to abide by our Terms and Community Guidelines. If you find something abusive or that does not comply with our terms or guidelines please flag it as inappropriate.
