
Abstract
We describe a protocol for tissue engineering of synchronously contractile cardiac constructs by culturing cardiac cells with the application of pulsatile electrical fields designed to mimic those present in the native heart. Tissue culture is conducted in a customized chamber built to allow for cultivation of (i) engineered three-dimensional (3D) cardiac tissue constructs, (ii) cell monolayers on flat substrates or (iii) cells on patterned substrates. This also allows for analysis of the individual and interactive effects of pulsatile electrical field stimulation and substrate topography on cell differentiation and assembly. The protocol is designed to allow for delivery of predictable electrical field stimuli to cells, monitoring environmental parameters, and assessment of cell and tissue responses. The duration of the protocol is 5 d for two-dimensional cultures and 10 d for 3D cultures.
Introduction
The overarching goal of cardiac tissue engineering is to create in vitro functional cardiac tissue that can be used as a biological model for studies of cardiac tissue development and/or disease processes, and eventually as an implant to repair injured myocardium. Successfully engineered 3D cardiac tissue should therefore exhibit the important properties of native cardiac tissue, including the assembly of differentiated cardiac cell populations into a 3D syncytium, as well as contractile and electrophysiological functionality.
Although heart tissue was first cultured almost 100 years ago1, the maintenance of differentiated cardiac cells in vitro using traditional cell culture methods continues to be an issue2, as adult cardiomyocytes quickly dedifferentiate in vitro3,4 and neonatal cells are still immature. These facts have driven the development of the biomimetic paradigm of cardiac tissue engineering, which involves the application of physiologically relevant chemical and physical stimuli to cultured cells. A biomimetic approach to cardiac tissue engineering may be designed to recapitulate any number of aspects of the actual in vivo environment, including the convection of blood through perfusion2,5, the presence of hemoglobin via oxygen carriers in the culture medium6 and the exposure of cells to a cyclic stretch7 or to electrical field stimulation8,9.
In recent studies in our group, a biomimetic system designed to deliver electrical signals mimicking those in native heart tissue resulted in the progressive development of conductive and contractile properties characteristic of cardiac tissue, including cell alignment and coupling, increased amplitude of synchronous construct contractions and a remarkable level of ultrastructural organization8,10. One important area of research is the optimization of the parameters of the applied electrical field stimulus, and so our group has expanded our focus to include studies of the effects of electrical field stimulation on cardiac cell populations. Furthermore, with the growing body of research indicating the importance of cell alignment, we have become interested in studying the interactive effects of substrate topography and electrical field stimulation in cell monolayers.
The heart is the body's largest bioelectrical source11. Many groups have been studying electrical signals in the heart, in the context of arrhythmia, defibrillation, pacing and cardiac development. In terms of electrical stimulation of cultured cardiac cells, others have developed in vitro models of arrhythmia12, mechano-electrical feedback13 and protocols for a stable cardiac phenotype in culture14,15. In addition, cardiac cells have been 'electrically' stimulated through the modulation of ion channel expression to study electrical signals in cardiac development16 and cardiac excitability17,18. Our group has pioneered the application of electrical signals in cardiac tissue engineering, to enhance functional coupling of the cells and the formation of synchronously contractile tissue constructs8.
A bioreactor system with electrical stimulation may, in principle, reproduce any specific electrical stimulus in the physiological range. For cardiac tissue engineering, the signals of interest are those found both in the developing and in the adult heart. The presence of endogenous electrical fields and currents in the developing vertebrate embryo has been widely documented19. The main types of electrical currents in embryonic heart are the direct current (DC) signals thought to direct cell migration during the development of the cardiac primitive streak and left–right asymmetry, and the pulsatile signals implicated in the development of the cardiac syncytium16,19,20. The protocol presented here allows for the application of pulsatile electrical field stimuli mimicking those in the adult native heart to cells or tissues. A customized chamber (see Fig. 1) is built to allow for (i) the culture of engineered 3D cardiac tissue, (ii) the inclusion of an unpatterned insert to apply pulsatile electrical field stimulation to cell monolayers or (iii) the inclusion of a microabraded patterned insert to study the interactive effects of pulsatile electrical field stimulation and topography on cell alignment and differentiation.

(a) Overview of experimental setup. An electrical stimulator generates the pulses, which are transmitted to bioreactors located inside an incubator maintained at 37 °C. (b) Schematic diagram of the electrical stimulation chamber (modified Petri dish with carbon rod electrodes). Either an unabraded monolayer culture insert, a microabraded monolayer culture insert or 3D scaffolds may be placed in between the electrodes. (c) Close-up view of platinum wire threaded through carbon rod electrode. (d) Close-up view of silicone adhesive covering the connection between the platinum wire and electrode (platinum wire comes out of adhesive on the right). (e) Photograph of an assembled electrical stimulation chamber. (f) Close-up view of scaffold positioned between electrodes. (g) Close-up view of abraded monolayer culture insert placed between electrodes.
The protocol we present here is for electrical field stimulation of monolayers and tissues in the cardiac tissue engineering context (i.e., to enhance functional performance of cardiac tissues as well as to study the effects of applied electrical fields on cell morphology and differentiation). Given the ubiquity of cellular electrical phenomena, these procedures will likely prove useful in a variety of applications involving electrical field stimulation of cells. In fact, even within our own group, although the procedures we describe have been extensively used in studies of rat neonatal cardiomyocytes8,10,21,22, we have also used subsets of these procedures with C2C12 cells23, adipose-derived human mesenchymal stem cells and human embryonic stem cells to study cardiac differentiation, as well as bovine chondrocytes24 to study cell migration implicated in wound healing. Although we have used many types of cell sources, however, we have not at this point developed advanced methods for measurement of bioelectrical currents25, or in vivo stimulation26 of these alternative cell types, and we refer the reader to other published sources.
Experimental design
The general flow diagram of the complete protocol involving four related processes is shown in Figure 2. The culture chamber (Steps 1–9) can be prepared ahead of time and stored for future use, and cells (isolated according to Steps 29–58 of our accompanying cardiac tissue engineering paper27) are prepared for monolayer (unpatterned or patterned) (Step 10A) or 3D culture (Step 10B). Next, the culture chamber is assembled, cell culture is established and the electrical stimulation is applied (Steps 11–20). Finally, assessments are performed on either live cells or after fixation (Step 21).

The steps in this protocol can generally be divided into (i) preparation of the culture chamber (Steps 1–9), (ii) the preparation of either a monolayer culture insert (Step 10A) or a 3D scaffold (Step 10B), (iii) cultivation of cells with electrical stimulation (Steps 11–20) and (iv) assessments of contractile activity (Step 21A), cell alignment/elongation (Step 21B), histology (Step 21C) and ultrastructure (Step 21D). The culture chamber may be prepared ahead of time and stored for future use, but scaffolds or monolayer culture inserts must be ready by the time cells are prepared.
Culture chamber. It is desirable to maintain a constant position of the scaffolds with respect to direction of the electrical field gradient, although at the same time not restricting the contractions of cells nor the ability to observe the constructs with a microscope. We accomplish this task by assembling a culture chamber composed of carbon rod electrodes placed lengthwise along the bottom of a Petri dish and held in place by silicone adhesive (Fig. 1). The spacing between the electrodes accommodates the width of the constructs between them. The wires dangle free so as to facilitate making detachable electrical connections, which is necessary to change medium and monitor the cells in culture, and they must be composed of a highly biocompatible material. We choose platinum wire, which is highly compatible, durable and flexible.
All of the components in this system are easily obtainable and (with the exception of the platinum wires) relatively inexpensive. In addition, most of the components are reusable (with the exception of the silicone adhesive and the carbon rods28).
Monolayer versus 3D culture. Systems for studying biological electrical phenomena may be constructed to examine processes at a variety of hierarchical levels: molecular, cellular, cell population (monolayer) and 3D tissue. Monolayer cultures have the advantages that they require fewer cells, facilitate observation of changes in morphology (including cell beating) during culture and require simple and well-established culture systems (such as tissue culture flasks and Petri dishes). An important drawback, however, compared with 3D culture systems, is that monolayer culture is much less similar to the in vivo environment, in part because of reduced amount of cell–cell communication and less physiological cell shape. In addition, there is no substitute for 3D culture for development of tissues for implantation. From the cardiac tissue engineering perspective, therefore, and especially from the standpoint of the biomimetic paradigm, we find 3D culture to be superior to monolayer culture, although monolayer culture provides a very good platform for basic research. In our experience, we have found an iterative combination of experiments performed in monolayer and 3D culture to be best for developing the techniques we present here for cardiac tissue engineering with electrical stimulation.
Microabraded versus unabraded surfaces. In contractile tissues such as myocardium, functional properties are directly related to cellular orientation and elongation. Thus, tissue engineering of a functional cardiac patch critically depends on our understanding of the interaction between multiple guidance cues (e.g., topographical and/or electrical). For studies involving the interactive effects of contact guidance and electrical field stimulation on cell elongation and orientation, we prepare microstructured surfaces on which cells are cultured between stimulating electrodes (Fig. 1). When polyvinyl surfaces are abraded using our protocol, the resulting pattern is V-shaped with a peak-to-peak width of 13 μm and average depth of 700 nm (Fig. 3), which is the ideal size for enhancing the elongation and orientation of neonatal rat cardiomyocytes. For an alternative method for patterning fibroblast cells using direct-current electrical stimulation, see Box 1.

As surfaces abraded with lapping paper of 80-mm grain size (average abrasion width of 13 mm and depth of 700 nm) exhibited the strongest effect on cardiomyocyte elongation and orientation as well as statistically significant effect on orientation of fibroblasts, they were used for electrical field stimulation experiments. (a) Scanning electron micrograph of a polyvinyl coverslip abraded with 80-mm-grain-size lapping paper. (b) Atomic force micrograph of a polyvinyl coverslip abraded with 80-mm-grain-size lapping paper. (c) Orientation of abrasions with respect to the electrodes in the stimulation chamber.
Initiation of electrical stimulation. The effects of electrical stimulation strongly depend on the time of its initiation8. If applied too early, electrical stimulation inhibits the accumulation of cardiac proteins and yields poor contractile behavior. If applied too late, electrical stimulation can no longer aid the functional assembly of the cells. For neonatal rat cardiomyocytes seeded with Matrigel into collagen scaffolds, the optimal time to begin electrical field stimulation is after 3 d of cultivation, and the contractile function can be assessed after 8 d (see ref. 8). For cells seeded onto the two-dimensional substrates, electrical stimulation should be initiated 24 h after cell seeding and maintained for an additional 72 h (for a total of 4 d culture time) before the effects of stimulation are assessed22.
Electrical signal parameters. The electrical signals described in this protocol are designed to mimic those existing in nature under the conditions of interest; living cells are surrounded by a fluid with high electrical conductivity—extracellular fluid in vivo (3–12 mS cm−1)29 or culture medium in vitro (15 mS cm−1)30. For vertebrates, the physiologically significant range of endogenous gradients of electrical fields is on the order of 0.1–10 V/cm (see ref. 26). In terms of frequency, the heart's beating rate can range from 3 to 4 beats per minute (for blue whales during deep dives), up to 360 beats per minute for a rat heart and 1,200 beats per minute for the hummingbird during flight31, corresponding to 0.05–20 Hz. In terms of pulse duration, 1–2 ms is sufficiently long to excite heart tissue and cells, and moreover, this signal duration is sufficient also for the double layers on stimulation electrodes to dissipate between subsequent pulses30 (for further information about the characterization of the electrical stimulation system outlined in this protocol, see Box 2). In addition, we have chosen monophasic square-wave pulses for their simplicity and compatibility with carbon rod electrodes. For discussion of customized electrical stimulation systems, see Box 3. For discussion of the tradeoffs associated with different waveform shapes, see Box 4.
Pulsatile electrical field stimulation, carbon electrodes. The main distinction between pulsatile and direct current stimuli is their mechanism of charge transduction. As electrical charges are carried by ions in physiological media and by electrons in electrodes and electrical circuitry, at the electrode–medium interface, there is a transduction of charge carriers from electrons to ions. Charge transfer can occur through three mechanisms: (i) non-Faradaic charging/discharging of the electrochemical double layer, (ii) reversible Faradaic reactions and (iii) nonreversible Faradaic reactions. The first two mechanisms are desirable, whereas the last should be avoided because it is associated with electrode degradation and harmful byproducts. The relative presence of each mechanism can be assessed using electrochemical impedance spectroscopy (EIS), from which an equivalent circuit of the stimulation system can be constructed (see Box 2).
When a stimulus is applied to a physiological medium, a redistribution of charge first occurs, and then, if the stimulus is of long-enough duration, the electrodes will begin to chemically react with the medium to sustain current. A system delivering short stimulation pulses can thus be designed to allow only a tolerable amount of chemical reactions to occur by selecting the electrode properties and pulse characteristics that favor reversible redistributions of charge in the double layer at the electrode–electrolyte interface and reversible chemical reactions32. We have found that a square-wave pulse with relatively short-duration (2 ms, or 0.2% of the total cycle) and a relatively long time between pulses, with the carbon electrodes used throughout this protocol, provides time for the vast majority (∼85%) of the processes occurring between electrodes and the electrolyte to reverse28. In addition, experimentally, we have also identified a safe stimulation range using carbon rod electrodes with neonatal rat cardiomyocytes, and at this point, we do not recommend stimulation at levels of 8 V/cm and above, although we may refine this range in the future28.
In past studies, we have determined carbon electrodes to be the electrodes of choice due to their passive biocompatibility, high availability, low price, superior charge injection characteristics and high resistance to chemical reactions and corrosion21,30. In addition, their behavior for a range of electrode configurations (including the ones described in this protocol and others for which the ratio of length of electrode to the spacing between them is greater than 2) resembles that of a parallel-plate capacitor, in which the field gradient is constant between the two conducting surfaces28 (for more details regarding characterization of electrodes, see Box 2).
A system delivering DC stimuli (such as that shown in Box 1 using Ag/AgCl electrodes which efficiently corrode, providing a steady current) is different than one delivering short pulses, as it necessarily generates chemical byproducts and therefore must be designed to shield the cells from chemical reactions by the use of salt bridges. As the incorporation of salt bridges necessarily adds another level of complexity, these systems are recommended only if the signal of interest generates intolerable amounts of chemical reactions. Electrical characterization of the culture system (Box 2) provides information about the mechanisms of charge injection for specific electrodes and input voltages.
The injection of charge from the electrode into electrolyte (culture medium in our case) can be accomplished by either attaching a current source between the two electrodes (that defines the current to be passed) or applying a voltage source. Although the second method is simpler to implement, it enables only the control of the net potential between the two electrodes, and not of the current, which, rather than voltage, dictates the amount of electrical field applied to the cells. Nonetheless, for pulsatile electrical field stimuli delivered by carbon electrodes, we have found that a voltage-controlled source is sufficient for accomplishing stimulation (for the DC stimulation applied in Box 1, however, a current-controlled device is utilized).


Ongoing work/future studies
Optimization of electrical stimulation parameters. At this point, although we have achieved a remarkable improvement of engineered cardiac tissue with the application of electrical stimulation, optimization of electrical stimulation parameters (including frequency, amplitude and waveform shape) remains an area of future work. To this end, we are developing high-throughput microscale cultures for screening studies involving electrical stimulation.
Assessments. Now that we have progressed to the point of optimizing culture conditions for improving the quality of engineered cardiac tissue, we have found it increasingly necessary to develop advanced assessments of the electromechanical functionality of engineered cardiac tissue. Thus far, for example, we have assessed cell elongation only on monolayer cultures, and so we are now developing methods using confocal microscopy for this purpose. Another shortcoming of our construct evaluation is that it is based on the changes in the construct cross-sectional area: as the construct contracts, its cross-sectional area decreases. However, our method neglects to consider that its thickness may also change. In addition, by using an electrical field stimulus to perform this assay, the effects of cell-to-cell coupling cannot be separated from the changes in amplitudes of contractions of individual cells. Furthermore, as the application of suprathreshold electrical stimulation causes contraction of cells, which in turn yields mechanical directionality cues, we would like to decouple these effects in future studies. For these reasons, we believe that, going forward, a stronger measurement of contractile function is that of its generated force, and we are in the process of developing these assays. In addition, quantifying impulse propagation will also be crucial for understanding the level of electrical coupling of the cells in the engineered cardiac tissue and determining the presence of any arrhythmia. Finally, in vivo assessments will be essential for determining the utility and functional integration of our engineered cardiac constructs, and we are in the process of performing these.
Materials
Reagents
Cell culture
-
Matrigel (Becton Dickinson, cat. no. 356234) (sterile)
Critical
Basement membrane matrix contains many undefined components and we have not tested matrices from other suppliers.
-
Bovine fibronectin (Sigma, cat. no. F1141) (sterile)
-
95% (vol/vol) ethanol (Pharmco, cat. no. 111000190)
-
Carboxyfluorescein diacetate, succinimidyl ester (CFDA; Molecular Probes, cat. no. C-1354) (nonsterile)
-
Propidium iodide (PI) (Invitrogen, cat. no. P1304MP) (nonsterile)
Caution
PI is a potential carcinogen. Material may cause irritation to the skin, eyes, mucous membranes, and the upper respiratory tract. When handling, wear chemical resistant gloves and chemical safety goggles, and handle only under a fume hood with adequate ventilation.
-
High-glucose DMEM, 4 g ml−1, with L-GIn, without sodium pyruvate (Invitrogen, cat. no. 11965)
-
Heat-inactivated fetal bovine serum (GIBCO, cat. no. 10082)
Critical
Heat inactivation is an important step to destroy complement proteins and also to prevent collagen scaffolds from degrading too fast.
-
N-2-hydroxyethylpiperazine-N′-2-ethane-sulfonic acid (CellGro, cat. no. 25-060-cl)
-
Penicillin (GIBCO, cat. no. 15140)
Histological analysis
-
10% (vol/vol) buffered formalin (Sigma, cat. no. 533998)
Caution
Formalin is toxic, allergenic and carcinogenic. Handle only under a chemical fume hood.
-
Horse serum (Vector Laboratories, cat. no. S-2000) (nonsterile)
-
Tween 20 (Sigma, cat. no. P7949) (nonsterile)
-
Mouse anti-cardiac troponin I (TnI; Millipore, cat. no. AB1627) (non-sterile)
-
Rabbit anti-connexin 43 (Cx43; Millipore, cat. no. AB1728) (nonsterile)
Critical
This antibody is specific for Cx43; not reactive with other connexins.
-
Texas-Red-conjugated horse anti-mouse IgG (Vector Laboratories, cat. no. TI-2000) (nonsterile)
-
Fluorescein-conjugated goat anti-rabbit IgG (Vector Laboratories, cat. no. TI-1000) (nonsterile)
-
4,6-Diamidino-2-phenylindole (DAPI) mounting medium (Vector Laboratories, cat. no. H-1200)
Ultrastructure analysis
-
Sodium cacodylate trihydrate (Sigma-Aldrich, cat. no. C4945)
Caution
Toxic, handle only under a chemical fume hood.
-
Reagent grade, crystalline paraformaldehyde (Sigma-Aldrich, cat. no. P6148)
Caution
Toxic, handle only under a chemical fume hood.
-
Gluteraldehyde, grade I, 8% (vol/vol) in H2O, specially purified for use as an electron microscopy fixative or other sophisticated use, pH = 7.4 (Sigma-Aldrich, cat. no. G7526)
Caution
Toxic, handle only under a chemical fume hood.
-
Epoxy embedding kit (Epon 812, SPI Supplies)
-
1% Osmium tetroxide, ReagentPlus, 99.8% (Sigma-Aldrich, cat. no. 201030)
Caution
Osmium tetroxide is highly toxic and a rapid oxidizer. Handle with care under a chemical fume hood.
-
(±)-Propylene oxide, ReagentPlus, 99% (Sigma-Aldrich, cat. no. 110205)
Equipment
-
Inverted or noninverted microscope (e.g., Olympus, cat. no. CK40)
-
Stereomicroscope (e.g., Olympus, cat. no. SZ2-LGR)
-
Oscilloscope (with option to save waveforms, e.g., Tektronix, cat. no. TDS3014B)
-
Electrical stimulator (providing a sufficient amount of current, e.g., Grass Technologies s88x dual output stimulator with 600 mA current rating)
-
Ultrasound cleaner (e.g., Misonix, cat. no. 1510R-MT)
-
Digital multimeter (with capability to test for short-circuits, e.g., Extech true RMS digital multimeter, RadioShack)
-
Video camera (with at least 30 frames per second, e.g., CFM-USB-4 from Angstrom Sun Technologies)
-
Class II biosafety cabinets
-
CO2 incubators (Napco, Thermoelectron)
-
Heated microscope stage (e.g., ThermoPlate MATS-U4020WF)
-
Leica Ultracut UCT
-
Computer that can run MATLAB Version 7.0 (i.e., with DVD drive, 512 MB RAM or higher, 600-MB disk space and Internet access)
Culture chamber
-
No. 80 size drill Bits (nonsterile)
-
GE RTV (room temperature vulcanization) 108 silicone adhesive (nonsterile)
-
Needlenose pliers (nonsterile)
-
Graphite electrodes (Ladd Research Industries, 1/8-inch diameter, cat. no. 30250) (nonsterile)
-
Platinum wire (Ladd Research Industries, 8 mil, cat. no. 30572) (nonsterile)
-
Color-coded alligator test leads (Radio Shack, cat. no. 278-1157) (nonsterile)
-
Electrical resistors (Mouser) (nonsterile)
-
60-mm glass Petri dish (e.g., VWR, cat. no. 89000-318) (nonsterile)
Cell culture
-
6-well polystyrene plates (sterile)
-
Collagen sponge scaffolds (Ultrafoam, Davol, cat. no. 1050050) (sterile)
-
Kim wipes (Fisher, cat. no. NC9777000) (sterilized by autoclaving)
-
Sterile gloves (Fisher, cat. no. 11-388-128G)
-
Alcohol wipes (Fisher, cat. no. 06-669-62)
Microabraded surfaces
-
80-μm aluminum oxide lapping paper (McMaster-Carr, cat. no. LPA80) (nonsterile)
-
Poly(vinyl) coverslips (VWR, cat. no.; 48376-049) (nonsterile)
-
Laboratory labeling tapes (VWR, cat. no. 36428-065) (nonsterile)
Reagent Setup
-
Cardiac culture medium (sterile), comprised of: high-glucose DMEM + 10% (vol/vol) heat-inactivated fetal bovine serum, 1% (vol/vol) N-2-hydroxyethylpiperazine-N′-2-ethane-sulfonic acid, 1% (vol/vol) penicillin. Can be stored at 4 °C for not longer than 3 weeks.
Caution
Prepare under a biological hood.
-
Karnovsky's reagent: 0.1 M sodium cacodylate with 2% (vol/vol) paraformaldehyde and 2.5% (vol/vol) gluteraldehyde, pH = 7.4. Can be stored at 4 °C for not longer than 2 weeks.
Caution
Prepare under a chemical hood.
Procedure
Culture chamber preparation
Timing ∼3 h
-
1
Cut two carbon electrode rods to appropriate lengths: for a 60-mm diameter dish, cut them to a length of 5.7 cm, for a 100-mm diameter dish, cut to a length of 9.7 cm. Cut two 7-cm pieces of platinum wire.
-
2
Place drill bit into the tip of the drill and drill two holes 2 mm apart from each other through each electrode, as close to the end of the electrode as possible, ∼2 mm from the end, as shown in Figure 1c. As we will cover this connection with silicone in Step 8, the closer the connections are to the edges of the electrode, the more space will be available between the electrodes for cell culture.
-
3
Thread the platinum wire through the hole closer to the middle of the electrode, allowing no wire to poke through the other end, as shown in Figure 1c. Wrap the platinum wire around the electrode, and thread through other hole. Pull tightly to create a good connection from the platinum wire to the electrode, but at the same time, be careful not to snap the electrode. The amount of wire hanging off the electrode should be enough to reach out of the bioreactor with just enough room for connectors you will be using to connect to it.
Critical Step
Free wire ends allow easy electrical connection between the electrical stimulator and the bioreactor, and they need to be easily attached and detached for medium changes, but because they are not insulated, the free wire ends should not be excessively long, just long enough to connect an alligator clip.
-
4
Squeeze two strips that are 1.1 cm long of RTV silicone adhesive to the bottom of the Petri dish, at opposing ends, as shown in Figure 1b.
-
5
Press the electrodes into the adhesive at the bottom surface of the dish. Be careful to avoid getting any adhesive on the sections of the electrodes that will face the cells (as shown in Fig. 1c) because silicone is an insulating material that will block the delivery of the electrical field stimulus. For use with monolayer inserts (which will be 8 mm × 10 mm), space the electrodes so that there is 1 cm from the edge of one rod to the other (for purposes of calculating electrical field with this configuration, divide input voltage by 1.1 cm)28. For use with 3D constructs (which will be 6 mm × 8 mm), space the electrodes so that there is 1 cm spacing from the center of one rod to the center of the other (for purposes of calculating electrical field with this configuration, divide input voltage by 1.0 cm)28. It is also important to make sure that the attached wires should be on opposite sides of the opposing electrodes as shown in Figure 1b,c. This placement of wires balances the effect of electrode resistance and ensures that a uniform amount of electrode resistance will be encountered for any given current path through the system. Allow silicone to set for 20 min in a 60 °C oven.
Critical Step
It may help to place the Petri dish on top of a piece of graph paper with 1-cm spacing to aid in proper electrode placement.
-
6
Wipe off the probes of a digital multimeter with an alcohol pad and allow to dry. Using the 'short circuit' option, check that there is a short circuit between the tip of the wire furthest from the Petri dish and electrode, which means you have made a good electrical connection. Also check by caliper that the electrode spacing has not changed while the silicone was setting. If it has, use a scalpel to scrape all silicone from the bottom of the dish and start over with new electrodes.
Critical Step
If electrodes are improperly aligned, the electrical field gradient will be greater where electrodes are closer together, and lesser where they are further apart.
-
7
Now that the electrodes are securely fastened to the bottom of the dish, prebend the platinum wire so that it comes out of the Petri dish neatly—this will also facilitate placing the Petri dish lid over the chamber. Also keep in mind that bending the delicate platinum wire too much may cause it to snap.
-
8
Squeeze another strip of silicone adhesive over the exposed platinum wire twisting around the electrode, as shown in Figure 1d.
-
9
Repeat this procedure to prepare the desired number of culture chambers (you will be able to accommodate four 3D scaffolds or three monolayer inserts in a 60-mm chamber, and six scaffolds or four monolayer inserts in a 100-mm chamber). If you are planning to perform assessments of contractile activity (Step 21A), make an extra chamber to allow testing of individual constructs in Step 21A(ii). Autoclave culture chambers in sealed autoclave bags for 20 min on dry cycle (the silicone adhesive will set in the autoclave).
Pause point
The culture chambers may be stored in their autoclave bags for up to 3 months in a dry place at room temperature (RT; 18−25 °C).
Preparing cells for culture
Timing 12–18 h
-
10
Prepare cells for culture (using our previously published cell-isolation protocol)27 and seed them either in a monolayer (unpatterned or patterned; using option A) or a 3D scaffold (option B).
-
A
Preparing cells on monolayer surface
-
i
(Skip this step for unpatterned surface.) Cover one-half of your polyvinyl carbonate coverslips (22 mm × 22 mm) with laboratory tape and use lapping paper to abrade one-half of the coverslip in one direction (∼30 strokes should provide good abrasions). Peel off the tape, cover the part of the coverslip just abraded and abrade the other half of the coverslip in the orthogonal direction to observe the cells' response to two different topographical cues on the same coverslip. Observe under the microscope that the abrasions are straight (i.e., that all are running in the same direction in a particular area and not crisscrossing due to accidental scratches).
-
ii
Cut the abraded coverslips into 8 mm × 22 mm rectangles. Be careful that you cut the strips so that both directions of abrasions are included in the strip, and not that you are cutting a strip entirely out of a piece of the coverslip abraded in only a single direction.
-
iii
Wearing tight-fitting gloves (for better control) fold along the two shorter edges by hand to form a 'table' with a surface of 8 mm × 10 mm and cut the 'legs' to a height of 1.5 mm (to ensure that the cells cultured on the coverslips are placed at the identical height in the center between the carbon electrodes used for electrical stimulation).
-
iv
Remove particulate debris by sonicating the surfaces in soap and water followed by rinsing in distilled water.
-
v
Sterilize the surfaces in 95% (vol/vol) ethanol for 24 h, followed by drying and UV irradiation for 30 min at RT (25 °C).
-
vi
For cardiomyocyte culture, coat the surfaces at RT for 2 h with 25 μg ml−1 of bovine fibronectin in phosphate buffered saline (PBS) to enhance cell attachment (60 μl of solution per coverslip).
-
vii
Pipette off the excess fibronectin.
-
viii
Resuspend cells at the desired cell density such that there are 500,000 cardiomyocyte cells per 60 μl. Then pipette 60 μl of this suspension onto each coverslip and incubate them in a 100-mm Petri dish at 37 °C/5% CO2 for 1 h. After 1 h, fill the chamber with 20 ml of culture media.
Timing ∼30 h including sterilization
-
i
-
B
Preparing cells in 3D scaffold
-
i
Under a laminar flow hood, wearing sterile gloves, cut the collagen scaffold into rectangles 6 mm × 8 mm × 1.5 mm.
-
ii
Immediately before use, hydrate each collagen scaffold in culture medium for 2 h in a 37 °C/5% CO2 incubator.
-
iii
Collect cells by centrifugation at 200g for 10 min at 4 °C and resuspend in liquid Matrigel using 5 μl Matrigel per 1 million cells, while working on ice to prevent premature gelation.
-
iv
Gently blot dry prewetted collagen scaffolds on a sterile Kimwipe (autoclaved previously), and then pipette cell suspension in Matrigel evenly on the top surface of each scaffold. Inoculate each scaffold with 30 μl of the freshly isolated heart cells–Matrigel suspension (density of 1.35 × 10⁸ cells cm−3). Place each inoculated scaffold into a single well of a 6-well plate and place in a 37 °C, 5% CO2 incubator.
-
v
Gelation is complete within 15 min in a 37 °C incubator. Add 4 ml of warmed culture medium to each well of the 6-well plate and keep in culture until ready for use.
Timing ∼3.5 h
-
i
-
A
Assemble culture chamber
Timing 30 min
-
11
Culture chamber should be assembled according to option A for monolayer culture or option B for 3D construct culture.
-
A
Culture chamber assembly for monolayer culture
-
i
With sterile forceps, place coverslips (prepared in Step 10A) between the electrodes in the chamber (prepared in Steps 1–9) (see Fig. 1g) with the table legs orthogonal to the electrodes (the way the 'tables' were made should ensure that when they are placed in between the electrodes, half of any abrasions will be parallel and half will be orthogonal to the electrical field). Figure 3c is an example with two coverslips. Four 'tables' may fit in a 100-mm diameter dish, and three in a 60-mm dish.
-
i
-
B
Culture chamber assembly for 3D construct culture
-
i
With sterile forceps, place scaffolds (prepared in Step 10B) between electrodes in culture chamber (prepared in Steps 1–9) (see Fig. 1f). Place four scaffolds in the chamber—six should fit in a 100-mm diameter dish, and four in a 60-mm dish.
-
i
-
A
-
12
Add 15 ml of cardiac medium to 60-mm Petri dish or 25 ml to a 100-mm dish, making sure there is enough culture medium to cover the electrodes to ensure proper current flow. Cover and place chamber onto the lid of a 150-mm diameter plastic Petri dish to facilitate carrying, and to provide an insulating layer between the dish and the metal incubator shelves. Place in incubator (37 °C, 5% CO2) and culture for 24 h before applying electrical stimulation to monolayer culture inserts, or for 3 d in the case of 3D constructs.
Critical Step
Do all this while paying particular attention to preventing constructs from floating out from between the electrodes.
Apply electrical stimulation
Timing 30 min
-
13
Connect a red alligator test lead to one platinum wire (this will be connected to the 'positive' wire from the electrical stimulator) and a black alligator test lead to the other platinum wire of your culture chamber (this will be connected to the 'negative' wire from the electrical stimulator). Keep track of which electrode is your 'positive' electrode and which is your 'negative' by labeling the culture chamber. Gently pull the ends of the test leads outside the incubator and secure them with tape so that they do not move when the incubator door is opened and closed. Close the incubator door, and connect the positive output of the stimulator to the red alligator test lead and the negative output of the stimulator to the black alligator test lead.
Critical Step
Make sure the stimulator is turned off when performing this step. Take care to prevent any undesired electrical connections (such as accidentally touching wires to metal incubator trays, or allowing platinum wires from adjoining bioreactors to come into contact). If you connect more than one bioreactor to a single channel, make sure not to surpass the current limit of your electrical stimulator. Use the following calculation to see how many bioreactors your system allows in parallel: Imax = X × Vstim/Rs, where Imax corresponds to the current limit of the electrical stimulator, X is the number of bioreactors you intend to connect in parallel, Vstim is the amplitude of the applied voltage and Rs is the resistance of the bulk solution in your bioreactor (for electrodes spaced at a 1-cm distance, with a length of 5.7 cm (out of which 4 cm is exposed to the culture medium), we have measured Rs = ∼20 ohms; for electrodes spaced at a 1-cm distance, with a length of 9.7 cm (out of which 8 cm is exposed to the culture medium), we have measured Rs = ∼10 ohms)28.
-
14
Apply monophasic pulses by following option A for monolayer cultures and option B for 3D scaffolds.
-
A
Application of monophasic pulses to monolayer cultures
-
i
For cells seeded onto monolayer surfaces (either abraded or unabraded), start electrical stimulation 24 h after seeding monolayer cultures.
-
ii
Stimulate with 1-ms duration square pulses delivered at 1 Hz and amplitude of 5 V.
-
iii
Keep cells in culture in a 37 °C, 5% CO2 incubator, and replace the culture medium 100% every other day. Stop electrical stimulation 4 d after seeding (3 d of electrical stimulation).
Timing 3 d
-
i
-
B
Application of monophasic pulses to 3D scaffolds
-
i
Start electrical stimulation 3 d after seeding scaffolds.
-
ii
For scaffolds of cardiomyocytes seeded with Matrigel, stimulate with 2-ms duration square pulses delivered at 1 Hz and amplitude of 5 V.
-
iii
Keep 3D constructs in culture in a 37 °C, 5% CO2 incubator, and replace the culture medium 100% every other day. Stop electrical stimulation 8 d after seeding scaffolds (5 d of electrical stimulation).
Timing 5 d
-
i
-
A
Check electrical stimulation in culture chamber
Timing 30 min
-
15
To allow measurement of the current in the culture chamber during electrical stimulation (Step 14), construct a circuit by placing a 10-ohm resistor (Rm) in series with the bioreactor in the stimulation loop as shown in Figure 4a.
Figure 4: Checking electrical stimulation. 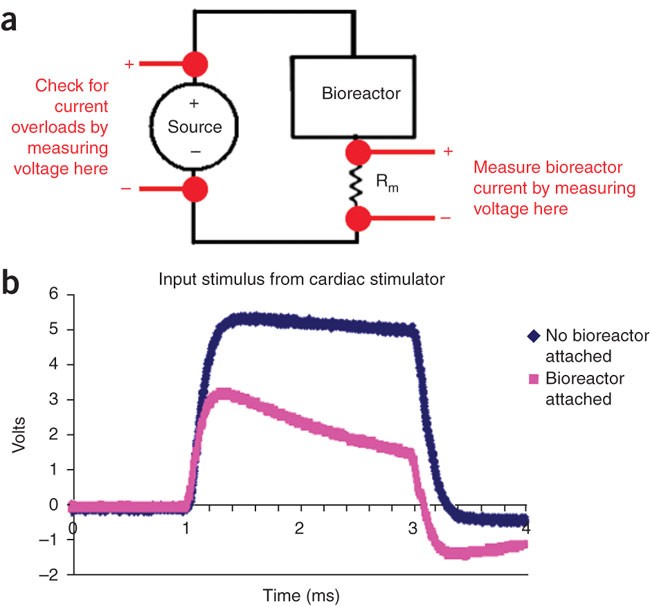
(a) An equivalent circuit of setup for checking electrical stimulation. To check the current, connect a measurement resistor Rm in series with the bioreactor, measure the voltage across it and back-calculate the current (assumed to be the same as that through the bioreactor, given Kirchoff's current law) using Ohm's Law (V = IR), where V is the voltage, I is the current and R is the resistance of a voltage loop. To check that the current limit of the stimulation device is not surpassed by attaching the bioreactors to it, measure voltage of the source before and after the bioreactors are attached and compare waveforms. (b) Stimulus waveform from commercial stimulator with low current rating. When a bioreactor is attached (pink), the stimulus waveform (blue) is no longer faithfully applied. Either too many bioreactors are hooked up in parallel to this channel, or the current rating of your stimulation device is too low. In this case, a custom stimulator may need to be built (see Box 3).
Critical Step
The value of this resistor should be large enough to be able to read a potential drop across it during a stimulus, but as small as possible. For the bioreactor outlined in Steps 1–9, we choose a 10-ohm resistor.
-
16
The amount of current flowing through the bioreactor is calculated simply by measuring the potential drop across the resistor, and recording over time the voltage across the resistor with the oscilloscope. For each desired time point measured on the oscilloscope, calculate the value of current by dividing the measured voltage across the resistor by the resistance value Rm (Ohm's law I = V/R where V is the voltage measured with the oscilloscope, I is the current and R is the resistance).
-
17
With an oscilloscope, measure the voltage of the source before and after bioreactors are attached (Fig. 4a). Compare the waveforms, and check that the intended waveform is faithfully applied to the bioreactor (an example of this is shown in Fig. 4b). If not, the current limit of stimulator may be exceeded and may need to be increased (see Box 3 for building custom-stimulation devices).
-
18
(Optional) If you are interested, calculate the total amount of injected charge by integrating the current profile for the duration of the stimulus with computational software (e.g., EXCEL, MATLAB or SigmaPlot software). We have done this for a variety of electrode types, including carbon, titanium, stainless steel and titanium nitride-coated titanium, and determined carbon to be the material with the highest amount of injected charge30.
-
19
(Optional) If you are interested in assessing the amount of charge that is irreversibly delivered in your system, integrate the current profile with computational software (e.g., EXCEL, MATLAB or SigmaPlot). Include not only the stimulus, but continue for several ms further until a current of 0 is reached (i.e., during the reversal of all reversible chemical processes).
-
20
Monitor the currents every day during culture and note any significant changes, which may be a sign of corrosion of electrodes/detached wire and so on.

Assessments of the engineered cardiac tissue
-
21
Assessments of the engineered cardiac tissue can be carried out using the following options: option A for assessment of the contractile activity of engineered cardiac constructs; option B for end-point assessment of cell alignment and elongation of cell monolayers; option C for end-point histological analysis (including analysis of gap junctions); and option D for end-point ultrastructural analysis.
-
A
Assessment of the contractile activity of engineered cardiac constructs
-
i
Assess contractile activity of live engineered cardiac constructs visually by measuring contractile activity in response to electrical field stimulation. If this is an end-point analysis, there is no longer a need to maintain sterility, but otherwise, this procedure should be performed under a biological hood. In addition, we recommend the use of a microscope-incubator system, if available, to guarantee proper temperature and pH.
Critical Step
If a microscope-top incubator is not available, prepare a solution of Tyrode's salts (Sigma) according to the manufacturer's instructions and warm to 37 °C (Tyrode's solution provides some pH buffering and should be replaced for each new construct measured).
-
ii
Connect a new 60-mm diameter culture chamber prepared in Steps 1–9 to a cardiac stimulator (either Grass S88X or custom system) and fill with 15 ml of warmed Tyrode's solution. We use a new culture chamber here because we measure each construct individually, and all other constructs may remain in the incubator while we are performing measurements.
-
iii
Maintain the temperature of the Tyrode's solution at 37 °C by placing the Petri dish on top of a heated stage.
Critical Step
Cardiomyocytes are very sensitive to temperature variations, so it is critical to maintain temperature or else all measurements will be compromised.
-
iv
Place the entire setup on an optical microscope, and monitor contractile responses to electrical stimuli (rectangular pulses, 2-ms duration for 3D constructs) using appropriate magnification. If construct is too large to observe on a standard microscope, use a stereomicroscope instead.
-
v
To assess electrical excitability, increase signal amplitude in 0.1 V increments up to 10 V, and the stimulation frequency up to 400 beats per minute.
-
vi
For each combination of voltage and frequency, look for the presence of random, spontaneous contractions (an indicator of immature tissue) versus synchronous contractions in response to electrical pacing (an indicator of more mature tissue containing electromechanically coupled cells).
-
vii
Measure excitation threshold (ET; the minimum voltage of electrical stimulation required to elicit sustained synchronous contractions of the whole tissue construct at a frequency of 60 beats per minute).
-
viii
Measure the maximum capture rate (MCR; maximum frequency of sustained synchronous contractions that can be achieved at a stimulation voltage corresponding to 1.5 ET).
-
ix
To assess the magnitude of contractions of engineered cardiac constructs visually, measure fractional area change of tissue in response to electrical field stimulation. Set up video camera and microscope magnification to allow construct to occupy as much of the captured frame as possible. If this is not possible because of the size of the construct, use a stereomicroscope instead. Adjust lighting for maximum contrast of scaffold versus background by placing a black object under the scaffold, and eliminating any reflective objects from view.
-
x
Record video of scaffold being paced at a frequency of 1 Hz and a stimulus of 1.5 × ET for 3 s (with at least 30 frames per second), and save in AVI (audio video interleave) format.
-
xi
Perform video analysis (can be performed at a later time on saved movie files) by opening video using the custom MATLAB software (available in Supplementary Data 1 online; also see Supplementary Manual 1 online; screen capture shown in Fig. 5a). Our custom MATLAB software first opens each frame from the loaded movie file, converts the images to grayscale and then to binary with a threshold value that is set by the user, and depends on lighting conditions of movie recording. Finally, the area of the largest object in each image (which should correspond to that of the scaffold) is stored in a format that can be pasted into spreadsheet software (such as EXCEL).
Figure 5: Methods for quantitative image analysis for Steps 21A, B and C. 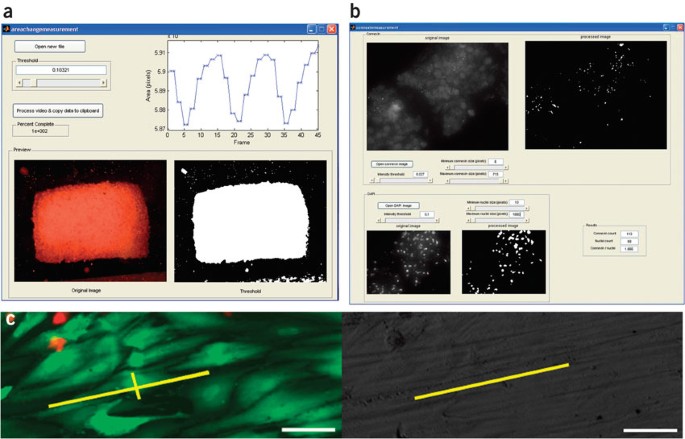
(a) Assessing magnitude of contractions for engineered cardiac tissue (Step 21A). A slider allows the user to select the image threshold and to see the calculated magnitude of the contractions on the screen or to export the data to spreadsheet software. (b) Connexin-43 analysis (Step 21C). A slider allows the user to select the image threshold and see the outlines of the identified gap junctions and cell nuclei. (c) Live-dead staining (left) and bright-field image (right) of the same field for assessment of cell elongation and alignment (Step 21B). Annotations (in yellow) correspond to a cell's long and short axes (in the live-dead image) and the corresponding surface's direction of abrasions (in the bright-field image). Scale bars correspond to 50 μm.
-
xii
Drag the slider to set the appropriate image threshold and press 'Process video' button. As the video is processed, a figure in the top right-hand corner of the screen displays a trace of the calculated area.
-
xiii
When calculations are finished, paste data into spreadsheet software, select the maximum and minimum size of tissue during each contraction and perform the following calculation for fractional change of area: (relaxed size − contracted size)/(relaxed size).
Timing 1 h setup/cleanup + 10 min per construct
-
i
-
B
End-point analytics—cell alignment and elongation (for monolayer cultures only)
-
i
Perform live/dead stain on monolayer of cells from Step 20 and take both fluorescent and bright field images of the same area; for live/dead staining, incubate the cells in 0.7 ml (for one well of a 6-well dish, two coverslips or tables per well) of solution of carboxyfluorescein diacetate (10 μM) and PI (75 μg ml−1) in PBS for 60 min, followed by rinsing in PBS (two times) and imaging. Other fluorescent live/dead kits can also be used for this purpose.
-
ii
Open pair of images in ImageJ software (available at http://rsb.info.nih.gov/ij/).
Caution
The steps below rely on user input.
-
iii
Enlarge the images until the cell outlines (bright green) are clearly visible. Draw lines corresponding to the cell's long and short axes in the fluorescent image (Fig. 5c).
-
iv
For cells cultured on abraded surfaces, draw a line on the bright-field image corresponding to the direction of abrasions and measure the angle between the abrasion and the cell's long axis.
-
v
For cells cultured on nonabraded surfaces, you can measure the angle between the cell's long axis and either the axis that was orthogonal or parallel to the electrical field. In our past studies, for example, we have compared the angle of the long axis of fibroblasts to the orthogonal direction, and the angle for cardiomyocytes to the parallel direction. These directions were selected on the basis of the previous studies that have demonstrated that fibroblasts align orthogonal33, whereas cardiomyocytes align parallel to the electrical field lines8 (see Box 1 for a technique for aligning fibroblasts orthogonal to the electrical field within just 3 h).
-
vi
Determine elongation by measuring the long and short axes of the cell and calculating the aspect ratio (long-to-short axis ratio). Exclude from analysis any cells of which the perimeters cannot be precisely determined (this number should not be more than 10%). We measure a total of 60–90 cells per group from at least N = 3 independent experiments (e.g., 20–30 cells per sample).
Timing 90 min setup per staining + 2 h per sample
-
i
-
C
End-point analytics—histological analysis (including analysis of gap junctions)
-
i
Fix monolayers or 3D constructs from Step 20, 21A or 21B (monolayers, in 2% (vol/vol) formaline, 1 h; 3D constructs, in 10% formaline, 24 h).
-
ii
(3D constructs) Embed and section in paraffin blocks.
Caution
The processing, embedding and sectioning of paraffin blocks requires specialized equipment and expertise and is usually performed by a histology or pathology laboratory. Although hand processing can be performed by following several available protocols (e.g., http://www.ihcworld.com/_protocols/histology/ paraffin_section.htm, http://www.bdbiosciences.com/pharmingen/protocols/ Paraffin_Sections.shtml) the results may show marked variation in histology quality and antigenicity.
Pause point
Sectioned slides may be stored at RT (18–24 °C) or at 4 °C indefinitely until required.
-
iii
(3D constructs) Deparafinize sections to retrieve antigen by heat treatment for 20 min at 95 °C in a decloaking chamber (Biocare Medical).
-
iv
Block sections with ∼200 μl (or enough to cover cells) of 10% horse serum diluted in PBS for 30 min at RT (18–24 °C) in a dark, humidified chamber.
Critical Step
For Steps C(iv–xi), neonatal rat heart and bovine tendon can serve as positive and negative controls, respectively.
-
v
Incubate three times in 200 μl of PBS for 5 min at RT (18–24 °C) in a dark, humidified chamber.
-
vi
Incubate the sections for 1 h at 37 °C with 200 μl of either TnI or Cx-43 (1:150 dilution for each antibody in PBS containing 0.5% (vol/vol) Tween 20 and 1.5% (vol/vol) horse serum).
-
vii
Incubate three times in 200 μl of PBS for 5 min at 37 °C.
-
viii
For TnI, incubate sections at RT for 30 min with 200 μl of the secondary antibody solution (horse anti-mouse IgG 1:200 dilution in PBS containing 0.5% (vol/vol) Tween 20 and 1.5% (vol/vol) horse serum); for Cx-43, use fluorescein-conjugated goat anti-rabbit IgG (1:200 dilution in PBS containing 0.5% (vol/vol) Tween 20 and 1.5% (vol/vol) horse serum).
-
ix
Incubate three times in 200 μl of PBS for 5 min at 37 °C.
-
x
Apply one drop of DAPI mounting solution on top of the sample and cover with a coverslip.
-
xi
Assess construct architecture and cell distribution from the stained sections using fluorescent microscope (Axioplan, Zeiss). In particular, look at the positions of the cells relative to the scaffold pores, the depth of the cells relative to the edge of the scaffold and the orientation of the long axis of the cells.
-
xii
To perform gap junctional analysis (for samples stained for Cx-43), open the custom MATLAB software (available in Supplementary Data 2 online; also see Supplementary Manual 2 online; screen capture shown in Fig. 5b).
Critical Step
The algorithm for our custom MATLAB software first reads in an image file for Cx-43 staining (that the user inputs), estimates the background illumination, subtracts the background image from the original image, converts the corresponding image to gray scale intensity image and then converts the image to binary with a threshold value that is to be set by the user depending on lighting conditions. Finally, the number of objects in this processed binary image (excluding those objects outside the user-defined size-thresholds) are labeled and counted.
Critical Step
For Steps C(xii–xvii), images will need to be collected through fluorescein isothiocyanate and DAPI filters separately.
-
xiii
Press 'Open Connexin Image' button (and select image of cells stained for fluorescently labeled Cx-43) and the image will appear in the top left-hand corner of the screen.
-
xiv
Drag the sliders to adjust the appropriate image threshold, minimum and maximum size (in pixels) of gap junctions to count, respectively. The resulting processed image will appear in the top right-hand corner of the screen.
-
xv
Repeat Steps C(xiii–xiv) for the corresponding DAPI image (and resulting image will appear in the bottom half of the screen).
-
xvi
Note the results for (i) the total number of gap junctions counted, (ii) total number of nuclei counted and (iii) the ratio of gap junctions/nuclei, which will all appear in a box in the bottom right-hand corner of the screen.
-
xvii
Repeat Steps 21 C(xiii–xvi) for all desired images to be analyzed.
Timing 1–3+ d
-
i
-
D
End-point analytics—ultrastructure analysis
-
i
Prepare either 3D constructs or monolayer samples from Step 20 for transmission electron microscopy (TEM), which allows observation of gap junction and z-band formation. Details of fixation, embedding and sectioning are described elsewhere34. In short, cells are fixed in Karnovsky's reagent (a mixture of sodium cacodylate, paraformaldehyde and gluteraldehyde), post-fixed in osmium tetroxide in veronal-acetate buffer, dehydrated in graded ethanol in propylene oxide, embedded in Epon 812 (Polysciences), cut into thin sections (70 nm) using a diamond knife and stained with lead citrate and uranyl acetate.
Caution
Because the processing of samples for TEM requires many flammable and toxic materials, you may prefer to have your samples prepared by a biological TEM laboratory for processing.
-
ii
Examine sections for ultrastructural properties relevant to cardiac tissue (volume fraction and developmental stage of sarcomeres, Z and M lines, H, I and A bands, gap junctions, T tubules) using a Philips EM410 transmission electron microscope operated at 80 kV (JEOL-100CX, JEOL).
-
iii
Perform morphometric analysis on 20–46 randomly taken transmission electron micrographs at a magnification of × 100,000. A test grid with uniform squares (0.26 cm × 0.26 cm) is superimposed onto the micrographs and the areas covered by sarcomeres, mithochondria, nuclei and the overall area of the cells are determined. The volume fraction of each organelle is determined as described previously8. The frequency of intercalated disks and gap junctions (number per mm2) is determined by counting. A total of 20 micrographs of nonstimulated constructs, 46 micrographs of stimulated constructs and 42 micrographs of neonatal ventricles were evaluated with respect to each structural parameter by two independent observers.
Timing 2+ d
-
i
-
A

Troubleshooting
Troubleshooting advice can be found in Table 1.
Timing
Steps 1–8: preparation of electrical stimulation chamber (30 min per chamber)
Step 9: sterilization of electrical stimulation chamber (40 min, 24 h before the experiment)
Step 10: cell preparation (12–18 h); option A (monolayers): prepare (microabraded or smooth) surface (27 h), cell seeding onto (microabraded or smooth) surface (3 h); option B (3D constructs): preparation of ultrafoam collagen scaffolds (3 h), scaffold seeding using Matrigel (30 min per 6 scaffolds)
Steps 11 and 12: assembling culture chamber (30 min)
Steps 13–20: applying and checking electrical stimulation (1 h)
Steps 14A and 14B: tissue culture (3–8 d)
Step 21: assessments—option A: contractile activity (3D constructs: 1 h + 10 min per scaffold); option B: cell alignment/elongation (monolayers: 1.5 h + 2 h per sample); option C: histology (1–3+ d); option D: ultrastructure (2+ d)
Anticipated results
We have found in our previous studies that electrical stimulation utilized during cultivation of cardiac cell populations and 3D engineered tissues has been critical for the maintenance of differentiated cell phenotype and cell assembly into synchronously contractile cardiac tissues. We summarize here the effects of electrical stimulation for two representative situations: electrical stimulation of (i) cardiac cells cultured in monolayer (on both abraded and unabraded polyvinyl substrates) and (ii) 3D engineered cardiac tissue constructs.
Effects of electrical field stimulation and substrate topography on monolayer-cultured fibroblasts and cardiomyocytes
When we abrade the polyvinyl surfaces as described in this protocol, we see peak-to-peak distances of 13 μm between grooves and a depth of 700 nm (Fig. 3). When we cultured cardiac myocytes in monolayer on these surfaces, after the application of electrical field stimulation (Steps 13 and 14) of amplitudes of 2.3 or 4.6 V/cm, either parallel or orthogonal to the direction of abrasions (with nonabraded surfaces used as controls), we observed that cells (in all cases) elongated and aligned with their axis parallel to the surface abrasions (Fig. 6). This abrasion type gave us the highest degree of alignment and elongation, consistent with previously reported studies that utilized grooves of precisely defined dimensions35,36,37 as well as the rough surfaces38. As the abrasions were oriented either (i) parallel to the electrical field (i.e., orthogonal to the electrodes) or (ii) orthogonal to the electrical field (i.e., parallel to the electrodes), the two cues (topography and electrical field) acted on the cells either in a parallel or in an orthogonal direction (Fig. 3c). In the first case, the electrical field and topography were acting on the cell alignment in the same direction. In the second case, the field was acting on the cell in the orthogonal direction to the abrasions. On unabraded monolayer surfaces, pulsatile electrical field significantly enhanced elongation of cardiomyocytes (Fig. 6a) to reach the levels comparable with that achieved by surface abrasion.

The surfaces were obtained using lapping paper with a grain size of 80 μm. Electrical field stimulation using square pulses 1-ms duration, 1 Hz and 2.3 or 4.6 V/cm was initiated 24 h after cell seeding and maintained for additional 72 h. (a) Cell elongation as defined by the aspect ratio and (b) cell orientation as measured by the angle between the abrasion and the long axis of the cell. In a and b: light gray bars: abrasions oriented orthogonal to the electrical field; dark gray bars: abrasions oriented parallel to the electrical field; and white bars: nonabraded surfaces. Data are represented as averages ± s.d. Total N = 2–3 independent samples (coverslips) per group; 30–90 cells were analyzed per group (P < 0.05 was considered significant). *Significantly different than nonabraded surface at identical stimulation voltage. (c) Actin cytoskeleton as visualized by phalloidin-TRITC staining (scale bar is 10 μm, electrical field lines are from left to right). Yellow lines indicate the directionality of the surface abrasions.
The fact that field stimulation failed to promote elongation at higher levels than that obtained by topographical cues prompted us to hypothesize that the pathway for elongation is saturated by topographical cues, and that the same signaling pathways could be involved in the cellular response (i.e., elongation) to topographical cues and electrical field stimulation. In addition, pulsatile electrical field stimulation significantly enhanced orientation of cardiomyocytes (Fig. 6b) when they were cultivated on abrasions placed orthogonal to the field lines. Yet, within every voltage group, the nonabraded surfaces had approximately two times higher average orientation angle than the abraded surfaces (Fig. 6b), indicating that topographical cues are overall a stronger regulator of cellular orientation than field stimulation.
Phalloidin–TRITC staining indicated that actin filaments generally followed the direction of surface abrasions22. For cells cultivated on nonabraded surfaces, actin cytoskeleton was disorganized. Higher magnification images (Fig. 6c) revealed remarkable differences in orientation of actin filaments as a function of surface abrasion and electrical field stimulation. On abraded surfaces, actin filaments were clearly aligned in the direction of surface abrasions (either orthogonal or parallel to the field lines). For cardiomyocytes cultivated on nonabraded surfaces at 0.0 and 2.3 V/cm (Fig. 6c), the actin cytoskeleton was not aligned in any particular direction, and the overlapping filaments were extending in multiple directions. Yet, at 4.6 V/cm on nonabraded surfaces (Fig. 6c), there was an appreciable improvement in the organization of the actin filaments, which aligned in parallel along the long axis of the cell.
As we saw similar results with 3T3 fibroblasts and, furthermore, observed the abolishment of the orientation and elongation response of cardiomyocytes to the abraded surfaces and electrical field stimulation by inhibition of actin polymerization (and only partially by inhibition of PI3K pathway), we conclude that the surface topography more strongly determined the orientation of both fibroblasts and cardiomyocytes than pulsatile electrical field22. These findings have implications for the design of scaffolds for cardiac tissue engineering. A feasible strategy would be to design scaffolds of desired microarchitecture (e.g., by electrospinning) to drive cellular elongation and orientation in the desired direction, followed by the application of electrical field stimulation for enhancement of these properties.
Electrical stimulation of engineered cardiac tissue
In native heart, electrical signals generated by pacing cells spread throughout the heart and cause the depolarization of cellular membranes and activation of the contractile apparatus in cardiac myocytes39. The application of electrical stimulation to cardiac constructs markedly enhanced the contractile behavior. After 8 d of culture, the amplitude of contractions was sevenfold higher in stimulated than in nonstimulated constructs (Fig. 7a), a result of the progressive increase with the duration of culture.

(a) Contraction amplitude (the fractional change in area of tissue during a contraction) increases with electrical stimulation. (b) Excitation threshold (electrical field voltage gradient that needs to be applied to induce synchronous contractions of cultured tissue constructs) and maximum capture rate (the maximum frequency at which tissue constructs can be induced to beat) significantly decreased and increased, respectively, with the application of electrical stimulation and with time in culture. (c) Ultrastructural organization. Representative transmission electron micrographs of stimulated and nonstimulated constructs after 8 d of cultivation, compared with neonatal rat ventricles are shown (top: structure of a sarcomere; bottom: intercalated disk). Electrical stimulation induced the development of long, well-aligned registers of sarcomeres, and in stimulated constructs, intercalated disks were positioned between aligned Z lines and were as frequent as in neonatal ventricles. (d) β-Myosin heavy chain staining. Stimulated constructs and neonatal ventricles contained higher levels compared with unstimulated constructs.
Although the ET (the minimum voltage at which the entire construct was observed to beat) for stimulated constructs was not significantly smaller than the one for nonstimulated constructs at 8 d of culture, the MCR (the maximum rate the entire construct could be paced) was significantly higher in the stimulated group compared with the nonstimulated group at 8 d of culture (Fig. 7b). The shape, amplitude (∼100 mV) and duration (∼200 ms) of the electrical activity recorded for cells in constructs stimulated during culture were similar to action potentials reported for constructs that were mechanically stimulated during culture7.
Engineered constructs that were electrically stimulated during culture demonstrate a remarkable level of ultrastructural differentiation, comparable in several respects with that of native myocardium (Fig. 7c). Myofibers align orthogonal to the direction of the electrodes, within the top ∼200 μm of the construct thickness. The collagen sponge scaffold consists of isotropic interconnected pores 190 μm in diameter40, but as the sponge is biodegradable, the seeded cells can remodel the matrix during the alignment process, possibly in an attempt to decrease the apparent ET in response to pacing41. In contrast, cells in nonstimulated constructs stayed round and expressed relatively low levels of cardiac markers. Electrical stimulation also increased the amounts of mitochondria and glycogen, and induced the formation of well-aligned registers of sarcomeres that closely resembled those in native myocardium (Fig. 7c), representing a hallmark of maturing cardiomyocytes39. The volume fraction of sarcomeres in stimulated 8-d constructs was indistinguishable from that measured for neonatal ventricles42, in contrast to nonstimulated constructs with only scarce and poorly organized sarcomeres. Stimulated constructs also had well-developed intercalated disks and gap junctions. Electrical stimulation also elevated the levels of β-MHC (Fig. 7d), Cx-43, creatine kinase-MM and cardiac Tn-I8.
Note: Supplementary information is available via the HTML version of this article.
References
Mitcheson, J.S., Hancox, J.C. & Levi, A.J. Cultured adult cardiac myocytes: future applications, culture methods, morphological and electrophysiological properties. Cardiovasc. Res. 39, 280–300 (1998).
Carrier, R. et al. Perfusion improves tissue architecture of engineered cardiac muscle. Tissue Eng. 8, 175–188 (2002).
Ellingsen, O. et al. Adult rat ventricular myocytes cultured in defined medium: phenotype and electromechanical function. Am. J. Physiol. Heart Circ. Physiol. 265, H747–H754 (1993).
Volz, A., Piper, H.M., Siegmund, B. & Schwartz, P. Longevity of adult ventricular rat heart muscle cells in serum-free primary culture. J. Mol. Cell. Cardiol. 23, 161–173 (1991).
Radisic, M. et al. Medium perfusion enables engineering of compact and contractile cardiac tissue. Am. J. Physiol. Heart Circ. Physiol. 286, H507–H516 (2004).
Radisic, M. et al. Biomimetic approach to cardiac tissue engineering: oxygen carriers and channeled scaffolds. Tissue Eng. 12, 2077–2091 (2006).
Zimmermann, W.H. et al. Tissue engineering of a differentiated cardiac muscle construct. Circ. Res. 90, 223 (2002).
Radisic, M. et al. From the cover: functional assembly of engineered myocardium by electrical stimulation of cardiac myocytes cultured on scaffolds. PNAS 101, 18129–18134 (2004).
Feng, Z., Matsumoto, T., Nomura, Y. & Nakamura, T. An electro-tensile bioreactor for 3-D culturing of cardiomyocytes. IEEE Eng. Med. Biol. Mag. 24, 73–79 (2005).
Radisic, M. et al. Biomimetic approach to cardiac tissue engineering. Philos. Trans. R. Soc. Lond. B Biol. Sci. 362, 1357–1368 (2007).
Hart, R.A. & Gandhi, O.P. Comparison of cardiac-induced endogenous fields and power frequency induced exogenous fields in an anatomical model of the human body. Phys. Med. Biol. 43, 3083–3099 (1998).
Bian, W. & Tung, L. Structure-related initiation of reentry by rapid pacing in monolayers of cardiac cells. Circ. Res. 98, e29–e38 (2006).
Kong, C.-R., Bursac, N. & Tung, L. Mechanoelectrical excitation by fluid jets in monolayers of cultured cardiac myocytes. J. Appl. Physiol. 98, 2328–2336 (2005).
Sathaye, A., Bursac, N., Sheehy, S. & Tung, L. Electrical pacing counteracts intrinsic shortening of action potential duration of neonatal rat ventricular cells in culture. J. Mol. Cell. Cardiol. 41, 633–641 (2006).
Berger, H.J. et al. Continual electric field stimulation preserves contractile function of adult ventricular myocytes in primary culture. Am. J. Physiol. Heart Circ. Physiol. 266, H341–H349 (1994).
Levin, M. Motor protein control of ion flux is an early step in embryonic left–right asymmetry. BioEssays 25, 1002–1010 (2003).
Feld, Y. et al. Electrophysiological modulation of cardiomyocytic tissue by transfected fibroblasts expressing potassium channels: a novel strategy to manipulate excitability. Circulation 105, 522–529 (2002).
Munoz, V. et al. Adenoviral expression of IKs contributes to wavebreak and fibrillatory conduction in neonatal rat ventricular cardiomyocyte monolayers. Circ. Res. 101, 475–483 (2007).
Nuccitelli, R. Endogenous ionic currents and DC electric fields in multicellular animal tissues. Bioelectromagnetics. (Suppl 1): 147–157 (1992).
Ypey, D.L., Clapham, D.E. & DeHaan, R.L. Development of electrical coupling and action potential synchrony between paired aggregates of embryonic heart cells. J. Membrane Biol. 51, 75–96 (1979).
Tandon, N., Cannizzaro, C., Figallo, E., Voldman, J. & Vunjak-Novakovic, G. Characterization of electrical stimulation electrodes for cardiac tissue engineering. Conf. Proc. IEEE Eng. Med. Biol. Soc. 1, 845–848 (2006).
Au, H.T., Cheng, I., Chowdhury, M.F. & Radisic, M. Interactive effects of surface topography and pulsatile electrical field stimulation on orientation and elongation of fibroblasts and cardiomyocytes. Biomaterials 28, 4277–4293 (2007).
Park, H. et al. Electrical stimulation and extracellular matrix remodeling of C2C12 cells cultured on collagen scaffolds. J. Tissue Eng. Regen. Med. 2, 279–287 (2008).
Chao, P.H. et al. Chondrocyte translocation response to direct current electric fields. J. Biomech. Eng. 122, 261–267 (2000).
Reid, B., Nuccitelli, R. & Zhao, M. Non-invasive measurement of bioelectric currents with a vibrating probe. Nat. Protoc. 2, 661–669 (2007).
Song, B. et al. Application of direct current electric fields to cells and tissues in vitro and modulation of wound electric field in vivo . Nat. Protoc. 2, 1479–1489 (2007).
Radisic, M., Marsano, A., Maidhof, R., Wang, Y. & Vunjak-Novakovic, G. Cardiac tissue engineering using perfusion bioreactor systems. Nat. Protoc. 3, 719–738 (2008).
Tandon, N., Marsano, A., Cannizzaro, C., Voldman, J. & Vunjak-Novakovic, G. Design of electrical stimulation bioreactors for cardiac tissue engineering. Conf. Proc. IEEE Eng. Med. Biol. Soc. 1, 3594–3597 (2008).
Durand, D. Electric stimulation of excitable tissue. In The Biomedical Engineering Handbook (eds. Durand, D., & Bronzino, J.D.), 229–251 (CRC Press, Boca Raton, FL, 1995).
Cannizzaro, C. et al. Practical aspects of cardiac tissue engineering with electrical stimulation. Methods. Mol. Med. 140, 291–307 (2007).
Loe, M.J. & Edwards, W.D. A light-hearted look at a lion-hearted organ (or, a perspective from three standard deviations beyond the norm) Part 1 (of two parts). Cardiovasc. Pathol. 13, 282–292 (2004).
Norlin, A., Pan, J. & Leygraf, C. Investigation of electrochemical behavior of stimulation/sensing materials for pacemaker electrode applications. J. Electrochem. Soc. 152, J7–J15 (2005).
Erickson, C.A. & Nuccitelli, R. Embryonic fibroblast motility and orientation can be influenced by physiological electric fields. J. Cell Biol. 98, 296–307 (1984).
Graham, L. & Orenstein, J.M. Processing tissue and cells for transmission electron microscopy in diagnostic pathology and research. Nat. Protoc. 2, 2439–2450 (2007).
Flemming, R.G., Murphy, C.J., Abrams, G.A., Goodman, S.L. & Nealey, P.F. Effects of synthetic micro- and nano-structured surfaces on cell behavior. Biomaterials 20, 573–588 (1999).
Clark, P., Connolly, P., Curtis, A.S., Dow, J.A. & Wilkinson, C.D. Cell guidance by ultrafine topography in vitro . J. Cell Sci. 99, 73–77 (1991).
Clark, P., Connolly, P., Curtis, A.S., Dow, J.A. & Wilkinson, C.D. Topographical control of cell behaviour: II. Multiple grooved substrata. Development 108, 635–644 (1990).
Eisenbarth, E., Meyle, J., Nachtigall, W. & Breme, J. Influence of the surface structure of titanium materials on the adhesion of fibroblasts. Biomaterials 17, 1399–1403 (1996).
Severs, N.J. The cardiac muscle cell. BioEssays 22, 188–199 (2000).
Shen, Y.H., Shoichet, M.S. & Radisic, M. Vascular endothelial growth factor immobilized in collagen scaffold promotes penetration and proliferation of endothelial cells. Acta Biomaterialia 4, 477–489 (2008).
Bursac, N., Parker, K.K., Iravanian, S. & Tung, L. Cardiomyocyte cultures with controlled macroscopic anisotropy: a model for functional electrophysiological studies of cardiac muscle. Circ. Res. 91, e45–e54 (2002).
Olivetti, G., Anversa, P. & Loud, A.V. Morphometric study of early postnatal development in the left and right ventricular myocardium of the rat. II. Tissue composition, capillary growth, and sarcoplasmic alterations. Circ. Res. 46, 503–512 (1980).
Soong, H., Parkinson, W., Sulik, G. & Bafna, S. Effects of electric fields on cytoskeleton of corneal stromal fibroblasts. Curr. Eye Res. 9, 893–901 (1990).
Erickson, C.A. Control of neural crest cell dispersion in the trunk of the avian embryo. Dev. Biol. 111, 138–157 (1985).
Nishimura, K.Y., Isseroff, R.R. & Nuccitelli, R. Human keratinocytes migrate to the negative pole in direct current electric fields comparable to those measured in mammalian wounds. J. Cell Sci. 109, 199–207 (1996).
Acknowledgements
We thank Dr Clark Hung (Columbia University) for help with the design of DC studies, and Dr Christopher Yip and Mr Patrick Yang (University of Toronto) for help with AFM. Work described here has been funded by HL076485-03 and EB002520 (to G.V.-N.), NSERC Discovery Grant and CFI LOF grant (to M.R.), Postdoctoral Fellowship from the Arthritis Foundation (to P.-H.G.C.) and Presidential Fellowship of Columbia University (to N.T.).
Author information
Authors and Affiliations
Corresponding author
Supplementary information
41596_2009_BFnprot2008183_MOESM264_ESM.zip
Supplementary Data 2: Matlab program code for quantifying the number of connexin protein clusters in an immunostained image. (ZIP 144 kb)
Rights and permissions
About this article
Cite this article
Tandon, N., Cannizzaro, C., Chao, PH. et al. Electrical stimulation systems for cardiac tissue engineering. Nat Protoc 4, 155–173 (2009). https://doi.org/10.1038/nprot.2008.183
Published:
Issue Date:
DOI: https://doi.org/10.1038/nprot.2008.183
This article is cited by
-
Making Sense of Electrical Stimulation: A Meta-analysis for Wound Healing
Annals of Biomedical Engineering (2024)
-
Analysis of the role of perfusion, mechanical, and electrical stimulation in bioreactors for cardiac tissue engineering
Bioprocess and Biosystems Engineering (2024)
-
Leaf-venation-directed cellular alignment for macroscale cardiac constructs with tissue-like functionalities
Nature Communications (2023)
-
The MyoPulser field stimulator, a do it yourself programmable electronic pacemaker for contracting cells and tissues
Scientific Reports (2023)
-
Effect of direct current electrical stimulation on osteogenic differentiation and calcium influx
Korean Journal of Chemical Engineering (2023)
Comments
By submitting a comment you agree to abide by our Terms and Community Guidelines. If you find something abusive or that does not comply with our terms or guidelines please flag it as inappropriate.
