
Abstract
We describe here detailed protocols to design, optimize and validate in vitro phosphatase assays that we have utilized to conduct high-throughput screens for inhibitors of dual-specificity phosphatases: CDC25B, mitogen-activated protein kinase phosphatase (MKP)-1 and MKP-3. We provide details of the critical steps that are needed to effectively miniaturize the assay into a 384-well, high-throughput format that is both reproducible and cost effective. In vitro phosphatase assays that are optimized according to these protocols should satisfy the assay performance criteria required for a robust high-throughput assay with Z-factors >0.5, and with low intra-plate, inter-plate and day-to-day variability (CV <20%). Assuming the availability of sufficient active phosphatase enzyme and access to appropriate liquid handling automation and detection instruments, a single investigator should be able to develop a 384-well format high-throughput assay in a period of 3–4 weeks.
Introduction
There has been a dramatic increase in the number of academic laboratories engaged in the implementation of high-throughput screening (HTS) for the identification of small molecule modulators of molecular targets during the last 5 years. As part of the NIH Roadmap Initiative, ten HTS centers have been established as a network to provide the academic community broader access to HTS capabilities1,2. The Pittsburgh Molecular Library Screening Center has been assigned several assays focused on challenging phosphatase targets that have been implicated in the regulation of cell cycle and apoptosis pathways. Our goal has been to identify small molecule inhibitors of these enzymes with the potential for lead optimization and subsequent use as chemical probes. Ultimately, we hope the identified compounds could be further refined and developed into novel cancer chemotherapeutics. Previously, we described a 96-well in vitro phosphatase assay that was utilized to screen several relatively small compound libraries (500–10,000 compounds) for inhibitors of the dual-specificity phosphatase CDC25B (see refs. 3, 4, 5, 6, 7, 8, 9, 10, 11, 12). There has been considerable interest in finding inhibitors of CDC25B because of its pivotal role in cell cycle regulation, its oncogenic properties and its overexpression in many cancer cell lines13,14,15,16. The assay is a homogeneous, fluorescence intensity assay that measures the phosphatase-mediated hydrolysis of the artificial substrate 3-O-methylfluorescein phosphate17. This assay system was adapted to enable determination of the activity of other dual-specificity phosphatase targets, including MKP-1 and MKP-3 (see ref. 12). MKPs dephosphorylate both tyrosine and threonine residues on mitogen-activated protein kinases and thus inactivate Erk, JNK and p38 (refs. 18,19). They have also been implicated in enhancing tumorigenicity and are highly expressed in prostate, breast, gastric and renal cancer20,21,22,23.
Although these protocols were optimized for HTS with the CDC25B, MKP-1 and MKP-3 phosphatases, we believe these methods and principles are quite general and can be used to optimize screening protocols for many other human and lower organism protein tyrosine phosphatases. It should be noted, however, that the suggested times listed for assay completion as well as expected results will be dependent on the individual enzyme you are testing and the resources available (equipment, personnel). The high-throughput protocols listed below are based on a 384-well format using automated, robotic platforms for reagent addition. It is possible to perform these assays in smaller (e.g., 96-well) or larger (e.g., 1,536) density formats using appropriate hand-held multichannel pipettors or automated liquid handlers. If these types of formats are desired, the time frame for preparing and completing the assays will differ. Although we provide details for optimizing a fluorescence-based phosphatase assay for HTS, many of these basic principles can be used for non-fluorescence-based assays as well. The order in which the optimization steps are presented below and in the PROCEDURE section represents a useful order to adopt to facilitate the final screening.
We have outlined below a general phosphatase assay protocol that is used to screen compound libraries for potential inhibitors of the desired target enzyme. This protocol is also utilized during each step in the development and optimization of a high-throughput assay. Each step requires slight modifications to this general phosphatase protocol based on the outcome one is measuring. Typically, assay development begins with the determination of optimal enzyme and substrate concentrations followed by optimization of specific assay conditions (pH, dimethyl sulfoxide (DMSO)). Once the assay is developed, the assay must be assessed for HTS compatibility by testing fluorescent signal stability, enzyme stability and assay variability. These are critical factors for determining the throughput and capacity of the assay and the ability to reliably identify active compounds. Finally, the fully developed and optimized high-throughput assay can be used for screening of compound libraries.
Enzyme and substrate concentration determination
A crucial element for all biochemical HTS assays is obtaining sufficient amounts of relatively pure enzyme with adequate biological activity. We have traditionally expressed either the full-length or the catalytic domain of our phosphatases in bacterial expression systems utilizing a hexa-histidine (His6) epitope tag for purification by immobilized metal affinity chromatography. The expression and purification of the catalytic domain of an enzyme often yields larger amounts of protein with higher purity and biological activity than that seen with the full-length enzyme. This is particularly important when the phosphatase is difficult to express and typically provides a strategy to generate sufficient biologically active protein to pursue an HTS campaign. The potential drawbacks to utilizing only the catalytic domain of your enzyme are that it may preclude the identification of allosteric modulators and substrate binding inhibitors that may have been found by screening with the full-length enzyme, and compounds found to inhibit the catalytic domain may not necessarily inhibit the full-length enzyme. We have estimated the relative purity of the enzyme preparation by separating proteins by SDS-PAGE, staining with either Coomassie blue or silver stains and using scanning densitometry to quantify the relative amounts of each protein band. The identity of the specific enzyme is typically based on the presence of a band that corresponds with the molecular weight of the expressed protein, and immunoreactivity with protein or epitope-tagged specific antibodies by western blot. We do not provide specific details for the bacterial expression and purification of phosphatases, as standard protocols for immobilized metal affinity chromatography purification of proteins are available (see http://www.clontech.com/images/pt/PT1320-1.pdf) and are readily adaptable to other enzymes of interest. We do, however, provide a protocol for the determination of enzymatic activity and selection of the amount of enzyme required per reaction.
We have selected the generic, artificial substrate 3-O-methylfluorescein phosphate (OMFP), which is hydrolyzed by phosphatases to yield O-methylfluorescein (OMF) that is detected at a 485 nm excitation/525 nm emission in a suitable microtiter plate reader. There are many artificial substrates available such as p-nitrophenyl phosphate, fluorescein diphosphate and 6,8-difluoro-4-methylumbellyferyl phosphate24. We recommend OMFP owing to its higher binding efficiency and more efficient hydrolysis observed with phosphatases, such as CDC25B (ref. 25), and the simpler enzyme kinetics compared to the diphosphate substrates. We recommend that the fluorescent signal be captured every 5–10 min for up to 60–90 min and fluorescent intensity plotted versus time (Fig. 1a). With an enzyme preparation that is stable for the duration of the assay, the fluorescent signal should increase linearly over time. The fluorescent intensity rate should increase with increasing enzyme concentration until saturation occurs at higher enzyme levels owing to substrate depletion. Based on our experience, we would select the minimum amount of enzyme required to produce a linear enzymatic response for the complete duration of the assay that also produces a suitable signal to background ratio (S:B) (>5) at the selected time point (e.g., 60 min). This analysis is also important for determining the incubation time needed for maximal enzyme activity. In our particular example, 15.63 ng per well was selected for CDC25B with an incubation time of 60 min (Fig. 1a).

(a) CDC25B phosphatase activity was established by adding increasing amounts of enzyme and observing the fluorescence every 10 min for 1 h. (b) To calculate the initial velocity (Vo) for Km determination, phosphatase activity is examined using increasing amounts of OMFP substrate and observing fluorescence every 10 min for 1 h. Once the fluorescence values are converted to OMF product formed, these values are plotted over time for each OMFP substrate concentration to determine the Vo from the slope of each line. (c) The Vo is then plotted against OMFP substrate concentration through Michaelis–Menten enzyme analysis to calculate the Km = Vmax/2.
It is preferable to conduct HTS enzymatic assays under initial velocity conditions where less than 10% of the substrate is depleted or less than 10% of product is formed. The substrate concentration typically selected for an in vitro phosphatase assay is at or below the Km based on Michaelis–Menten kinetics. It is critical to ensure that under the enzyme and substrate conditions selected, the velocity remains linear throughout the course of the enzymatic reaction (reviewed in http://www.ncgc.nih.gov/guidance/section4.html). Using substrate concentrations at or below the Km is particularly important for the identification of competitive inhibitors. The determination of substrate Km is also an excellent procedure to verify the quality of different batches of enzyme, as the substrate Km should be constant. To determine the Km for a particular substrate and enzyme, we varied the substrate concentration between 0.2 and 5.0 × Km (if the approximate Km of the enzyme is known) using six to eight substrate concentrations, and enzymatic activity was measured every 10 min for a total of 60 min. If the Km has not been previously published, it is advisable to use substrate concentrations that cover a wide range for initial estimations. A standard curve is generated by plotting known amounts of OMF versus the fluorescence generated to be used to convert the end-point fluorescence for each assay point to OMF product formed. The initial velocity is determined by plotting OMF product formation at each OMFP substrate concentration over time, with the slope of each line representing initial velocity (Vo) (Fig. 1b). The Vo is then plotted against each substrate concentration in a nonlinear, regression analysis using a rectangular hyperbola model for determination of Km (Vmax/2) and Vmax (velocity with saturating substrate conditions) (Fig. 1c). Determining the reaction progress curves for the enzyme and the substrate Km provides the basis for selection of the major assay conditions for the HTS assay: enzyme concentration, substrate concentration and time of incubation. The Km of OMFP that we obtained for CDC25B at 40 μM was consistent with published results25.
Defining the pH optima of the phosphatase and selecting assay performance controls
It is important to determine the pH optima for all enzyme assays to maximize the assay signal window between background and a fully active enzymatic response (Fig. 2). In addition, the selection of appropriate assay performance/plate controls is one of the most critical steps to developing a reproducible and robust HTS assay. Maximum controls define the top of the assay signal window and represent, in our case, the highest attainable fluorescent intensity signal produced by the fully active phosphatase using OMFP as the substrate. Maximum controls usually include enzyme, substrate and the compound solvent/vehicle (usually DMSO) in the appropriate reaction buffer. The minimum controls will define the bottom of the assay signal window and, in our case, represent the lowest fluorescent signal produced by a fully inhibited phosphatase enzyme in the presence of the OMFP substrate. Ideally, HTS assay performance/plate controls should be chosen to produce a signal window within at least 1 s.d. unit of the largest signal between the mean maximum signal − 3 × the standard deviation of the mean (s.d.m.) and the mean minimum signal + 3 × s.d.m. (see ref. 26 and Fig. 3). Based on previous observations, 100 μM sodium o-vanadate (Na3VO4), a nonspecific phosphatase inhibitor, was used as the minimum fully inhibited enzyme control for the CDC25B assay. To determine the pH optima of the CDC25B phosphatase, we compared the fluorescent intensity signal produced after incubation of the fully active phosphatase with OMFP to a signal produced with no enzyme and a maximally inhibited enzyme with Na3VO4 at each indicated buffer pH (Fig. 2). In comparison to the no enzyme control, CDC25B exhibited significant activity at every buffer pH tested, where the mean fluorescent intensity signal appeared to increase in a roughly linear fashion between pH 6.5 and 8.5. At pH 6.5 and 7.0, Na3VO4 failed to effectively inhibit CDC25B, but the degree of inhibition improved as the pH increased. Na3VO4 maximally inhibited CDC25B at pH 8–8.5, producing the best S:B ratio (Fig. 2). Based on these findings, a pH of 8.0 was selected for CDC25B HTS assay. With the MKP-1 and MKP-3 dual-specificity phosphatases, however, the optimal enzyme activity was at pH 7.0. Because Na3VO4 does not maximally inhibit phosphatases at pH 7.0, and there are no other readily available small molecule inhibitors for either enzyme, we were forced to select another minimum control. In assays where there is an absence of an appropriate enzyme inhibitor, the minimum controls have been represented by wells containing no enzyme or by enzymes that have been inactivated with heat or by high concentrations of acids, bases and/or detergents. Although the use of an inactivated or no enzyme minimum control may sometimes provide a larger assay signal window, a fully inhibited enzyme represents the true bottom of the signal window and is the more appropriate and preferred minimum control. For MKP-1 and MKP-3, we selected NaOH (100 mM) for the minimum assay performance/plate control. For HTS assays, it is also typical to include an additional group of performance/plate controls: either an IC50 curve or a 50% inhibitor control to confirm the reproducibility of enzyme inhibition on each assay plate. In our assays, we utilized 5 μM Na3VO4 as our 50% control for the CDC25B assay, and 20 mM NaOH for the MKP-1 and MKP-3 assays. In addition to providing an intermediate inhibited enzyme control, the 50% controls prevent the plate controls from being symmetrical and provide a means to determine whether plates have been inadvertently rotated through 180° when loaded into the microtiter plate reader.

The maximum and minimum signal controls for CDC25B were analyzed and compared to a no enzyme control in assay buffer with varying pH. The fluorescence end point was plotted versus pH to determine the pH that provided the best signal window. The fluorescence of the minimum signal control increased with decreasing pH because Na3VO4 could not maximally inhibit CDC25B at lower pH. A pH of 8 was chosen as the optimal pH for the assay.

Data from each of the two maximum and two minimum control plates for CDC25B are plotted as fluorescence versus well number on a scatter plot to visualize data scatter from experiments performed on an individual day. The dark black line in the center of the maximum control data points indicates the mean of the maximum controls. The signal window (mean maximum signal/mean minimum signal) should be within 3 s.d. from the average of the maximum signal as indicated by the thick yellow lines. Z′ represents the Z-factor calculated from the means and s.d. of the maximum and minimum controls.
Stability of reagents and assay signal
For fluorescence-based assays, factors such as buffer components and pH must be optimized to obtain optimal signal over background. The pH of the buffer will not only affect the quantum efficiency of the fluorescein fluorescent signal itself, but as described in the previous section, it can also affect enzyme activity and ultimately the S:B window. A pH of 8.0 was selected for the CDC25B assay and a pH of 7.0 for both the MKP-1 and MKP-3 assays. Furthermore, the stability of that signal must be studied to determine if the assay is suitable for HTS. The optimal buffer components for our assay are listed in the MATERIALS section; however, these conditions may not be optimal for your particular enzyme. The catalytic cysteine of the dual-specificity phosphatases (Cdc25, MKP-1 and MKP-3) is highly susceptible to oxidation and inactivation27,28,29,30,31. Therefore, the reductant dithiothreitol (DTT) is used to keep the phosphatase in its reduced and active form. Bovine serum albumin (BSA) is added to maintain enzyme stability, to prevent protein aggregation and reduce nonspecific binding to pipette tips and reagent troughs.
Depending on the size of the compound library to be screened, the plate density selected, and the throughput/capacity of the liquid handling and robotic systems utilized, a screening campaign may require anywhere from 1–2 days to several weeks to complete. A series of stability studies should be conducted to confirm that the reagents will be stable under the storage conditions selected for the projected duration of the HTS and follow-up work. If large amounts of enzyme are purified ahead of time, it will typically be stored in aliquots at −80 °C. The freeze–thaw stability of enzyme activity must be examined to ensure that enzyme integrity is maintained. This is particularly important for enzymes that are difficult to purify and must be used sparingly. Ideally, single lots of reagents should be available for the duration of the HTS campaign. If multiple lots of critical reagents such as the enzyme or substrate are required, data should be collected on the performance and reproducibility of the different lots. When screening hundreds to thousands of compounds in HTS, it may be several hours before the diluted enzyme has been added to all of the assay plates. Enzyme handling conditions and reagent stability during the daily screening operation (8 h shift) should be confirmed. If any of the assay components have special requirements (e.g., light sensitivity), these should be indicated together with a strategy to address these issues for the HTS. Finally, an appropriate reagent must be selected to stop the enzyme reaction at a given time and maintain the stability of the fluorescent signal, as reading the fluorescent end-point signal on hundreds of assay plates can take several hours. If the assay signal stability is less than the time required to read multiple plates on the detection instrument of choice, plates may have to be batch processed and throughput will be affected. We have provided protocols to address these issues to ensure that individual enzymes and assays can be transposed into an HTS format.
Assay variability
The final test of whether an assay is suitable for HTS is a determination of the robustness and reproducibility of the results. For an HTS assay, there are multiple factors that may contribute to data variability including non-optimized assay conditions, the precision and accuracy of each liquid handling step, uneven evaporation and/or temperature equilibration, non-normalized detection instrumentation, and lot to lot differences in reagents, pipette tips and microtiter plates. Maximizing the assay signal window, combined with minimizing assay variability, is critical for identifying active compounds in HTS assays. The reproducibility and variability of the maximum and minimum plate controls should be tested within the assay plate itself (intra-plate), from plate to plate (inter-plate) and from day to day. Details for measuring variability and for calculating the CV are listed in the 3-day, intra-plate and inter-plate assay variability sections in the PROCEDURE. Perhaps the most widely accepted statistical parameter for measuring the quality of an assay for HTS is the calculation of the “Z-factor”32. A Z-factor of >0.5 for a given assay is defined as having a large dynamic range with low data variation. A Z-factor of 1 is considered an ideal assay. Examples are shown in Figure 3 and Table 1, demonstrating the data scatter and statistical analysis of our CDC25B assay. The graphical representation of the data demonstrates the low variability of the maximum and minimum signal controls in our 3-day variability experiments with a wide dynamic range (signal window) between the signal controls. The inter-plate, intra-plate and day to day variation all exhibited CV values of <20%, with Z-factors >0.5.
Materials
Reagents
-
Purified enzyme CDC25B, MKP-1 or MKP-3 (individually expressed and purified)
-
Trizma (Sigma)
-
NaCl (VWR)
-
Ethylenediaminetetraacetic acid (EMD)
-
200 mM DTT (Sigma); store aliquots at −80 °C
-
6.6% BSA (w/v; Invitrogen); store aliquots at −80 °C
-
OMFP (Sigma)
-
Na3VO4 (Fisher Scientific)
-
Sodium hydroxide (EMD)
-
DMSO 99.9% HPLC grade under argon (Alfa Aesar).
Critical
DMSO is packaged under argon to prevent H2O absorption. The use of high-quality DMSO is required for accurate compound dissolution and handling; low-grade DMSO may contribute to variability in compound concentration and/or a lack of reproducibility in assay results.
Equipment
-
Multichannel pipettors (Gilson)
-
Automated robotic liquid handlers for reagent addition—Vprep (Velocity 11) or Evolution EP3 (Perkin Elmer); note that automated liquid handlers are recommended although manual pipettors can be used
-
Multi-plate shaker—Heidolph Titramax 1000 (VWR)
-
Centrifuge with microplate carriers—Avanti J-E centrifuge (Beckman Coulter)
-
Fluorescence plate reader—Spectromax M5 (Molecular Devices)
-
384 black, low-volume microtiter plates (Greiner)
Reagent setup
-
10 × stock assay buffer 300 mM Trizma, 750 mM NaCl and 10 mM ethylenediaminetetraacetic acid with the pH adjusted to the optima for the enzyme (pH 8.0 for CDC25B, pH 7.0 for MKP-1, MKP-3).
Critical
All buffers and bottles should be autoclaved to prevent free phosphate from interfering with the reaction.
-
Diluted assay buffer with DTT/BSA Dilute 10 × stock assay buffer to 3 × in H2O and check pH. Add DTT and BSA to final concentrations of 3 mM DTT and 0.099% BSA in the 3 × assay buffer.
Critical
DTT and BSA must be added fresh to diluted assay buffer before performing the assay.
-
OMFP Prepare a concentrated stock of 2 mM OMFP in high-quality DMSO (see MATERIALS). Immediately before the addition of OMFP to the assay plates, dilute the stock OMFP in H2O to the appropriate 3 × concentration as determined by the Km analysis for each phosphatase (example: if the final substrate concentration for the assay =40 μM, prepare a 120 μM intermediate dilution in H2O).
Critical
Stocks of OMFP must be made fresh daily and should be sonicated to dissolve completely. Diluting OMFP in H2O must be performed immediately before transfer of the reagent to the assay plates. OMFP begins to hydrolyze instantly upon addition to H2O, which introduces background fluorescence.
-
Assay stop solution For the CDC25B assay, a 2 mM stock solution of Na3VO4 in H2O is prepared to stop the enzymatic reaction. For MKP-1 and MKP-3 assays, a 500 mM NaOH stock solution is prepared.
Critical
It is important to terminate the enzymatic reaction at the time point that was previously determined to be within the linear response of the enzyme. Failure to stop the enzymatic reaction could allow a partially inhibited enzyme to continue to generate signal, which could be misconstrued as a false negative result.
-
Inhibitor stocks For the minimum control wells, prepare a 1.5 mM stock solution of Na3VO4 in H2O to maximally inhibit CDC25B and a 300 mM stock solution of NaOH in 3% DMSO to maximally inhibit MKP-1 and MKP-3. For the 50% IC50 inhibitor controls, 15 μM stock concentration of Na3VO4 in H2O is prepared as an internal control to show 50% inhibition of CDC25B. NaOH at 60 mM is prepared in a 3% DMSO solution to show 50% inhibition of MKP-1 and MKP-3.
Procedure
Assay development: enzyme concentration determination
Timing ∼2.5 h
-
1
Prepare the stock solutions described above with the exception of the 50% inhibitor stock and stop solutions.
-
2
Prepare serial dilutions of the phosphatase enzyme in 3 × assay buffer containing DTT and BSA (for example, twofold dilutions from 1,000 to 0 ng per well) and place on ice.
-
3
Dispense 5 μl of de-ionized H2O to all assay wells.
-
4
Transfer 5 μl of each dilution of phosphatase enzyme in 3 × assay buffer to the assay plate.
Critical Step
Each enzyme dilution should have a minimum of three replicates, but more replicates (6–12) are recommended.
-
5
Follow Steps 63 and 64 from the Basic phosphatase assay protocol.
-
6
Immediately begin measuring fluorescence intensity of assay plates every 5–10 min for 1 h using a fluorescence plate reader set at an excitation of 485 nm and emission of 525 nm. Plot fluorescence intensity versus time for each enzyme dilution using an appropriate graphing software program. The minimum amount of enzyme that provides a linear enzymatic response with an acceptable S:B ratio (≥5) at a selected time point (60 min) is chosen to perform the assays (Fig. 1a). Note that for assays with extremely low variability, it may be possible to select lower amounts of enzyme with S:B ratios <5, but for most assays, an S:B ratio ≥5 is recommended.
Substrate concentration determination (Km)
Timing ∼2.5 h
-
7
Prepare the stock solutions described above with the exception of the 50% inhibitor stock and stop solutions.
-
8
Dilute a predetermined amount of phosphatase enzyme (calculated in Step 6) in stock 3 × assay buffer containing DTT and BSA and place on ice. If the optimal enzyme concentration has not been determined, use a concentration that provides at least a five fold S:B ratio.
-
9
Prepare serial dilutions of OMFP in DMSO with concentrations ranging between 0.2 and 5 times the published Km for the enzyme, using at least eight substrate concentrations. Note that if there is no published Km, then choose a wide range of substrate concentrations for an initial estimate.
Critical Step
Serial dilutions of OMFP must be prepared in DMSO.
-
10
Dispense 5 μl of de-ionized H2O to all assay wells.
Critical Step
Each substrate concentration should have a minimum of three replicates, but more replicates (6–12) are recommended.
-
11
Transfer 5 μl of the previously diluted phosphatase in 3 × assay buffer to the assay plate.
-
12
Dispense 5 μl of each OMFP dilution to the appropriate assay wells.
-
13
Centrifuge assay plates for 1–2 min at 50g (r.p.m. depends on rotor size) at ambient temperature.
-
14
Immediately begin measuring fluorescence intensity of assay plates every 5–10 min for 1 h using a fluorescence plate reader set at an excitation of 485 nm and emission of 525 nm. Plot the fluorescence intensity (OMF product) versus time, with the slope of each line representing initial velocity (Vo) (Fig. 1b). The Vo is then plotted against each substrate concentration (OMFP) in a nonlinear regression analysis using a rectangular hyperbola model for determination of Km and Vmax (Fig. 1c).
Optimization of assay conditions: optimal pH
Timing ∼2.5 h
-
15
Prepare stock solutions as described above with the exception of the 50% inhibitor stock.
-
16
For the diluted assay buffer, dilute 10 × assay buffer to 3 × in H2O and adjust pH to range from 6.0 to 8.5 in 0.5 increments. Add DTT and BSA as stated in REAGENT SETUP.
-
17
Dilute a predetermined amount of phosphatase enzyme (calculated in Step 6; see Enzyme concentration determination) into the stock 3 × assay buffer containing DTT and BSA at each pH and place on ice. Save a portion of the 3 × assay buffer solutions at each pH for the no enzyme controls.
-
18
Dispense 5 μl of de-ionized H2O to wells used for maximum signal control wells and for no enzyme control wells.
Critical Step
A minimum of three replicates for maximum control wells should be determined at each pH, but more replicates (6–12) are recommended.
-
19
Add 5 μl of 1.5 mM Na3VO4 (CDC25B) or 300 mM NaOH (MKP-1, MKP-3) to minimum signal control wells.
Critical Step
A minimum of three replicates for minimum control wells should be determined at each pH, but more replicates (6–12) are recommended.
-
20
Transfer 5 μl of the previously diluted phosphatase in 3 × assay buffer at each pH to assay wells containing 5 μl of de-ionized H2O except for wells to be used for no enzyme controls.
-
21
Transfer 5 μl of the previously diluted 3 × assay buffer at each pH to no-enzyme control wells containing 5 μl of de-ionized H2O.
Critical Step
Inclusion of a no enzyme control may provide a background baseline that might reveal pH effects on the performance of the control inhibitor (Fig. 2).
-
22
Follow Steps 63–67 from the Basic phosphatase assay protocol.
-
23
Plot and compare the maximum, minimum and no enzyme fluorescence intensity assay signals to determine the pH optima of the enzyme (see Fig. 2).
DMSO tolerance
Timing ∼2.5 h
-
24
Prepare stock solutions as described above with the exception of the 50% inhibitor stock.
-
25
Prepare twofold serial dilutions of DMSO (60–0.117%) in the stock 3 × assay buffer containing DTT and BSA and place on ice.
-
26
Add a predetermined amount of phosphatase enzyme to each DMSO dilution in 3 × assay buffer (calculated in Step 6, see Enzyme concentration determination).
-
27
Dispense 5 μl of H2O to wells used for maximum signal control wells.
Critical Step
A minimum of three replicates for maximum control wells should be determined for each DMSO dilution, but more replicates (6–12) are recommended.
-
28
Add 5 μl of 1.5 mM Na3VO4 (CDC25B) or 300 mM NaOH (MKP-1, MKP-3) to minimum signal control wells.
Critical Step
A minimum of three replicates for minimum control wells should be determined for each DMSO dilution but more replicates (6–12) are recommended.
-
29
Transfer 5 μl of the previously diluted phosphatase in 3 × assay buffer to assay wells for each DMSO dilution (final DMSO dilutions 20–0.39%).
-
30
Follow Steps 63–67 from the Basic phosphatase assay protocol.
-
31
Plot and compare the maximum and minimum fluorescence intensities for each DMSO dilution to determine the maximum tolerated percentage of DMSO that does not significantly alter the response of the assay controls and the resulting signal window relative to the non-DMSO containing controls.
Assessing HTS compatibility: fluorescence signal stability
Timing ∼variable
-
32
Prepare stock solutions as described above with the exception of the 50% inhibitor stock.
-
33
Dispense 5 μl of 3% DMSO solution (see Steps 24–31, DMSO tolerance) to wells used for maximum signal control wells (minimum suggested number of replicates n = 10).
Critical Step
The percentage of DMSO added to control wells should match the percentage used when dispensing compounds and should be the same high-quality DMSO used for the compound dissolution. The maximum percentage of DMSO tolerated by the assay is measured using the DMSO tolerance test.
-
34
Add 5 μl of 1.5 mM Na3VO4 (CDC25B) or 300 mM NaOH (MKP-1, MKP-3) to minimum signal control wells (minimum suggested number of replicates n = 10).
-
35
Dilute a predetermined amount of phosphatase enzyme (calculated in Step 6, see Enzyme concentration determination) into the stock 3 × assay buffer containing DTT and BSA and add 5 μl to all wells.
-
36
Follow Steps 63–66 from the Basic phosphatase assay protocol.
-
37
Measure the fluorescence intensity of the maximum and minimum assay signals immediately after stopping the reaction and every hour thereafter to determine the stability of the assay signal window over time. For CDC25B, MKP-1 and MKP-3, the fluorescence signal remains relatively stable over 6 h.
Enzyme stability
Timing ∼variable
-
38
For plate preparation, follow Steps 32–36 as stated above in fluorescence signal stability.
-
39
The following conditions are recommended to test enzyme stability: (a) enzyme is thawed, diluted in assay buffer and assayed immediately; (b) enzyme is thawed and maintained in a concentrated form on ice for the required time periods; (c) enzyme is diluted in assay buffer immediately after thawing and maintained on ice for the required time periods; (d) enzyme is diluted in assay buffer immediately after thawing and maintained at ambient temperature for the required periods. A new assay plate must be prepared for every time point to be examined after the enzyme was originally thawed and tested.
-
40
Measure fluorescence of assay plates at each time point to determine the stability of the enzyme over time. For CDC25B, MKP-1 and MKP-3, the enzymes remain relatively stable for all of the handling conditions tested for up to 6 h post thaw.
Critical Step
We recommend that the enzyme stability under these various handling conditions should be tested hourly up to the anticipated length of the daily screening operations.
3-day, intra-plate and inter-plate assay variability
Timing ∼3 days total: each day is 2 h for assay, 2 h for analysis
-
41
Maximum control plates: for variability studies, two full plates of maximum signal controls are prepared each day for 3 consecutive days.
-
42
Prepare the appropriate stock solutions described above with the exception of the 50% inhibitor control.
-
43
Dispense 5 μl of 3% DMSO solution (see DMSO tolerance test) to all wells.
-
44
Dilute a predetermined amount of phosphatase enzyme (calculated in Step 6, see Enzyme concentration determination) to the stock 3 × assay buffer containing DTT and BSA and add 5 μl to all wells.
-
45
Follow Steps 63–67 from the Basic phosphatase assay protocol.
-
46
Minimum control plates: for variability studies, two full plates of minimum signal controls are prepared each day for 3 consecutive days.
-
47
Prepare the appropriate stock solutions described above with the exception of the 50% inhibitor control.
-
48
Add 5 μl of 1.5 mM Na3VO4 (CDC25B) or 300 mM NaOH (MKP-1, MKP-3) to all wells (final concentrations: Na3VO4 = 500 μM; NaOH = 100 mM).
-
49
Dilute a predetermined amount of phosphatase enzyme (calculated in Step 6, see Enzyme concentration determination) to the stock 3 × assay buffer containing DTT and BSA and add 5 μl to all wells.
-
50
Follow Steps 63–67 from the Basic phosphatase assay protocol.
-
51
For each day, calculate the mean and s.d. for each of the maximum and minimum signal plates separately. Next, combine 768 data points from the duplicate maximum signal plates to obtain a mean and s.d. for the replicate plates. Repeat this process for both of the minimum signal plates. Use the combined data for the maximum and minimum plates to calculate the Z-factor (see INTRODUCTION) for each day (Table 1).
-
52
Intra-plate variability: calculate the CV based on the s.d. and mean for each of the maximum and minimum control plates performed on a given day (Table 1).
-
53
Inter-plate variability: calculate the CV based on the s.d. and mean determined by the combined data from the duplicate maximum and duplicate minimum signal plates performed on a given day (Table 1).
-
54
Day to day variability: combine the 1,536 data points from the four maximum signal plates from days 1 and 2 and calculate the mean, s.d. and CV. Repeat this process to combine data from days 2 and 3, and 1 and 3. This same analysis should be performed for the minimum signal plates (Table 1).
-
55
To visualize data scatter, plot fluorescence intensity versus well number for all maximum and minimum control wells performed that day (Fig. 3).
Critical Step
Utilizing smaller numbers of data points with no plate to plate or day to day comparison compromises the value of the Z-factor calculation, and may obscure positional variability such as edge effects.
Basic phosphatase assay protocol
Timing ∼2.5 h (20 plates, 384-well format)
-
56
Prepare the appropriate stock solutions described above.
-
57
Remove plates containing compounds in 100% DMSO from −20 °C storage and thaw at 25 °C. Centrifuge plates for 1–2 min at 50g (r.p.m. depends on rotor size). Remove plate seals and transfer an appropriate volume of de-ionized H2O to compound-containing wells to make the concentration 30 μM (in 3% DMSO). Using our proposed plate layout (Fig. 4), transfer 5 μl of each diluted compound via liquid handler into columns 3–22 (final compound concentration = 10 μM). Columns 1, 2 and 23, 24 are used as control wells and contain no test compounds (Fig. 4).
Figure 4: Plate map for 384-well phosphatase assay. 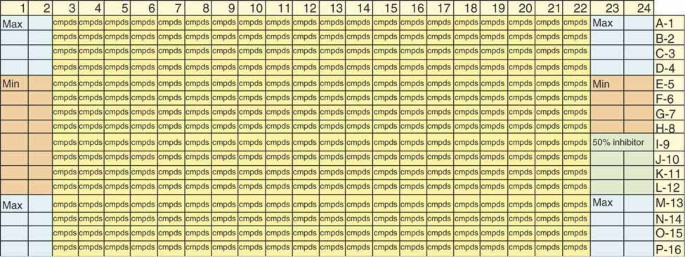
Columns 1, 2 and 23, 24 are used as control wells and contain no test compounds. Wells A1:D2, M1:P2, A23:D24, M23:P24 are used for the maximum signal controls wells (n = 32). Wells E1:L2, E23:H24 are used for the minimum signal control wells (n = 24). Wells I23:L24 (n = 8) are assigned to the 50% inhibitor control wells (Na3VO4–CDC25B or NaOH–MKP-1 and MKP-3). All of the remaining wells are used to test unknown compounds from test compound libraries (columns 3–22; n = 320).
-
58
Dispense 5 μl of 3% DMSO solution (see DMSO tolerance test) to wells used for maximum signal control wells (A1:D2, M1:P2, A23:D24, M23:P24, n = 32; see Fig. 4).
Critical Step
The percentage of DMSO added to control wells should match the percentage used when dispensing compounds and should be the same high-quality DMSO used for the compound dissolution. The maximum percentage of DMSO tolerated by the assay is measured using the DMSO tolerance test.
-
59
Add 5 μl of 1.5 mM Na3VO4 (CDC25B) or 300 mM NaOH (MKP-1, MKP-3) to minimum signal control wells (E1:L2, E23:H24, n = 24; see Fig. 4) (final concentrations: Na3VO4 = 500 μM; NaOH = 100 mM).
-
60
Add 5 μl of 15 μM vanadate or 60 mM NaOH to the 50% vanadate or NaOH inhibitor control wells (I23:L24) (final concentrations: Na3VO4 = 5 μM; NaOH = 20 mM).
-
61
Dilute a predetermined amount of phosphatase enzyme (see Enzyme concentration determination) in the stock 3 × assay buffer containing DTT and BSA and place on ice.
Critical Step
Transferring 5 μl of enzyme in 3 × assay buffer per well to a 384-well plate requires a total volume of 1.92 ml. However, for automated liquid transfers, an additional void volume will be required and should be calculated based on the automated liquid handler, the reagent reservoir and the number of plates to be screened. For example, smaller batches of plates will require a proportionally larger additional void volume to ensure that there are sufficient reagents for every transfer step.
-
62
Transfer 5 μl of the previously diluted phosphatase in 3 × assay buffer (see Step 6) to all wells.
-
63
Add a predetermined amount of stock OMFP in DMSO to H2O to obtain a 3 × concentration based on the substrate Km for the individual phosphatase (for example, add 840 μl of 2 mM stock OMFP solution in DMSO to 13.16 ml H2O based on an OMFP substrate Km = 40 μM for CDC25B). Vortex and immediately transfer 5 μl of the diluted OMFP solution to all wells in assay plate.
Critical Step
Transferring 5 μl of OMFP per well to a 384-well plate requires a total volume of 1.92 ml. However, for automated liquid transfers, an additional void volume will be required and should be calculated based on the automated liquid handler, the reagent reservoir and the number of plates to be screened. For example, smaller batches of plates will require a proportionally larger void volume to ensure that there are sufficient reagents for every transfer step. ▴ CRITICAL STEP Diluting OMFP in H2O must be performed immediately before transfer of the reagent to the assay plates. OMFP begins to hydrolyze immediately upon addition to H2O, which introduces background fluorescence.
-
64
Centrifuge assay plates for 1–2 min at 50g (r.p.m. depends on rotor size) at ambient temperature.
-
65
Incubate plates at ambient temperature for 1 h on a platform shaker at 400 r.p.m.
-
66
After the 1 h incubation, dispense 5 μl of stock stop solution (Na3VO4 or NaOH) to all wells to stop the enzymatic reaction.
Critical Step
It is important to terminate the enzymatic reaction at the time point that was previously determined to be within the linear response of the enzyme. In addition, failure to stop the enzymatic reaction could allow a partially inhibited enzyme to continue to generate signal, which could be misconstrued as a false negative result. ▪ PAUSE POINT Plates can remain at room temperature after stop solution addition for several hours based on signal stability determination (for example, CDC25B signal is stable for ∼4–6 h; see Fluorescence signal stability).
-
67
Determine the fluorescence intensity of assay plates using a fluorescence plate reader set at an excitation of 485 nm and emission of 525 nm.
Critical Step
Depending on the design of the plate reader used, incorporating an emission cutoff filter may improve the signal by reducing background fluorescence.
-
68
Calculate % inhibition of each compound well using the equation
-
69


Troubleshooting
Troubleshooting advice can be found in Table 2.
Anticipated results
The development and optimization of enzymatic phosphatase assays is required to obtain a large assay signal window with low variability such that small molecule inhibitors may be identified from compound libraries screened in high throughput. Through the appropriate characterization of the phosphatase, substrate and assay conditions, it is possible to design experimental conditions that will withstand the variability contributed by the automated HTS process. We describe a variety of assay development and optimization protocols: to determine the amount of phosphatase required to produce an appropriate assay signal window (S:B>5) with a rate of product formation that is linear throughout the assay; to determine the Km of the substrate for determining the substrate concentration for the screen; to determine assay conditions such as the pH optima and % DMSO tolerance that provide maximal enzymatic activity. The stability of the phosphatase enzyme activity and end-point fluorescent signal will determine the throughput and capacity of the HTS. If either of these components is unstable or stable for only a short period of time (<1 h), the number of plates that may be screened in a given time will be limiting and will likely require batch processing. Finally, we describe protocols to conduct a rigorous evaluation of the assay variability by Z-factor statistical analysis to establish the reliability of the data, and form the basis for selecting an active criterion for the screen. A reliable and reproducible assay will produce Z-factors >0.5 based on the maximum and minimum signal controls tested on multiple plates on a given day. In addition, intra-plate, inter-plate and day-to-day variability should yield CV <20%. Utilizing our optimized 384-well phosphatase assays incubated for 60 min at ambient temperature with the appropriate liquid handling automation and 1–2 personnel, we can readily achieve throughputs between 60 and 120 plates (20,000–40,000 compounds) per day. Using these protocols, we have developed and optimized high-throughput phosphatase assays for CDC25B, MKP-1 and MKP-3 to screen the full diversity MLSCN compound library (65,000 compounds), where the data were subsequently published in the PubChem database (http://pubchem.ncbi.nlm.nih.gov/).
References
Austin, C.P., Brady, L.S., Insel, T.R. & Collins, F.S. Molecular Biology: NIH Molecular Libraries Initiative. Science 306, 1138–1139 (2004).
Lazo, J.S. Roadmap or roadkill: a pharmacologist's analysis of the NIH Molecular Libraries Initiative. Mol. Interv. 6, 240–243 (2006).
Brisson, M. et al. Independent mechanistic inhibition of Cdc25 phosphatases by a natural product caulibugulone. Mol. Pharmacol. 71, 184–192 (2007).
Brisson, M. et al. Discovery and characterization of novel small molecule inhibitors of human Cdc25B dual specificity phosphatase. Mol. Pharmacol. 66, 824–833 (2004).
Cao, S., Foster, C., Brisson, M., Lazo, J.S. & Kingston, D.G. Halenaquinone and xestoquinone derivatives, inhibitors of Cdc25B phosphatase from a Xestospongia sp. Bioorg. Med. Chem. 13, 999–1003 (2005).
Cao, S., Foster, C., Lazo, J.S. & Kingston, D.G. Four diterpenoid inhibitors of Cdc25B phosphatase from a marine source. Bioorg. Med. Chem. 13, 5830–5834 (2005).
Cao, S., Foster, C., Lazo, J.S. & Kingston, D.G. Sesterterpenoids and an alkaloid from a Thorectandra sp. as inhibitors of phosphatase Cdc25B. Bioorg. Med. Chem. 13, 5094–5098 (2005).
Cossey, J. et al. Biological evaluation of newly synthesized quinoline-5,8-quinones as Cdc25B inhibitors. Bioorg. Med. Chem. 14, 6283–6287 (2006).
Ducruet, A.P. et al. Identification of new Cdc25 dual specificity phosphatase inhibitors in a targeted small molecule array. Bioorg. Med. Chem. 8, 1451–1466 (2000).
Lazo, J.S. et al. Discovery and biological evaluation of a new family of potent inhibitors of the dual specificity protein phosphatase Cdc25. J. Med. Chem. 44, 4042–4049 (2001).
Lazo, J.S. et al. Identification of a potent and selective pharmacophore for Cdc25 dual specificity phosphatase inhibitors. Mol. Pharmacol. 61, 720–728 (2002).
Lazo, J.S. et al. Novel benzofuran inhibitors of human mitogen-activated protein kinase phosphatase-1. Bioorg. Med. Chem. 14, 5643–5650 (2006).
Galaktionov, K. et al. CDC25 phosphatases as potential human oncogenes. Science 269, 1575–1577 (1995).
Kristjansdottir, K. & Rudolph, J. Cdc25 phosphatases and cancer. Chem. Biol. 11, 1043–1051 (2004).
Lyon, M.A., Ducruet, A.P., Wipf, P. & Lazo, J.S. Dual-specificity phosphatases as targets for antineoplastic agents. Nat. Rev. Drug Discov. 1, 961–976 (2002).
Takemasa, I. et al. Overexpression of CDC25B phosphatase as a novel marker of poor prognosis of human colorectal carcinoma. Cancer Res. 60, 3043–3050 (2000).
Tamura, K. et al. Cdc25 inhibition and cell cycle arrest by a synthetic thioalkyl vitamin K analogue. Cancer Res. 60, 1317–1325 (2000).
Camps, M., Nichols, A. & Arkinstall, S. Dual specificity phosphatases: a gene family for control of MAP kinase function. FASEB J. 14, 6–16 (2000).
Keyse, S.M. Protein phosphatases and the regulation of mitogen-activated protein kinase signaling. Curr. Opin. Cell Biol. 12, 186–192 (2000).
Denkert, C. et al. Expression of mitogen-activated protein kinase phosphatase-1 (MKP-1) in primary human ovarian carcinoma. Int. J. Cancer 102, 507–513 (2002).
Liao, Q. et al. Down-regulation of the dual-specificity phosphatase MKP-1 suppresses tumorigenicity of pancreatic cancer cells. Gastroenterology 124, 1830–1845 (2003).
Magi-Galluzzi, C. et al. Mitogen-activated protein kinase phosphatase 1 is overexpressed in prostate cancers and is inversely related to apoptosis. Lab. Invest. 76, 37–51 (1997).
Wang, H.Y., Cheng, Z. & Mealbon, C.C. Overexpression of mitogen-activated protein kinase phosphatases MKP1, MKP2 in human breast cancer. Cancer Lett. 191, 229–237 (2003).
Montalibet, J., Skorey, K.I. & Kennedy, B.P. Protein tyrosine phosphatase: enzymatic assays. Methods 35, 2–8 (2005).
Gottlin, E.B. et al. Kinetic analysis of the catalytic domain of human Cdc25B. J. Biol. Chem. 271, 27445–27449 (1996).
Sittampalam, G.S. et al. Design of signal windows in high throughput screening assays for drug discovery. J. Biomol. Screen. 2, 159–169 (1997).
Brisson, M. et al. Redox regulation of Cdc25B by cell-active quinolinediones. Mol. Pharmacol. 68, 1810–1820 (2005).
Chen, W., Wilborn, M. & Rudolph, J. Dual-specific Cdc25B phosphatase: in search of the catalytic acid. Biochemistry 39, 10781–10789 (2000).
Salmeen, A. et al. Redox regulation of protein tyrosine phosphatase 1B involves a sulphenyl-amide intermediate. Nature 423, 769–773 (2003).
Sohn, J. & Rudolph, J. Catalytic and chemical competence of regulation of Cd25 phosphatase by oxidation/reduction. Biochemistry 42, 10060–10070 (2003).
Wang, Q. et al. Catalytic inactivation of protein tyrosine phosphatase CD45 and protein tyrosine phosphatase 1B by polyaromatic quinones. Biochemistry 43, 4294–4303 (2004).
Zhang, J.-H., Chung, T.D.Y. & Oldenburg, K.R. A simple statistical parameter for use in evaluation and validation of high throughput screening assays. J. Biomol. Screen. 4, 67–73 (1999).
Author information
Authors and Affiliations
Corresponding author
Ethics declarations
Competing interests
The authors declare no competing financial interests.
Rights and permissions
About this article
Cite this article
Tierno, M., Johnston, P., Foster, C. et al. Development and optimization of high-throughput in vitro protein phosphatase screening assays. Nat Protoc 2, 1134–1144 (2007). https://doi.org/10.1038/nprot.2007.155
Published:
Issue Date:
DOI: https://doi.org/10.1038/nprot.2007.155
This article is cited by
Comments
By submitting a comment you agree to abide by our Terms and Community Guidelines. If you find something abusive or that does not comply with our terms or guidelines please flag it as inappropriate.
