Volume 3
-
No. 12 December 2008
Predicted structure of the Bateman domain of human cystathionine beta synthase (CBS) with bound S-adenosyl methionine using MolIDE and SCWRL. Ribbon colored from N-terminus (blue) to C-terminus (red). Image is from the protocol by Wang et al.
-
No. 11 November 2008
Retinal vasculature visualized by direct DiI labeling. A flat-mounted retina was viewed by fluorescence microscopy. The microphotograph shows a retinal artery with its branches. The nuclei of endothelial cells are identifiable as oval spots. Image is from the protocol by Li et al.
-
No. 10 October 2008
Confocal reconstruction of a part of the endplate band of the triangularis sterni muscle and its innervation in a thy1-YFP16 mouse with yellow fluorescent protein (YFP)-labelled axons. Axons are shown in green, synapses in red and muscle in greyscale. The image is from the protocol by Misgeld et al.
-
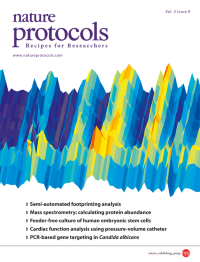
No. 9 September 2008
Expected outcome of the semi-automated footprinting analysis (SAFA) protocol; raw peak amplitudes based on the gel image as a function of concentration and nucleotide number. Using SAFA, a user can quantify the gel image in approximately 20 minutes.
-
No. 8 August 2008
Image of b-cells of an islet of Langerhans graft (green) vascularized by vessels of the iris (red) after engraftment in the anterior chamber of a mouse eye. b-cells are visualized by the expression of GFP under the rat insulin promoter. Blood vessels are visualized by the systemic injection of a fluorescent dextran. Image is from the protocol by Speier et al.
-
No. 7 July 2008
Atomic force microscopy images of the yeast Saccharomyces carlsbergensis (6 μm x 6 μm). Image is from the protocol by Dufrêne. Cover design by Jessica Iannuzzi.
-
No. 6 June 2008
Analysis of dUTP incorporation in a peritoneal effusion from an ovarian cancer patient by flow cytometry. This protocol from Björn Risberg's group provides methods for the measurement of apoptosis and cell surface phenotype of epithelial cells in effusions by flow cytometry. Image is from the protocol by Risberg et al. Cover by Jessica Iannuzzi.
-
No. 5 May 2008
Phase contrast images of freshly prepared and cultured cell fractions from epidermis and dermis of newborn mice. This protocol by Ulrike Lichti, Joanna Anders and Stuart H. Yuspa details the isolation and culture of primary keratinocytes from newborn and adult mice epidermis in a low-calcium medium, for in vitro analysis and grafting to immunodeficient mice. Image is from the protocol by Lichti et al. Cover design by Jessica Iannuzzi.
-
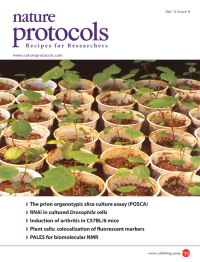
No. 4 April 2008
Acclimatized transgenic cotton plantlets, being grown individually for analysis. Transgenic plants are cultured in vitro from embryonic axes that have been transformed by the bombardment of apical meristems with microparticle-coated DNA. Image is from the protocol by Rech et al. Cover design by Jessica Iannuzzi.
-
No. 3 March 2008
Examples of pre-primitive streak stage chick embryos electroporated with DsRedExpress plasmid DNA (red) or fluorescein-coupled morpholino (green). The image is taken from the protocol provided by Voiculescu et al.
-
No. 2 February 2008
Photograph of the setup used for manual solid-phase peptide synthesis and on-resin peptide derivatization. Image is from the protocol by Sainlos & Imperiali. Cover by Jessica Iannuzzi.
-
No. 1 January 2008
Epifluorescent images of pollen tetrads expressing 3 different fluorescent markers; the type of cross-over event(s) occuring during recombination can be deduced from the segregation patterns of the markers. Image is from the protocol by Berchowitz and Copenhaver. Cover by Jessica Iannuzzi.