
Abstract
The tree of life is one of the most important organizing principles in biology1. Gene surveys suggest the existence of an enormous number of branches2, but even an approximation of the full scale of the tree has remained elusive. Recent depictions of the tree of life have focused either on the nature of deep evolutionary relationships3–5 or on the known, well-classified diversity of life with an emphasis on eukaryotes6. These approaches overlook the dramatic change in our understanding of life's diversity resulting from genomic sampling of previously unexamined environments. New methods to generate genome sequences illuminate the identity of organisms and their metabolic capacities, placing them in community and ecosystem contexts7,8. Here, we use new genomic data from over 1,000 uncultivated and little known organisms, together with published sequences, to infer a dramatically expanded version of the tree of life, with Bacteria, Archaea and Eukarya included. The depiction is both a global overview and a snapshot of the diversity within each major lineage. The results reveal the dominance of bacterial diversification and underline the importance of organisms lacking isolated representatives, with substantial evolution concentrated in a major radiation of such organisms. This tree highlights major lineages currently underrepresented in biogeochemical models and identifies radiations that are probably important for future evolutionary analyses.
Early approaches to describe the tree of life distinguished organisms based on their physical characteristics and metabolic features. Molecular methods dramatically broadened the diversity that could be included in the tree because they circumvented the need for direct observation and experimentation by relying on sequenced genes as markers for lineages. Gene surveys, typically using the small subunit ribosomal RNA (SSU rRNA) gene, provided a remarkable and novel view of the biological world1,9,10, but questions about the structure and extent of diversity remain. Organisms from novel lineages have eluded surveys, because many are invisible to these methods due to sequence divergence relative to the primers commonly used for gene amplification7,11. Furthermore, unusual sequences, including those with unexpected insertions, may be discarded as artefacts7.
Whole genome reconstruction was first accomplished in 1995 (ref. 12), with a near-exponential increase in the number of draft genomes reported each subsequent year. There are 30,437 genomes from all three domains of life—Bacteria, Archaea and Eukarya—which are currently available in the Joint Genome Institute's Integrated Microbial Genomes database (accessed 24 September 2015). Contributing to this expansion in genome numbers are single cell genomics13 and metagenomics studies. Metagenomics is a shotgun sequencing-based method in which DNA isolated directly from the environment is sequenced, and the reconstructed genome fragments are assigned to draft genomes14. New bioinformatics methods yield complete and near-complete genome sequences, without a reliance on cultivation or reference genomes7,15. These genome- (rather than gene) based approaches provide information about metabolic potential and a variety of phylogenetically informative sequences that can be used to classify organisms16. Here, we have constructed a tree of life by making use of genomes from public databases and 1,011 newly reconstructed genomes that we recovered from a variety of environments (see Methods).
To render this tree of life, we aligned and concatenated a set of 16 ribosomal protein sequences from each organism. This approach yields a higher-resolution tree than is obtained from a single gene, such as the widely used 16S rRNA gene16. The use of ribosomal proteins avoids artefacts that would arise from phylogenies constructed using genes with unrelated functions and subject to different evolutionary processes. Another important advantage of the chosen ribosomal proteins is that they tend to be syntenic and co-located in a small genomic region in Bacteria and Archaea, reducing binning errors that could substantially perturb the geometry of the tree. Included in this tree is one representative per genus for all genera for which high-quality draft and complete genomes exist (3,083 organisms in total).
Despite the methodological challenges, we have included representatives of all three domains of life. Our primary focus relates to the status of Bacteria and Archaea, as these organisms have been most difficult to profile using macroscopic approaches, and substantial progress has been made recently with acquisition of new genome sequences7,8,13. The placement of Eukarya relative to Bacteria and Archaea is controversial1,4,5,17,18. Eukaryotes are believed to be evolutionary chimaeras that arose via endosymbiotic fusion, probably involving bacterial and archaeal cells19. Here, we do not attempt to confidently resolve the placement of the Eukarya. We position them using sequences of a subset of their nuclear-encoded ribosomal proteins, an approach that classifies them based on the inheritance of their information systems as opposed to lipid or other cellular structures5.
Figure 1 presents a new view of the tree of life. This is one of a relatively small number of three-domain trees constructed from molecular information so far, and the first comprehensive tree to be published since the development of genome-resolved metagenomics. We highlight all major lineages with genomic representation, most of which are phylum-level branches (see Supplementary Fig. 1 for full bootstrap support values). However, we separately identify the Classes of the Proteobacteria, because the phylum is not monophyletic (for example, the Deltaproteobacteria branch away from the other Proteobacteria, as previously reported2,20).
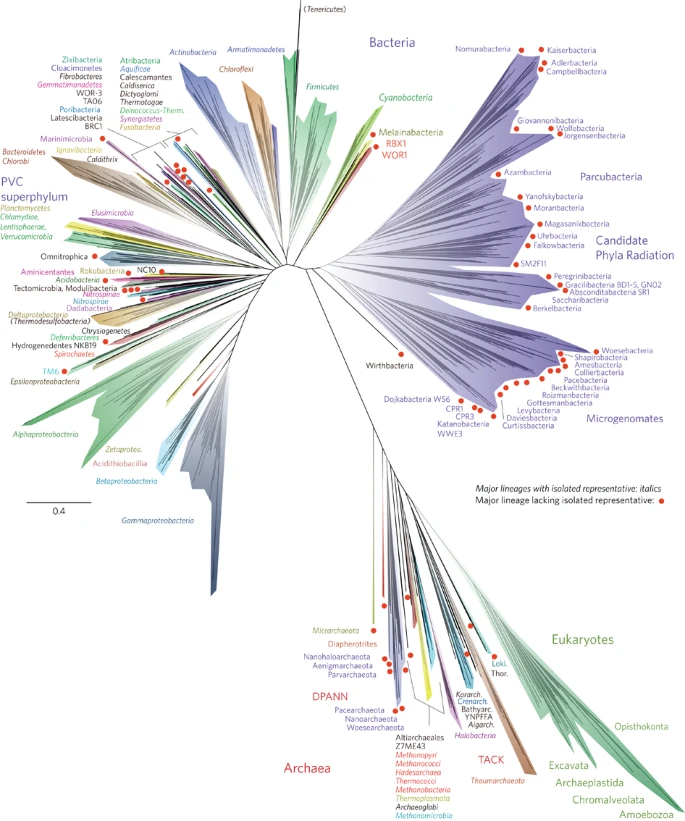
The tree includes 92 named bacterial phyla, 26 archaeal phyla and all five of the Eukaryotic supergroups. Major lineages are assigned arbitrary colours and named, with well-characterized lineage names, in italics. Lineages lacking an isolated representative are highlighted with non-italicized names and red dots. For details on taxon sampling and tree inference, see Methods. The names Tenericutes and Thermodesulfobacteria are bracketed to indicate that these lineages branch within the Firmicutes and the Deltaproteobacteria, respectively. Eukaryotic supergroups are noted, but not otherwise delineated due to the low resolution of these lineages. The CPR phyla are assigned a single colour as they are composed entirely of organisms without isolated representatives, and are still in the process of definition at lower taxonomic levels. The complete ribosomal protein tree is available in rectangular format with full bootstrap values as Supplementary Fig. 1 and in Newick format in Supplementary Dataset 2.
The tree in Fig. 1 recapitulates expected organism groupings at most taxonomic levels and is largely congruent with the tree calculated using traditional SSU rRNA gene sequence information (Supplementary Fig. 2). The support values for taxonomic groups are strong at the Species through Class levels (>85%), with moderate-to-strong support for Phyla (>75% in most cases), but the branching order of the deepest branches cannot be confidently resolved (Supplementary Fig. 1). The lower support for deep branch placements is a consequence of our prioritization of taxon sampling over number of genes used for tree construction. As proposed recently, the Eukarya, a group that includes protists, fungi, plants and animals, branches within the Archaea, specifically within the TACK superphylum21 and sibling to the Lokiarchaeota22. Interestingly, this placement is not evident in the SSU rRNA tree, which has the three-domain topology proposed by Woese and co-workers in 19901 (Supplementary Fig. 2). The two-domain Eocyte tree and the three-domain tree are competing hypotheses for the origin of Eukarya5; further analyses to resolve these and other deep relationships will be strengthened with the availability of genomes for a greater diversity of organisms. Important advantages of the ribosomal protein tree compared with the SSU rRNA gene tree are that it includes organisms with incomplete or unavailable SSU rRNA gene sequences and more strongly resolves the deeper radiations. Ribosomal proteins have been shown to contain compositional biases across the three domains, driven by thermophilic, mesophilic and halophilic lifestyles as well as by a primitive genetic code23. Continued expansion of the number of genome sequences for non-extremophile Archaea, such as the DPANN lineages8,13, may allow clarification of these compositional biases.
A striking feature of this tree is the large number of major lineages without isolated representatives (red dots in Fig. 1). Many of these lineages are clustered together into discrete regions of the tree. Of particular note is the Candidate Phyla Radiation (CPR)7, highlighted in purple in Fig. 1. Based on information available from hundreds of genomes from genome-resolved metagenomics and single-cell genomics methods to date, all members have relatively small genomes and most have somewhat (if not highly) restricted metabolic capacities7,13,24. Many are inferred (and some have been shown) to be symbionts7,25,26. Thus far, all cells lack complete citric acid cycles and respiratory chains and most have limited or no ability to synthesize nucleotides and amino acids. It remains unclear whether these reduced metabolisms are a consequence of superphylum-wide loss of capacities or if these are inherited characteristics that hint at an early metabolic platform for life. If inherited, then adoption of symbiotic lifestyles may have been a later innovation by these organisms once more complex organisms appeared.
Figure 2 presents another perspective, where the major lineages of the tree are defined using evolutionary distance, so that the main groups become apparent without bias arising from historical naming conventions. This depiction uses the same inferred tree as in Fig. 1, but with groups defined on the basis of average branch length to the leaf taxa. We chose an average branch length that best recapitulated the current taxonomy (smaller values fragmented many currently accepted phyla and larger values collapsed accepted phyla into very few lineages, see Methods). Evident in Fig. 2 is the enormous extent of evolution that has occurred within the CPR. The diversity within the CPR could be a result of the early emergence of this group and/or a consequence of rapid evolution related to symbiotic lifestyles. The CPR is early-emerging on the ribosomal protein tree (Fig. 1), but not in the SSU rRNA tree (Supplementary Fig. 2). Regardless of branching order, the CPR, in combination with other lineages that lack isolated representatives (red dots in Fig. 2), clearly comprises the majority of life's current diversity.

The threshold for groups (coloured wedges) was an average branch length of <0.65 substitutions per site. Notably, some well-accepted phyla become single groups and others are split into multiple distinct groups. We undertook this analysis to provide perspective on the structure of the tree, and do not propose the resulting groups to have special taxonomic status. The massive scale of diversity in the CPR and the large fraction of major lineages that lack isolated representatives (red dots) are apparent from this analysis. Bootstrap support values are indicated by circles on nodes—black for support of 85% and above, grey for support from 50 to 84%. The complete ribosomal protein tree is available in rectangular format with full bootstrap values as Supplementary Fig. 1 and in Newick format in Supplementary Dataset 2.
Domain Bacteria includes more major lineages of organisms than the other Domains. We do not attribute the smaller scope of the Archaea relative to Bacteria to sampling bias because metagenomics and single-cell genomics methods detect members of both domains equally well. Consistent with this view, Archaea are less prominent and less diverse in many ecosystems (for example, seawater27, hydrothermal vents28, the terrestrial subsurface15 and human-associated microbiomes29). The lower apparent phylogenetic diversity of Eukarya is fully expected, based on their comparatively recent evolution.
The tree of life as we know it has dramatically expanded due to new genomic sampling of previously enigmatic or unknown microbial lineages. This depiction of the tree captures the current genomic sampling of life, illustrating the progress that has been made in the last two decades following the first published genome. What emerges from analysis of this tree is the depth of evolutionary history that is contained within the Bacteria, in part due to the CPR, which appears to subdivide the domain. Most importantly, the analysis highlights the large fraction of diversity that is currently only accessible via cultivation-independent genome-resolved approaches.
Methods
A data set comprehensively covering the three domains of life was generated using publicly available genomes from the Joint Genome Institute's IMG-M database (img.jgi.doe.gov), a previously developed data set of eukaryotic genome information30, previously published genomes derived from metagenomic data sets7,8,31,32 and newly reconstructed genomes from current metagenome projects (see Supplementary Table 1 for NCBI accession numbers). From IMG-M, genomes were sampled such that a single representative for each defined genus was selected. For phyla and candidate phyla lacking full taxonomic definition, every member of the phylum was initially included. Subsequently, these radiations were sampled to an approximate genus level of divergence based on comparison with taxonomically described phyla, thus removing strain- and species-level overlaps. Finally, initial tree reconstructions identified aberrant long-branch attraction effects placing the Microsporidia, a group of parasitic fungi, with the Korarchaeota. The Microsporidia are known to contribute long branch attraction artefacts confounding placement of the Eukarya33, and were subsequently removed from the analysis.
This study includes 1,011 organisms from lineages for which genomes were not previously available. The organisms were present in samples collected from a shallow aquifer system, a deep subsurface research site in Japan, a salt crust in the Atacama Desert, grassland meadow soil in northern California, a CO2-rich geyser system, and two dolphin mouths. Genomes were reconstructed from metagenomes as described previously7. Genomes were only included if they were estimated to be >70% complete based on presence/absence of a suite of 51 single copy genes for Bacteria and 38 single copy genes for Archaea. Genomes were additionally required to have consistent nucleotide composition and coverage across scaffolds, as determined using the ggkbase binning software (ggkbase.berkeley.edu), and to show consistent placement across both SSU rRNA and concatenated ribosomal protein phylogenies. This contributed marker gene information for 1,011 newly sampled organisms, whose genomes were reconstructed for metabolic analyses to be published separately.
The concatenated ribosomal protein alignment was constructed as described previously16. In brief, the 16 ribosomal protein data sets (ribosomal proteins L2, L3, L4, L5, L6, L14, L16, L18, L22, L24, S3, S8, S10, S17 and S19) were aligned independently using MUSCLE v. 3.8.31 (ref. 34). Alignments were trimmed to remove ambiguously aligned C and N termini as well as columns composed of more than 95% gaps. Taxa were removed if their available sequence data represented less than 50% of the expected alignment columns (90% of taxa had more than 80% of the expected alignment columns). The 16 alignments were concatenated, forming a final alignment comprising 3,083 genomes and 2,596 amino-acid positions. A maximum likelihood tree was constructed using RAxML v. 8.1.24 (ref. 35), as implemented on the CIPRES web server36, under the LG plus gamma model of evolution (PROTGAMMALG in the RAxML model section), and with the number of bootstraps automatically determined (MRE-based bootstopping criterion). A total of 156 bootstrap replicates were conducted under the rapid bootstrapping algorithm, with 100 sampled to generate proportional support values. The full tree inference required 3,840 computational hours on the CIPRES supercomputer.
To construct Fig. 2, we collapsed branches based on an average branch length criterion. Average branch length calculations were implemented in the Interactive Tree of Life online interface37 using the formula:
Average branch length=mean([root distance to tip]–[root distance to node]) for all tips connecting to a node.
We tested values between 0.25 and 0.75 at 0.05 intervals, and selected a final threshold of <0.65 based on generation of a similar number of major lineages as compared to the taxonomy-guided clustering view in Fig. 1. The taxonomy view identified 26 archaeal and 74 bacterial phylum-level lineages (counting the Microgenomates and Parcubacteria as single phyla each), whereas an average branch length of <0.65 resulted in 28 archaeal and 76 bacterial clades.
For a companion SSU rRNA tree, an alignment was generated from all SSU rRNA genes available from the genomes of the organisms included in the ribosomal protein data set. For organisms with multiple SSU rRNA genes, one representative gene was kept for the analysis, selected randomly. As genome sampling was confined to the genus level, we do not anticipate this selection process will have any impact on the resultant tree. All SSU rRNA genes longer than 600 bp were aligned using the SINA alignment algorithm through the SILVA web interface38,39. The full alignment was stripped of columns containing 95% or more gaps, generating a final alignment containing 1,871 taxa and 1,947 alignment positions. A maximum likelihood tree was inferred as described for the concatenated ribosomal protein trees, with RAxML run using the GTRCAT model of evolution. The RAxML inference included the calculation of 300 bootstrap iterations (extended majority rules-based bootstopping criterion), with 100 randomly sampled to determine support values.
To test the effect of site selection stringency on the inferred phylogenies, we stripped the alignments of columns containing up to 50% gaps (compared with the original trimming of 95% gaps). For the ribosomal protein alignment, this resulted in a 14% reduction in alignment length (to 2,232 positions) and a 44.6% reduction in computational time (∼2,100 h). For the SSU rRNA gene alignment, stripping columns with 50% or greater gaps reduced the alignment by 24% (to 1,489 positions) and the computation time by 28%. In both cases, the topology of the tree with the best likelihood was not changed significantly. The ribosomal protein resolved a two-domain tree with the Eukarya sibling to the Lokiarcheaota, while the SSU rRNA tree depicts a three-domain tree. The position of the CPR as deep-branching on the ribosomal protein tree and within the Bacteria on the SSU rRNA tree was also consistent. The alignments and inferred trees under the more stringent gap stripping are available upon request.
Nomenclature
We have included names for two lineages for which we have previously published complete genomes40. At the time of submission of the paper describing these genomes40, the reviewer community was not uniformly open to naming lineages of uncultivated organisms based on such information. Given that this practice is now widely used, we re-propose the names for these phyla. Specifically, for WWE3 we suggest the name Katanobacteria from the Hebrew ‘katan’, which means ‘small’, and for SR1 we suggest the name Absconditabacteria from the Latin ‘Abscondo’ meaning ‘hidden’, as in ‘shrouded’.
Accession codes
NCBI and/or JGI IMG accession numbers for all genomes used in this study are listed in Supplementary Table 1. Additional ribosomal protein gene and 16S rRNA gene sequences used in this study have been deposited in Genbank under accession numbers KU868081–KU869521. The concatenated ribosomal protein and SSU rRNA alignments used for tree reconstruction are included as separate files in the Supplementary Information.
References
Woese, C. R., Kandler, O. & Wheelis, M. L. Towards a natural system of organisms: proposal for the domains Archaea, Bacteria, and Eucarya. Proc. Natl Acad. Sci. USA 87, 4576–4579 (1990).
Yarza, P. et al. Uniting the classification of cultured and uncultured bacteria and archaea using 16S rRNA gene sequences. Nature Rev. Microbiol. 12, 635–645 (2014).
Gouy, R., Baurain, D. & Philippe, H. Rooting the tree of life: the phylogenetic jury is still out. Phil. Trans. R. Soc. Lond. B Biol. Sci. 370, 20140329 (2015).
Pace, N. R. Time for a change. Nature 441, 289 (2006).
Williams, T. A., Foster, P. G., Cox, C. J. & Embley, T. M. An archaeal origin of eukaryotes supports only two primary domains of life. Nature 504, 231–236 (2013).
Hinchliff, C. E. et al. Synthesis of phylogeny and taxonomy into a comprehensive tree of life. Proc. Natl Acad. Sci. USA 112, 12764–12769 (2015).
Brown, C. T. et al. Unusual biology across a group comprising more than 15% of domain Bacteria. Nature 523, 208–211 (2015).
Castelle, C. J. et al. Genomic expansion of domain archaea highlights roles for organisms from new phyla in anaerobic carbon cycling. Curr. Biol. 25, 690–701 (2015).
Pace, N. R. Mapping the tree of life: progress and prospects. Microbiol. Mol. Biol. Rev. 73, 565–576 (2009).
Lane, D. J. et al. Rapid determination of 16S ribosomal RNA sequences for phylogenetic analyses. Proc. Natl Acad. Sci. USA 82, 6955–6959 (1985).
Klindworth, A. et al. Evaluation of general 16S ribosomal RNA gene PCR primers for classical and next-generation sequencing-based diversity studies. Nucleic Acids Res. 41, e1 (2013).
Fleischmann, R. et al. Whole-genome random sequencing and assembly of Haemophilus influenzae Rd. Science 269, 496–512 (1995).
Rinke, C. et al. Insights into the phylogeny and coding potential of microbial dark matter. Nature 499, 431–437 (2013).
Dick, G. J. et al. Community-wide analysis of microbial genome sequence signatures. Genome Biol. 10, R85 (2009).
Castelle, C. J. et al. Extraordinary phylogenetic diversity and metabolic versatility in aquifer sediment. Nature Commun. 4, 2120 (2013).
Hug, L. A. et al. Community genomic analyses constrain the distribution of metabolic traits across the Chloroflexi phylum and indicate roles in sediment carbon cycling. Microbiome 1, 22 (2013).
Cox, C. J., Foster, P. G., Hirt, R. P., Harris, S. R. & Embley, T. M. The archaebacterial origin of eukaryotes. Proc. Natl Acad. Sci. USA 105, 20356–20361 (2008).
Lake, J. A., Henderson, E., Oakes, M. & Clark, M. W. Eocytes: a new ribosome structure indicates a kingdom with a close relationship to eukaryotes. Proc. Natl Acad. Sci. USA 81, 3786–3790 (1984).
Martin, W. F., Garg, S. & Zimorski, V. Endosymbiotic theories for eukaryote origin. Phil. Trans. R. Soc. B Biol. Sci. 370, 20140330 (2015).
Garrity, G., Boone, D. R. & Castenholtz, R. W. (eds) Bergey's Manual of Systematic Bacteriology. Volume One: The Archaea and the Deeply Branching and Phototrophic Bacteria 2nd edn (Springer, 2001).
Guy, L. & Ettema, T. J. G. The archaeal ‘TACK’ superphylum and the origin of eukaryotes. Trends Microbiol. 19, 580–587 (2011).
Spang, A. et al. Complex archaea that bridge the gap between prokaryotes and eukaryotes. Nature 521, 173–179 (2015).
Fournier, G. P. & Gogarten, J. P. Rooting the ribosomal tree of life. Mol. Biol. Evol. 27, 1792–1801 (2010).
Wrighton, K. C. et al. Fermentation, hydrogen, and sulfur metabolism in multiple uncultivated bacterial phyla. Science 337, 1661–1665 (2012).
He, X. et al. Cultivation of a human-associated TM7 phylotype reveals a reduced genome and epibiotic parasitic lifestyle. Proc. Natl Acad. Sci. USA 112, 244–249 (2015).
Nelson, W. C. & Stegen, J. C. The reduced genomes of Parcubacteria (OD1) contain signatures of a symbiotic lifestyle. Front. Microbiol. 6, 713 (2015).
Lloyd, K. G., May, M. K., Kevorkian, R. T. & Steen, A. D. Meta-analysis of quantification methods shows that archaea and bacteria have similar abundances in the subseafloor. Appl. Environ. Microbiol. 79, 7790–7799 (2013).
Sievert, S. M., Ziebis, W., Kuever, J. & Sahm, K. Relative abundance of Archaea and Bacteria along a thermal gradient of a shallow-water hydrothermal vent quantified by rRNA slot-blot hybridization. Microbiology 146, 1287–1293 (2000).
Hoffmann, C. et al. Archaea and fungi of the human gut microbiome: correlations with diet and bacterial residents. PLoS ONE 8, e66019 (2013).
Brown, M. W. et al. Phylogenomics demonstrates that breviate flagellates are related to opisthokonts and apusomonads. Proc. Biol. Sci. 280, 20131755 (2013).
Hug, L. A. et al. Critical biogeochemical functions in the subsurface are associated with bacteria from new phyla and little studied lineages. Environ. Microbiol. 18, 159–173 (2016).
Baker, B. J., Lazar, C. S., Teske, A. P. & Dick, G. J. Genomic resolution of linkages in carbon, nitrogen, and sulfur cycling among widespread estuary sediment bacteria. Microbiome 3, 14 (2015).
Inagaki, Y., Susko, E., Fast, N. M. & Roger, A. J. Covarion shifts cause a long-branch attraction artifact that unites microsporidia and archaebacteria in EF-1alpha phylogenies. Mol. Biol. Evol. 21, 1340–1349 (2004).
Edgar, R. C. MUSCLE: multiple sequence alignment with high accuracy and high throughput. Nucleic Acids Res. 32, 1792–1797 (2004).
Stamatakis, A. RAxML-VI-HPC: maximum likelihood-based phylogenetic analyses with thousands of taxa and mixed models. Bioinformatics 22, 2688–2690 (2006).
Miller, M., Pfeiffer, W. & Schwartz, T. Creating the CIPRES Science Gateway for inference of large phylogenetic trees. Gatew. Comput. Environ. Work 1–8 (2010).
Letunic, I. & Bork, P. Interactive Tree Of Life v2: online annotation and display of phylogenetic trees made easy. Nucleic Acids Res. 39, W475–W478 (2011).
Pruesse, E., Peplies, J. & Glöckner, F. O. SINA: accurate high-throughput multiple sequence alignment of ribosomal RNA genes. Bioinformatics 28, 1823–1829 (2012).
Pruesse, E. et al. SILVA: a comprehensive online resource for quality checked and aligned ribosomal RNA sequence data compatible with ARB. Nucleic Acids Res. 35, 7188–7196 (2007).
Kantor, R. S. et al. Small genomes and sparse metabolisms of sediment-associated bacteria from four candidate phyla. MBio 4, e00708–13 (2013).
Acknowledgements
This research was largely supported by the Lawrence Berkeley National Laboratory (LBNL) Genomes to Watershed Scientific Focus Area funded by the US Department of Energy (DOE), Office of Science, Office of Biological and Environmental Research (OBER) under contract no. DE-AC02-05CH11231. Additional support was provided by LBNL EFRC award no. DE-AC02-05CH11231, NASA NESSF grant no. 12-PLANET12R-0025 and NSF DEB grant no. 1406956, DOE OBER grant no. DOE-SC10010566, Office of Naval Research grants nos. N00014-07-1-0287, N00014-10-1-0233 and N00014-11-1-0918, and by the Thomas C. and Joan M. Merigan Endowment at Stanford University. In addition, funding was provided by the Ministry of Economy, Trade and Industry of Japan. The authors thank J. Eisen for comments, S. Venn-Watson, K. Carlin and E. Jensen (US Navy Marine Mammal Program) for dolphin samples, K.W. Seitz for sequence submission assistance, and the DOE Joint Genome Institute for generating the metagenome sequence via the Community Science Program.
Author information
Authors and Affiliations
Contributions
L.A.H. and J.F.B. defined the research objective. L.A.H. generated data sets and conducted phylogenetic tree inferences. L.A.H., B.J.B. and J.F.B. conducted data analysis. L.A.H., B.J.B., K.A., C.T.B., A.J.P., C.J.C., C.N.B., A.W.H., Y.A., K.I., Y.S., N.D., D.A.R., K.M.F., R.A., B.C.T. and J.F.B. contributed to metagenome binning and genome analysis. L.A.H. and J.F.B. wrote the manuscript with input from all authors. All authors read and approved the final manuscript.
Corresponding author
Ethics declarations
Competing interests
The authors declare no competing financial interests.
Supplementary information
Supplementary information
Legends for Supplementary Figures 1 and 2, Table 1 and Datasets 1-4. (PDF 170 kb)
Supplementary Figure 1
Full rectangular view of the concatenated ribosomal protein tree presented in Figure 1, with major lineages colored as in the main text Figure 1. Organisms are named with all relevant taxonomic ranks. Bootstrap support values above 50 are displayed on the nodes. This concatenated ribosomal protein tree is available in newick format as Supplementary Dataset 2. (PDF 559 kb)
Supplementary Figure 2
Condensed maximum likelihood tree based on an alignment of SSU rRNA gene sequences. Major lineages are collapsed and labeled as in Figure 1, with well-defined lineages named using italic font and lineages lacking an isolated representative named in regular font and highlighted with red dots. Bootstrap support values are indicated by circles on nodes - black for support of 85% and above, grey for support from 50% to 84%. The full SSU rRNA gene tree is available in newick format as Supplementary Dataset 4. (PDF 431 kb)
Supplementary Table 1
Accession numbers for all genomes included in this study. Genomes were mined for bacterial-type (P-type) ribosomal proteins L2, L3, L4, L5, L6, L14, L15, L16, L18, L22, L24, S3, S8, S10, S17, and S19 (all single-copy genes), and one representative SSU rRNA gene. (TXT 327 kb)
Supplementary Dataset 1
Concatenated ribosomal protein alignment used for inferring tree in main text Figures 1 and 2, as well as Supplementary Figure 1, in fasta format. (TXT 8103 kb)
Supplementary Dataset 2
Maximum likelihood tree based on concatenated ribosomal protein alignment (Supplementary Dataset 1), basis for main text Figures 1 and 2, and Supplementary Figure 1, in newick format. (TXT 367 kb)
Supplementary Dataset 3
SSU rRNA alignment used for inferring tree in Supplementary Figure 2, in fasta format. (TXT 3751 kb)
Supplementary Dataset 4
Maximum likelihood tree based on SSU rRNA alignment (Supplementary Dataset 3), basis for Supplementary Figure 2, in newick format. (TXT 285 kb)
Rights and permissions
This work is licensed under a Creative Commons Attribution 4.0 International License. The images or other third party material in this article are included in the article's Creative Commons license, unless indicated otherwise in the credit line; if the material is not included under the Creative Commons license, users will need to obtain permission from the license holder to reproduce the material. To view a copy of this license, visit http://creativecommons.org/licenses/by/4.0/
About this article

Cite this article
Hug, L., Baker, B., Anantharaman, K. et al. A new view of the tree of life. Nat Microbiol 1, 16048 (2016). https://doi.org/10.1038/nmicrobiol.2016.48
Received:
Accepted:
Published:
DOI: https://doi.org/10.1038/nmicrobiol.2016.48
This article is cited by
-
Unraveling the phylogenomic diversity of Methanomassiliicoccales and implications for mitigating ruminant methane emissions
Genome Biology (2024)
-
The oral microbiome: diversity, biogeography and human health
Nature Reviews Microbiology (2024)
-
Integron cassettes integrate into bacterial genomes via widespread non-classical attG sites
Nature Microbiology (2024)
-
Disentangling direct vs indirect effects of microbiome manipulations in a habitat-forming marine holobiont
npj Biofilms and Microbiomes (2024)
-
Ranked Subtree Prune and Regraft
Bulletin of Mathematical Biology (2024)
