
Abstract
Different thermal environments impose strong, differential selection on populations, leading to local adaptation, but the genetic basis of thermal adaptation is poorly understood. We used quantitative trait locus (QTL) mapping in the fungal wheat pathogen Zymoseptoria tritici to study the genetic architecture of thermal adaptation and identify candidate genes. Four wild-type strains originating from the same thermal environment were crossed to generate two mapping populations with 263 (cross 1) and 261 (cross 2) progeny. Restriction site-associated DNA sequencing was used to genotype 9745 (cross 1) and 7333 (cross 2) single-nucleotide polymorphism markers segregating within the mapping population. Temperature sensitivity was assessed using digital image analysis of colonies growing at two different temperatures. We identified four QTLs for temperature sensitivity, with unique QTLs found in each cross. One QTL had a logarithm of odds score >11 and contained only six candidate genes, including PBS2, encoding a mitogen-activated protein kinase kinase associated with low temperature tolerance in Saccharomyces cerevisiae. This and other QTLs showed evidence for pleiotropy among growth rate, melanization and growth morphology, suggesting that many traits can be correlated with thermal adaptation in fungi. Higher temperatures were highly correlated with a shift to filamentous growth among the progeny in both crosses. We show that thermal adaptation has a complex genetic architecture, with natural populations of Z. tritici harboring significant genetic variation for this trait. We conclude that Z. tritici populations have the potential to adapt rapidly to climate change and expand into new climatic zones.
Introduction
Temperature has a strong effect on many life history traits, including growth, development and reproduction (Angilletta et al., 2006; de Jong and van der Have, 2009). This is especially true for ectotherms, such as fungi, whose internal temperature directly reflects the surrounding environment (Angilletta et al., 2002). Two general strategies for adapting to different thermal environments are phenotypic plasticity and genetic differentiation (Dybdahl and Kane, 2005; Knies et al., 2006; Yamori et al., 2010). Phenotypic plasticity is an individual-based response that allows the same genotype to produce different phenotypes in different environments (de Jong and van der Have, 2009). Genetic differentiation is a population-based response where individuals carrying different alleles are selected according to the local environment. Over generations, selection pressure for different temperature optima can lead to changes in the genetic architecture of temperature adaptation. For example, nonsynonymous substitutions can generate protein isoforms that differ for thermal stability and/or optimized function at different temperatures (Schoville et al., 2012). In a population, genetic diversity for thermal adaptation can be maintained by antagonistic pleiotropy (genetic trade-offs), in which an allele that has optimal function at one temperature exhibits maladaptation at a different temperature (Fields, 2001). A better understanding of the genetic basis of thermal adaptation is likely to provide insight into the ability of species to adapt to global climate change (Austin, 2007).
Thermal adaptation is important for many plant pathogenic fungi. Before 2000, the wheat stripe rust pathogen Puccinia striiformis f. sp. tritici caused epidemics only in cooler wheat-growing regions. After 2000, two new clonal lineages of the pathogen able to cause epidemics in warmer climates emerged, allowing the pathogen to expand into previously unfavorable environments (Milus et al., 2009; Mboup et al., 2012). In the globally distributed barley pathogen Rhynchosporium commune, there was evidence for local adaptation to grow at higher temperatures (22 °C), a key adaptation that may have enabled the global emergence of a pathogen that originated in the cold climate of Scandinavia (Zaffarano et al., 2006; Linde et al., 2009; Stefansson et al., 2013).
In some cases, pathogenic fungi grow saprophytically as filamentous hyphae outside their host, and then undergo a morphological transformation to yeast-like growth after infecting their host. These morphological switches enhance pathogenicity by facilitating dispersal within the host and enabling evasion of host immune responses (Nadal et al., 2008; Gauthier, 2015). In other cases, the switch is in the opposite direction, which is mainly the case for plant pathogens (e.g. Ustilago maydis), where yeast-like growth is observed outside the host and filamentous growth is observed within the host. For some fungal pathogens (e.g. Talaromyces marneffei; Boyce and Andrianopoulos, 2013), a change in temperature triggers a switch in growth morphology (Gauthier, 2015).
Fungi use several mechanisms to cope with changing temperatures, including the induction or upregulation of proteins related to thermal stress (e.g. heat-shock proteins (HSPs); Feder and Hofmann, 1999), changes in cellular composition (e.g. activation of the high-osmolarity glycerol (HOG) pathway resulting in glycerol accumulation in cells; Panadero et al., 2006) and adjustments in membrane fluidity (e.g. lipid saturation in cell membranes; Leach and Cowen, 2014). Little is known regarding the genetic basis of how fungi tolerate different temperatures. The majority of research on this topic has been conducted in yeasts and is oriented around the regulation of HSPs (Feder and Hofmann, 1999; Leach and Cowen, 2014). HSPs are regulated through the heat-shock transcription factor 1, which has been extensively studied in Saccharomyces cerevisiae (Sorger and Pelham, 1988; Nicholls et al., 2009). Quantitative trait locus (QTL) mapping of high-temperature growth in the progeny of a cross between a heat-tolerant clinical strain of S. cerevisiae and a heat-sensitive strain isolated from a rotting fig identified four linked genes involved in high-temperature growth, but none of these genes had a function known to affect thermal adaptation (Steinmetz et al., 2002; Sinha et al., 2008). A bulk segregant analysis applied to yeast populations (Ehrenreich et al., 2010) identified 21 QTLs associated with high-temperature growth in a cross of a heat-tolerant North American oak tree strain and a heat-sensitive West African palm wine strain (Parts et al., 2011). A transcriptome analysis of 48 Neurospora crassa isolates from subtropical and tropical environments identified two genes involved in thermal adaptation, including an MRH4-like RNA helicase (Ellison et al., 2011). Despite the progress illustrated by these studies, many gaps remain in our understanding of the genetic mechanisms underlying thermal adaptation in fungi (Robert et al., 2015) and other organisms.
Zymoseptoria tritici (syn Mycosphaerella graminicola) is the fungal pathogen causing Septoria tritici blotch, currently the most damaging wheat disease in Europe (Jorgensen et al., 2014; O’Driscoll et al., 2014). The 39.7 Mb reference genome is among the best-assembled fungal genomes available. It contains ~11 000 predicted genes distributed across 21 chromosomes sequenced from telomere to telomere, with an average of ~21% repetitive DNA (Goodwin et al., 2011). Z. tritici is a dimorphic fungus than can grow either as filamentous hyphae or yeast-like budding cells when grown in vitro (Nadal et al., 2008). The pathogen is found in wheat-growing areas worldwide covering a wide range of temperature regimens (Eyal et al., 1987; Zhan and McDonald, 2011; Jorgensen et al., 2014; O’Driscoll et al., 2014). An earlier study that included 138 Z. tritici strains sampled from diverse thermal environments on three continents found evidence for thermal adaptation and concluded that most of the thermal adaptation was due to genetic differentiation rather than phenotypic plasticity (Zhan and McDonald, 2011). Here, we sought to determine the genetic architecture of thermal adaptation and identify candidate genes based on QTL mapping of temperature sensitivity (TS) in wild-type strains sampled from the same thermal environment. This approach allowed us to identify and characterize genetic polymorphisms segregating within natural populations (Franks and Hoffmann, 2012; Robert et al., 2015). Knowledge about co-occurring genetic variants conferring different levels of thermal adaptation allows us to predict how a population will be able to adapt to climate change. To determine the genetic architecture of thermal adaptation in Z. tritici, we used restriction site-associated DNA sequencing (RADseq) for genotyping, coupled with high-throughput digital image analysis to measure growth rates under two temperatures (15 and 22 °C). We used QTL mapping to determine the genetic architecture of natural variation for TS and identify QTLs and their associated chromosomal segments. Comparisons of complete genome sequences of the parental isolates allowed us to identify polymorphisms in candidate genes for thermal adaptation.
Materials and methods
Mapping population, genotyping, genetic mapping and gene expression
Methods used for genetic mapping and gene expression were described earlier (Brunner et al., 2013; Lendenmann et al., 2014, 2015). Briefly, four Swiss wild-type strains were used to create two mapping populations, following an established protocol (Kema et al., 1996). The mapping populations were composed of 263 (ST99CH3D1 (3D1: SRS383146) × ST99CH3D7 (3D7: SRS383147)) and 261 (ST99CH1A5 (1A5: SRS383142) × ST99CH1E4 (1E4: SRS383143)) retained progeny. BioProject numbers PRJNA256988 and PRJNA256991 contain the NCBI Short Read Archive accession numbers for the retained progeny of crosses 3D1 × 3D7 and 1A5 × 1E4, respectively. RADseq (Baird et al., 2008) generated more than 7000 single-nucleotide polymorphism (SNP) markers for each cross. Resequencing of all four parents (Croll et al., 2013) allowed identification of the retained RADseq SNPs in the parents and candidate genes responsible for the observed QTLs. R/qtl version 1.27-10 (Arends et al., 2010) was used to construct two dense genetic maps (Lendenmann et al., 2014). Candidate genes within QTL confidence intervals were characterized for their transcriptional profile, using RNA-Seq data from an in planta virulence time-course assay (Brunner et al., 2013).
Phenotyping
Radial growth rates (mm per day) (Trinci, 1971; Lendenmann et al., 2015) of single spore colonies grown at two temperatures (15 and 22 °C) and observed over three time points (8, 11 and 14 days post inoculation (dpi)) were used to calculate TS. Plate inoculation procedures and digital image analyses in ImageJ (Schneider et al., 2012) were described earlier (Lendenmann et al., 2014). Isolates were grown in Petri plates on potato dextrose agar (4 g l−1 potato starch, 20 g l−1 dextrose, 15 g l−1 agar) and placed at a constant temperature of 15 or 22 °C with 70% humidity in the dark. TS for each isolate was calculated as the radial growth rate at 22 °C divided by the radial growth rate at 15 °C. Two absolute value traits (radial growth rate at 15 and 22 °C) and one relative value trait (relative growth rate coefficient=TS) were calculated for each isolate and used for QTL analysis. The 22 °C growth rate trait of this study was called growth rate (fungicide absent) in an earlier investigation mapping QTLs involved in fungicide sensitivity (Lendenmann et al., 2015).
In addition to growth rate, two growth morphologies were scored for each strain. Although Z. tritici is considered a filamentous fungus that grows mainly as hyphae, a yeast-like morphology is often observed in culture on rich media, suggesting that Z. tritici is dimorphic (Mehrabi and Kema, 2006; Mehrabi et al., 2006b; Nadal et al., 2008). To determine if the yeast/hyphae dimorphism can be mapped, we conducted a visual inspection of the digital images to classify the colonies of each isolate as either hyphal- or yeast-like. Three people (ML, JP and ES) independently classified each isolate using all five technical replicates at 11 dpi for both temperatures. The scoring day of 11 dpi was chosen because the colonies were too small to make an accurate visual scoring at 8 dpi, while classifications at 14 dpi gave the same result. Progeny that exhibited only yeast-like colonies were scored as ‘0’, whereas progeny exhibiting at least two hyphal colonies on a Petri dish were scored as ‘1’ (Supplementary Figure S1). Only progeny with identical classifications from all three scorers were included in this analysis. At 15 °C, >98% of the progeny with a consensus score in cross 1A5 × 1E4 grew with a yeast-like morphology (binary value ‘0’: 247 progeny/binary value ‘1’: 3 progeny), hence this treatment was not included in the analysis. The binary counts were as follows: cross 3D1 × 3D7 at 22 °C binary value ‘0’: 111 progeny/binary value ‘1’: 90 progeny; at 15 °C binary value ‘0’: 186 progeny/binary value ‘1’: 52 progeny; cross 1A5 × 1E4 at 22 °C binary value ‘0’: 104 progeny/binary value ‘1’: 33 progeny.
Absolute and relative phenotypes as well as the yeast/hyphae scores for the retained progeny of each cross are available from the Dryad Digital Repository: http://dx.doi.org/10.5061/dryad.cj432.
QTL mapping
Simple interval mapping (SIM) was used for QTL analysis performed in R/qtl version 1.27-10 (Arends et al., 2010) using R (R_Core_Team, 2012). A binary model was applied for the yeast/hyphae dimorphism phenotype. A total of 1000 genome-wide permutations were used to calculate the significant logarithm of odds (LOD) threshold. Further analyses considered only QTLs that showed P-values <0.05. Bayesian credible intervals (Manichaikul et al., 2006) were used to calculate 95% confidence intervals for each QTL. Genetic positions (centiMorgans, cM) of markers were converted into physical positions (base pair, bp) by using the reference IPO323 genome (Goodwin et al., 2011). QTLs were assumed to be different if their confidence intervals did not overlap. More detailed information on methods used for QTL mapping were described earlier (Lendenmann et al., 2014).
Single spore colonies were also scored for their degree of melanization (Lendenmann et al., 2014). Because melanin has been associated with protection against extreme temperatures as well as fungicide resistance (Butler and Day, 1998; Nosanchuk and Casadevall, 2006; Taborda et al., 2008), we investigated pleiotropy among the growth rate traits, TS and melanization (11 dpi), and also looked for evidence of pleiotropic effects among temperature and fungicide sensitivity. This analysis was conducted by overlapping full SIM genome scans and using linear regression among the traits based on a general linear model in R with Pearson’s correlation coefficient. Regression analysis between the yeast/hyphae dimorphism and growth rate at each temperature was conducted using a one-way analysis of variance to calculate the phenotypic variance explained by the yeast/hyphae dimorphism phenotypes upon growth rate. A t-test was used to compare mean differences between the two morphologies in R. Marker allele effects were calculated using R/qtl to confirm the linear regressions.
Identification of candidate genes within QTL confidence intervals
Resequenced parents of each cross were aligned against the IPO323 reference genome, and sequence variants were called and annotated using the open-source tools SnpEff and SnpSift version 3.3 h (Cingolani et al., 2012). Synonymous SNPs were omitted from any further investigation. A gene was considered a candidate for explaining the QTL if it contained at least one sequence variant within the boundaries of the 95% confidence interval. More details regarding methods used to identify candidate genes within QTL confidence intervals were provided earlier (Lendenmann et al., 2014). Because heat-shock proteins have an important role in maintaining cellular functions under thermal stress (Feder and Hofmann, 1999), a hypergeometric test was used to determine whether there was a significant enrichment of proteins with an InterPro domain classified as HSPs within the QTL 95% confidence intervals (Tables 1 and 2). The QTL confidence intervals (Tables 1 and 2) were also investigated for the presence of HSPs as candidate genes.
Results
Genetic architecture of TS
The general linear model of growth rate based on radial development of colonies over time provided an average fit (r2) >98% across both crosses and treatments (Supplementary Figure S2), justifying the method used to measure growth rate for each isolate. The growth rate and TS phenotypes showed a continuous distribution consistent with a quantitative trait in both crosses. Transgressive segregation was found for all traits, with many progeny showing more extreme phenotypes than their parents (Figure 1). The high broad-sense heritability (H2>80%) found for average colony area indicates a low environmental variance among the five technical repeats (Supplementary Figure S2).

The distributions of growth rate and TS in both crosses. Positions of the parental phenotypes within each distribution are indicated by white dashed lines with corresponding parental names above their phenotypes.
For the TS phenotype, one significant QTL was found in cross 3D1 × 3D7 and three were found in cross 1A5 × 1E4. These four QTLs were on chromosomes 1, 2, 4 and 10 with LOD values ranging from 4.3 to 11.8 (Figures 2 and 3 and Tables 1 and 2). For the absolute value phenotypes, cross 3D1 × 3D7 had four growth rate QTLs on chromosomes 2, 3, 7 and 11 and cross 1A5 × 1E4 had two growth rate QTLs on chromosomes 5 and 8 (Tables 1 and 2). There was a confidence interval overlap between the two crosses for the QTLs on chromosome 2, suggesting a shared QTL. This QTL overlap was already described in a previous study (Lendenmann et al., 2015). On average, ~30% of total variance was explained by the significant QTLs for each trait in both crosses (Table 3). No significant QTLs were mapped on the accessory chromosomes 14–21. Detailed information for every mapped QTL can be found in Supplementary Tables S1 and S2.
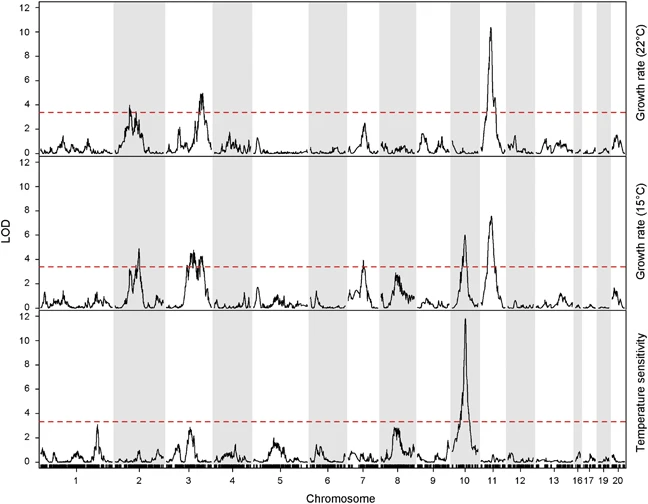
LOD plots from SIM analysis over all chromosomes for growth rate at 15 and 22 °C, as well as TS for cross 3D1 × 3D7. The dashed horizontal red line represents the significance threshold (P=0.05) obtained using 1000 genome-wide permutations. A full color version of this figure is available at the Heredity journal online.

LOD plots from SIM analysis over all chromosomes for growth rate at 15 and 22 °C, as well as TS for cross 1A5 × 1E4. The dashed horizontal red line represents the significance threshold (P=0.05) obtained using 1000 genome-wide permutations. A full color version of this figure is available at the Heredity journal online.
QTLs associated with the yeast/hyphae dimorphism
For the yeast/hyphae dimorphism phenotype, we considered QTLs to be different if their confidence intervals did not overlap. In cross 3D1 × 3D7, we mapped five significant QTLs distributed on chromosomes 1, 3, 7 and 11 (Supplementary Figure S3 and Supplementary Tables S3 and S4), with two QTLs on chromosome 3 (Supplementary Table S3). In cross 1A5 × 1E4, two significant QTLs were identified on chromosomes 7 and 11 (Supplementary Figure S4 and Supplementary Tables S5 and S6). Both of these QTLs overlapped with QTLs of cross 3D1 × 3D7, suggesting these QTLs were shared in the two crosses (Supplementary Tables S3 and S5).
Identification and characterization of candidate genes within QTL confidence intervals
All annotated genes within each QTL 95% confidence interval were investigated to identify candidate genes affecting each trait. We excluded from consideration all genes that lacked sequence variation or that possessed only synonymous SNPs. For cross 3D1 × 3D7, a summary of the candidate genes for each trait is shown in Supplementary Tables S4 and S7. Supplementary Tables S6 and S8 summarize the candidate genes for cross 1A5 × 1E4.
On average, we found ~200 candidate genes per confidence interval, with a minimum of six candidate genes (chromosome 10, TS, cross 3D1 × 3D7) and a maximum of 1382 candidate genes (chromosome 1, growth rate (15 °C), cross 1A5 × 1E4). On average, ~40% of the candidate genes had no known function (Supplementary Tables S4 and S6–S8). There was no evidence for enrichment of HSPs in the QTL confidence intervals relative to the rest of the genome. However, some HSPs were among the candidate genes found within the QTL confidence intervals (Tables 1 and 2).
A more detailed investigation was conducted on the three major QTLs (LOD ⩾4.5) containing ⩽30 candidate genes in narrow confidence intervals (<85 kb). The chromosome 10 QTL associated with TS in cross 3D1 × 3D7 had an LOD score of 11.8 and contained only six candidate genes (Supplementary Table S7). The chromosome 1 and 3 QTLs associated with the yeast/hyphae dimorphism at 15 °C in cross 3D1 × 3D7 contained 15 candidate genes each (Supplementary Table S4) with LOD scores of 4.5 and 10.2, respectively. The lists of candidate genes associated with each QTL are summarized in Table 4 and Supplementary Tables S9 and S10.
Evidence for pleiotropy
In a previous study (Lendenmann et al., 2015), we described a shared QTL on chromosome 11 for melanization at 22 °C, growth rate at 22 °C and fungicide sensitivity in cross 3D1 × 3D7. We hypothesized that a rare mutation in PKS1 (protein ID 96592) found in the 3D7 parent was responsible for this pleiotropy (Lendenmann et al., 2014). In this study, we found evidence for pleiotropy between melanization and growth at 15 °C following the same pattern described earlier (Lendenmann et al., 2015), namely the PKS1 allele that increases melanization also slows growth at 15 °C. However, there was no evidence for pleiotropy between melanization and TS associated with the chromosome 11 QTL in cross 3D1 × 3D7 (Figure 4). On the other hand, we found strong evidence for pleiotropy among melanization at 15 °C, growth at 15 °C and TS based on a shared chromosome 10 QTL in cross 3D1 × 3D7. This QTL displayed the following pattern: the 3D7 allele that increases melanization also accelerates growth at 15 °C and decreases TS. There was some evidence for pleiotropy among melanization and TS in cross 1A5 × 1E4 due to a shared chromosome 2 QTL and there were significant correlations between melanization and growth at 15 °C for QTLs on chromosomes 5 and 8 (Figure 4). In both crosses, we found no evidence for pleiotropy among TS and fungicide sensitivity.

Evidence for pleiotropy among melanization, growth rate at 15 °C and TS for the chromosome 10 QTL in cross 3D1 × 3D7. Melanization is represented by gray values (11 dpi), with lower values indicating higher melanization (Lendenmann et al., 2014). The 3D7 allele that increases melanization also accelerates growth at 15 °C (a) and decreases TS (c). Panels b and d, which show corresponding full genome scan overlaps for cross 1A5 × 1E4, indicate no pleiotropy among the same three traits. Each panel shows a full genome scan LOD overlap plot based on SIM analysis, with traits shown in different colors (red=melanization; green=growth rate at 15 °C or TS). Horizontal lines in the LOD plots represent the color-coded significance thresholds (P=0.05) obtained with 1000 genome-wide permutations. Each panel includes the corresponding linear correlation among the two traits. The name above each QTL peak indicates which parental allele provided the higher phenotypic mean. Arrows point to the QTL peaks that could explain the observed positive or negative correlation among the two traits. A full color version of this figure is available at the Heredity journal online.
The QTL peaks for the yeast/hyphae dimorphism overlapped with growth rate QTLs on chromosomes 3, 7, 10 and 11, providing evidence for pleiotropy in both crosses. There also was a strong correlation between growth rate and the yeast/hyphae dimorphism. In both crosses, the allele associated with faster growth was also associated with filamentous growth (Supplementary Tables S1, S3, S5 and S11 and Figures 5 and 6), with >17% of the total growth rate variance explained by the yeast/hyphae dimorphism and significant (P<0.001) mean differences between the growth rates of the two morphologies (Figures 5 and 6). On the other hand, QTLs on chromosomes 1, 2, 4 and 8 did not overlap between the yeast/hyphae dimorphism and growth rate, indicating that growth morphology is not the sole determinant of growth rate (Figures 5 and 6). For example, in cross 3D1 × 3D7 there is a significant QTL for the yeast/hyphae dimorphism at 15 °C on chromosome 1, but there is no growth rate QTL at this position, whereas there is a significant QTL for growth rate at 15 °C on chromosome 2, but no corresponding QTL for the yeast/hyphae dimorphism (Figure 5b).

Evidence for pleiotropy among the yeast/hyphae dimorphism and growth rate phenotypes for the chromosome 3, 7, 10 and 11 QTLs in cross 3D1 × 3D7 (a=22 °C/b=15 °C). Each panel shows a full genome scan LOD overlap plot based on SIM analysis, with traits separated by colors (green=growth rate at 15 °C/22 °C, purple=yeast/hyphae dimorphism trait). Horizontal lines in the LOD plots represent the color-coded significance thresholds (P=0.05) obtained with 1000 genome-wide permutations. Each panel includes a corresponding box plot for the two traits. Mean growth rate values are presented either above or below the median line. The name above each QTL peak indicates which parental allele provided the higher phenotypic mean. Allele effects for nonsignificant, but visible pleiotropic peaks for either of the phenotypes were obtained by modeling the peaking marker of the significant peak for either of the phenotypes upon the corresponding opposite phenotype. For each pleiotropic peak, the allele providing faster growth also contributes to a more hyphal phenotype (a and b). A full color version of this figure is available at the Heredity journal online.

Evidence for pleiotropy among the yeast/hyphae dimorphism and growth rate phenotypes at 22 °C for the chromosome 7 and 11 QTL in cross 1A5 × 1E4. The figure shows a full genome scan LOD overlap plot based on SIM analysis, with traits separated by colors (green=growth rate at 15 °C/22 °C, purple=yeast/hyphae dimorphism trait). Horizontal lines in the LOD plots represent the color-coded significance thresholds (P=0.05) obtained with 1000 genome-wide permutations. In the box plot for the two traits, mean growth rate values are presented either above or below the median line. The name above each QTL peak indicates which parental allele provided the higher phenotypic mean. Allele effects for nonsignificant, but visible pleiotropic peaks for either of the phenotypes were obtained by modeling the peaking marker of the significant peak for either of the phenotypes upon the corresponding opposite phenotype. For each pleiotropic peak, the allele providing faster growth also contributes to a more hyphal phenotype. A full color version of this figure is available at the Heredity journal online.
Discussion
Genetic architecture of TS
The TS phenotype we used to measure thermal adaptation reflects differences in growth rates at two temperatures. Strains with a TS=1 are ‘generalists’ that grow at the same rate at both temperatures. Strains with TS>1 grow faster at the higher temperature and strains with TS<1 grow faster at the lower temperature. Strains that grow quickly at both temperatures (i.e. high growth rates and TS=~1) exhibit the greatest degree of thermal tolerance. Although the TS phenotypes of the parental strains used in both crosses were similar, the progeny from these parents exhibited a variance in TS comparable to the variance measured in natural field populations from around the world (Zhan and McDonald, 2011), indicating that the parents carried a high degree of genetic diversity for this trait. This finding also illustrates the potential for recombination to generate novel combinations of alleles that can affect thermal adaptation, providing a mechanism for a rapid evolutionary response to change in temperature. The presence of several visible but nonsignificant peaks on the genome scans, coupled with the finding of a maximum of 48.2% of the total phenotypic variance explained by the significant QTLs leads us to predict that additional QTLs will be revealed in future studies that include a greater number of markers and a larger number of offspring.
All four TS QTLs had allele means >1, indicating faster growth at 22 °C than at 15 °C. An earlier analysis of Swiss populations of Z. tritici found many isolates with a TS<1, consistent with adaptation to growth at lower temperatures (Zhan and McDonald, 2011). These findings suggest that genes involved in adaptation to cooler temperatures were not variable in the four Swiss parents. We found no evidence for antagonistic pleiotropy (genetic trade-offs), but we postulate that testing our mapping populations under more extreme temperatures (>22 °C and <15 °C) could reveal such effects.
The finding of different TS QTLs in the two crosses likely reflects differences in the alleles found in the parents and may reflect different selective processes underlying thermal adaptation. For example, in cross 1A5 × 1E4 the significant TS QTLs on chromosomes 2 and 4 were due mainly to growth QTLs exhibited in the 22 °C environment. Pathogen strains that grow faster at warmer temperatures are likely to be favored during the asexual phase of reproduction that occurs during the summer (Ponomarenko et al., 2011). The finding of different temperature-specific QTLs within the same cross suggests that different protein isoforms encoded by different alleles of the same gene could be better adapted to one temperature and maladapted to another temperature or that the corresponding genes are differentially regulated at the two temperatures, a known mechanism for thermal tolerance (Schoville et al., 2012).
All identified QTLs except the chromosome 10 TS QTL in cross 3D1 × 3D7 had large confidence intervals containing more than 10 genes. These QTLs could contain more then one segregating explanatory variant. Future studies using targeted backcross mapping (Sinha et al., 2008) could be used to determine if multiple linked QTLs exist within any of these QTLs.
QTLs associated with the yeast/hyphae dimorphism
We identified seven QTLs associated with the yeast/hyphae dimorphism, with two of these QTLs shared between the crosses. On average, ~35% of the overall variation in growth morphology was explained by these QTLs. These findings indicate that the yeast/hyphae dimorphism is inherited as a quantitative trait in Z. tritici. The yeast/hyphae dimorphism QTLs correlate with the growth QTLs, indicating pleiotropic effects. QTL alleles associated with faster growth were also associated with filamentous growth in both crosses. We consider it likely that the filamentous morphology is responsible for the faster growth, as the yeast morphology results in a more localized growth of Z. tritici colonies (Mehrabi and Kema, 2006). However, it is also possible that morphology is a threshold trait that is triggered through faster growth. Our results also indicate that growth rate is not determined solely by the colony morphology, as we found three growth QTLs that were not associated with the dimorphism phenotype. In Z. tritici the switch between morphologies can be induced in vitro by changing from a nutrient-rich medium, which favors yeast-like growth, to a poor medium that favors hyphal growth (Mehrabi and Kema, 2006; Mehrabi et al., 2006b). We found that temperature significantly affected dimorphism in our mapping populations, with more progeny exhibiting hyphal growth at 22 °C compared with 15 °C. While diverse environmental signals can affect dimorphism, the main signaling pathways appear well conserved, with the cAMP-dependent protein kinase A and mitogen-activated protein kinase pathways (Nadal et al., 2008) having major roles. In Z. tritici both of these pathways were shown to affect the dimorphism phenotype (Cousin et al., 2006; Mehrabi and Kema, 2006; Mehrabi et al., 2006a, b; Gohari et al., 2014). It is not known if the yeast-like morphology plays any role in the natural history of Z. tritici. Filamentous growth is obvious during all phases of its life cycle, including biotrophic, necrotrophic and saprotrophic phases of growth and development, but a yeast-like morphology has never been reported in planta. Regardless of the purpose of the yeast phase in Z. tritici, our findings illustrate that Z. tritici offers a new model for elucidating the mechanisms responsible for the yeast/hyphal dimorphism in fungi.
Identification and characterization of candidate genes within QTL confidence intervals
Earlier gene disruption studies in the IPO323 reference strain identified 10 genes (MgTpk2, MgGpa1, MgGpa3, MgGpb1, MCC1, MVE1, MgSlt2, MgHog1, MgFus3 and ZtWor1) that affected the yeast/hyphae growth morphology (Cousin et al., 2006; Mehrabi and Kema, 2006; Mehrabi et al., 2006a, b, 2009; Choi and Goodwin, 2011a, b; Gohari et al., 2014). We did not find any of these genes in the 95% confidence intervals of the dimorphism QTLs identified in our study, indicating that our QTL mapping approach identified novel gene candidates associated with the yeast/hyphae dimorphism in Z. tritici.
Out of the 15 candidate genes found in the 3D7 × 3D1 chromosome 1 QTL for the yeast/hyphae dimorphism at 15 °C, gene 88644 encodes a Ca+2/calmodulin-dependent protein kinase, which is part of a kinase family involved in various signaling cascades. In the dimorphic ascomycete Sporothrix schenckii, calmodulin-dependent protein kinases were shown to be involved in the dimorphism (Valle-Aviles et al., 2007). Hence, we consider gene 88644 as the most likely candidate to explain this chromosome 1 QTL.
The 3D7 × 3D1 chromosome 3 QTL for the yeast/hyphae (15 °C) dimorphism contains 15 candidate genes. Among these, gene 56742 encodes a guanine nucleotide exchange factor, a family of proteins involved in various intracellular signaling pathways. In a previous study in Ustilago maydis, a guanine nucleotide exchange factor was shown to be involved in dimorphism (Muller et al., 2003), hence we consider this the most likely candidate gene explaining this QTL.
Evidence for pleiotropy
The mitogen-activated protein kinase kinase candidate gene (JGI ID: 76249 (MgPbs2)) in the chromosome 10 TS QTL of cross 3D1 × 3D7 is the ortholog of the S. cerevisiae gene PBS2. Pbs2 phosphorylates the Hog1 protein (a mitogen-activated protein kinase) in S. cerevisiae as well as in Aspergillus nidulans (Panadero et al., 2006; Duran et al., 2010). HOG1 is part of the HOG pathway that is induced upon osmotic stress. Recent studies indicate that other stress responses, including thermal stress, are also governed by the HOG pathway. For example, the HOG pathway provides a mechanism for thermal tolerance in S. cerevisiae, which accumulates glycerol under cold stress to protect against freezing (Panadero et al., 2006). In Aspergillus fumigatus, the HOG pathway is thought to affect the fluidity of plasma membranes, providing protection under thermal stress (Ji et al., 2012). Changes in cell membrane fluidity are thought to be a common mechanism for microorganisms to adapt to changing temperatures (Leach and Cowen, 2014). A mutant study (Mehrabi et al., 2006b) of the Z. tritici ortholog HOG1, MgHog1 (JGI ID: 76502), found higher melanization associated with greater hyphal growth as well as larger colony sizes, the same pattern of phenotypes exhibited by the chromosome 10 TS QTL. Many of the chromosome 10 QTL pleiotropic effects observed in this study were found at 15 °C but not at 22 °C. This suggests that PBS2, and the HOG pathway, may be induced at lower temperatures in Z. tritici, providing a plausible mechanism to explain phenotypic plasticity.
Pleiotropy also explains the shared QTL peak on chromosome 11 in cross 3D1 × 3D7 for melanization (11 dpi), growth rate and the yeast/hyphae dimorphism for both temperatures (Lendenmann et al., 2014). In this case, we hypothesize that PKS1, in particular the postulated quantitative trait nucleotide at amino-acid position 1783 (Lendenmann et al., 2014), is the source of the observed trait variance. This hypothesis is supported by analyses showing that the RADseq marker closest to the PKS1 gene explains >7% of the variance for each of these traits.
Conclusions
We elucidated the genetic architecture of thermal adaptation in a pathogenic fungus and identified multiple QTLs as well as candidate genes underlying this trait. To our knowledge, this is the first study to use QTL mapping to identify genes involved in thermal adaptation in a plant pathogen. Our findings suggest that thermal adaptation in Z. tritici involves not only changes in growth rate but also morphological adaptations, including degree of melanization and changes in growth morphology. This suggests that Z. tritici has evolved many strategies for thermal adaptation, in part explaining its global distribution across a wide temperature range and leading us to predict that it will adapt rapidly to global warming. Future investigations aiming to functionally validate the candidate genes responsible for the mapped QTLs are underway. Additional population genetic diversity studies are needed to analyze the variation for these genes found in global populations and may further elucidate the potential of Z. tritici to adapt to changes in temperature. These studies point the way towards understanding the potential response of fungal pathogens to global warming.
Data archiving
Sequence data of parental strains and progeny have been submitted to NCBI: NCBI BioSample accession numbers of parental strains: SRS383146 (ST99CH3D1), SRS383147 (ST99CH3D7), SRS383142 (ST99CH1A5) and SRS383143 (ST99CH1E4). NCBI BioProject accession numbers of progeny strains: PRJNA256988 (cross: ST99CH3D1 × ST99CH3D7) and PRJNA256991 (cross: ST99CH1A5 × ST99CH1E4).
Progeny phenotypes have been submitted to Dryad: DOI:10.5061/dryad.cj432.
Accession codes
References
Angilletta MJ, Niewiarowski PH, Navas CA . (2002). The evolution of thermal physiology in ectotherms. J Therm Biol 27: 249–268.
Angilletta MJ, Oufiero CE, Leaché AD . (2006). Direct and indirect effects of environmental temperature on the evolution of reproductive strategies: an information‐theoretic approach. Am Nat 168: E123–E135.
Arends D, Prins P, Jansen RC, Broman KW . (2010). R/qtl: high-throughput multiple QTL mapping. Bioinformatics 26: 2990–2992.
Austin M . (2007). Species distribution models and ecological theory: a critical assessment and some possible new approaches. Ecol Model 200: 1–19.
Baird NA, Etter PD, Atwood TS, Currey MC, Shiver AL, Lewis ZA et al. (2008). Rapid SNP discovery and genetic mapping using sequenced rad markers. PLoS One 3: e3376.
Boyce KJ, Andrianopoulos A . (2013). Morphogenetic circuitry regulating growth and development in the dimorphic pathogen Penicillium marneffei. Eukaryot Cell 12: 154–160.
Brunner PC, Torriani SFF, Croll D, Stukenbrock EH, McDonald BA . (2013). Coevolution and life cycle specialization of plant cell wall degrading enzymes in a hemibiotrophic pathogen. Mol Biol Evol 30: 1337–1347.
Butler MJ, Day AW . (1998). Fungal melanins: a review. Can J Microbiol 44: 1115–1136.
Choi Y-E, Goodwin SB . (2011a). Gene encoding a C-type cyclin in Mycosphaerella graminicola is involved in aerial mycelium formation, filamentous growth, hyphal swelling, melanin biosynthesis, stress response, and pathogenicity. Mol Plant Microbe Interact 24: 469–477.
Choi Y-E, Goodwin SB . (2011b). MVE1, encoding the velvet gene product homolog in Mycosphaerella graminicola, is associated with aerial mycelium formation, melanin biosynthesis, hyphal swelling and light signaling. Appl Environ Microbiol 77: 942–953.
Cingolani P, Platts A, Wang LL, Coon M, Tung N, Wang L et al. (2012). A program for annotating and predicting the effects of single nucleotide polymorphisms, SnpEff: SNPs in the genome of Drosophila melanogaster strain w(1118); iso-2; iso-3. Fly 6: 80–92.
Cousin A, Mehrabi R, Guilleroux M, Dufresne M, Van der Lee T, Waalwijk C et al. (2006). The MAP kinase-encoding gene MgFus3 of the non-appressorium phytopathogen Mycosphaerella graminicola is required for penetration and in vitro pycnidia formation. Mol Plant Pathol 7: 269–278.
Croll D, Zala M, McDonald BA . (2013). Breakage-fusion-bridge cycles and large insertions contribute to the rapid evolution of accessory chromosomes in a fungal pathogen. PLoS Genet 9: e1003567.
de Jong G, van der Have TM . (2009) Temperature dependence of development rate, growth rate and size: from biophysics to adaptation. In: Whitman DW, Ananthakrishnan TN (eds). Phenotypic Plasticity of Insects: Mechanisms and Consequences. Science Publishers Inc: Plymouth, UK, pp 461–526.
Duran R, Cary JW, Calvo AM . (2010). Role of the osmotic stress regulatory pathway in morphogenesis and secondary metabolism in filamentous fungi. Toxins 2: 367–381.
Dybdahl MF, Kane SL . (2005). Adaptation vs. phenotypic plasticity in the success of a clonal invader. Ecology 86: 1592–1601.
Ehrenreich IM, Torabi N, Jia Y, Kent J, Martis S, Shapiro JA et al. (2010). Dissection of genetically complex traits with extremely large pools of yeast segregants. Nature 464: 1039–1042.
Ellison CE, Hall C, Kowbel D, Welch J, Brem RB, Glass NL et al. (2011). Population genomics and local adaptation in wild isolates of a model microbial eukaryote. Proc Natl Acad Sci USA 108: 2831–2836.
Eyal Z, Scharen AL, Prescott JM, van Ginkel M . (1987) The Septoria Diseases of Wheat: Concepts and Methods of Disease Management CIMMYT: Mexico, DF (Mexico). Available from http://repository.cimmyt.org/xmlui/handle/10883/1113?locale-attribute=en.
Feder ME, Hofmann GE . (1999). Heat-shock proteins, molecular chaperones, and the stress response: evolutionary and ecological physiology. Annu Rev Physiol 61: 243–282.
Fields PA . (2001). Review: protein function at thermal extremes: balancing stability and flexibility. Comp Biochem Physiol A 129: 417–431.
Franks SJ, Hoffmann AA . (2012). Genetics of climate change adaptation. Annu Rev Genet 46: 185–208.
Gauthier GM . (2015). Dimorphism in fungal pathogens of mammals, plants, and insects. PLoS Pathog 11: e1004608.
Gohari AM, Mehrabi R, Robert O, Ince IA, Boeren S, Schuster M et al. (2014). Molecular characterization and functional analyses of ZtWor1, a transcriptional regulator of the fungal wheat pathogen Zymoseptoria tritici. Mol Plant Pathol 15: 394–405.
Goodwin SB, Ben M'Barek S, Dhillon B, Wittenberg AHJ, Crane CF, Hane JK et al. (2011). Finished genome of the fungal wheat pathogen Mycosphaerella graminicola reveals dispensome structure, chromosome plasticity, and stealth pathogenesis. PLoS Genet 7: e1002070.
Ji Y, Yang F, Ma D, Zhang J, Wan Z, Liu W et al. (2012). HOG-MAPK signaling regulates the adaptive responses of Aspergillus fumigatus to thermal stress and other related stress. Mycopathologia 174: 273–282.
Jorgensen LN, Hovmoller MS, Hansen JG, Lassen P, Clark B, Bayles R et al. (2014). IPM strategies and their dilemmas including an introduction to www.eurowheat.org. J Integr Agric 13: 265–281.
Kema GHJ, Verstappen ECP, Todorova M, Waalwijk C . (1996). Successful crosses and molecular tetrad and progeny analyses demonstrate heterothallism in Mycosphaerella graminicola. Curr Genet 30: 251–258.
Knies JL, Izem R, Supler KL, Kingsolver JG, Burch CL . (2006). The genetic basis of thermal reaction norm evolution in lab and natural phage populations. PLoS Biol 4: 1257–1264.
Leach M, Cowen L . (2014). To sense or die: mechanisms of temperature sensing in fungal pathogens. Curr Fungal Infect Rep 8: 185–191.
Lendenmann MH, Croll D, McDonald BA . (2015). QTL mapping of fungicide sensitivity reveals novel genes and pleiotropy with melanization in the pathogen Zymoseptoria tritici. Fungal Genet Biol 80: 53–67.
Lendenmann MH, Croll D, Stewart EL, McDonald BA . (2014). Quantitative trait locus mapping of melanization in the plant pathogenic fungus Zymoseptoria tritici. G3 (Bethesda, MD) 4: 2519–2533.
Linde CC, Zala M, McDonald BA . (2009). Molecular evidence for recent founder populations and human-mediated migration in the barley scald pathogen Rhynchosporium secalis. Mol Phylogenet Evol 51: 454–464.
Manichaikul A, Dupuis J, Sen S, Broman KW . (2006). Poor performance of bootstrap confidence intervals for the location of a quantitative trait locus. Genetics 174: 481–489.
Mboup M, Bahri B, Leconte M, De Vallavieille-Pope C, Kaltz O, Enjalbert J . (2012). Genetic structure and local adaptation of European wheat yellow rust populations: the role of temperature-specific adaptation. Evol Appl 5: 341–352.
Mehrabi R, Kema GHJ . (2006). Protein kinase A subunits of the ascomycete pathogen Mycosphaerella graminicola regulate asexual fructification, filamentation, melanization and osmosensing. Mol Plant Pathol 7: 565–577.
Mehrabi R, Ben M'Barek S, van der Lee TAJ, Waalwijk C, de Wit PJGM, Kema GHJ . (2009). G alpha and G beta proteins regulate the cyclic AMP pathway that is required for development and pathogenicity of the phytopathogen Mycosphaerella graminicola. Eukaryot Cell 8: 1001–1013.
Mehrabi R, van der Lee T, Waalwijk C, Kema GHJ . (2006a). MgSlt2, a cellular integrity MAP kinase gene of the fungal wheat pathogen Mycosphaerella graminicola, is dispensable for penetration but essential for invasive growth. Mol Plant Microbe Interact 19: 389–398.
Mehrabi R, Zwiers L-H, de Waard MA, Kema GHJ . (2006b). MgHog1 regulates dimorphism and pathogenicity in the fungal wheat pathogen Mycosphaerella graminicola. Mol Plant Microbe Interact 19: 1262–1269.
Milus EA, Kristensen K, Hovmoller MS . (2009). Evidence for increased aggressiveness in a recent widespread strain of Puccinia striiformis f. sp tritici causing stripe rust of wheat. Phytopathology 99: 89–94.
Muller P, Katzenberger JD, Loubradou G, Kahmann R . (2003). Guanyl nucleotide exchange factor Sql2 and Ras2 regulate filamentous growth in Ustilago maydis. Eukaryot Cell 2: 609–617.
Nadal M, Garcia-Pedrajas MD, Gold SE . (2008). Dimorphism in fungal plant pathogens. FEMS Microbiol Lett 284: 127–134.
Nicholls S, Leach MD, Priest CL, Brown AJP . (2009). Role of the heat shock transcription factor, Hsf1, in a major fungal pathogen that is obligately associated with warm-blooded animals. Mol Microbiol 74: 844–861.
Nosanchuk JD, Casadevall A . (2006). Impact of melanin on microbial virulence and clinical resistance to antimicrobial compounds. Antimicrob Agents Chemother 50: 3519–3528.
O’Driscoll A, Kildea S, Doohan F, Spink J, Mullins E . (2014). The wheat–Septoria conflict: a new front opening up? Trends Plant Sci 19: 602–610.
Panadero J, Pallotti C, Rodriguez-Vargas S, Randez-Gil F, Prieto JA . (2006). A downshift in temperature activates the high osmolarity glycerol (HOG) pathway, which determines freeze tolerance in Saccharomyces cerevisiae. J Biol Chem 281: 4638–4645.
Parts L, Cubillos FA, Warringer J, Jain K, Salinas F, Bumpstead SJ et al. (2011). Revealing the genetic structure of a trait by sequencing a population under selection. Genome Res 21: 1131–1138.
Ponomarenko A, Goodwin SB, Kema GHJ . (2011). Septoria tritici blotch (STB) of wheat. Plant Health Instructor. ; doi:10.1094/PHI-I-2011-0407-1001.
R_Core_Team. (2012) R: A Language and Environment for Statistical Computing. The R Foundation for Statistical Computing: Vienna, Austria. ISBN: 3-900051-07-0. Available at: https://www.r-project.org/ (accessed on 11 December 2015).
Robert V, Cardinali G, Casadevall A . (2015). Distribution and impact of yeast thermal tolerance permissive for mammalian infection. BMC Biol 13: 1–14.
Schneider CA, Rasband WS, Eliceiri KW . (2012) NIH Image to ImageJ: 25 years of image analysis Nat Methods 9: 671–675.
Schoville SD, Barreto FS, Moy GW, Wolff A, Burton RS . (2012). Investigating the molecular basis of local adaptation to thermal stress: population differences in gene expression across the transcriptome of the copepod Tigriopus californicus. BMC Evol Biol 12: 1–17.
Sinha H, David L, Pascon RC, Clauder-Muenster S, Krishnakumar S, Nguyen M et al. (2008). Sequential elimination of major-effect contributors Identifies additional quantitative trait loci conditioning high-temperature growth in yeast. Genetics 180: 1661–1670.
Sorger PK, Pelham HRB . (1988). Yeast heat shock factor is an essential DNA-binding protein that exhibits temperature-dependent phosphorylation. Cell 54: 855–864.
Stefansson TS, McDonald BA, Willi Y . (2013). Local adaptation and evolutionary potential along a temperature gradient in the fungal pathogen Rhynchosporium commune. Evol Appl 6: 524–534.
Steinmetz LM, Sinha H, Richards DR, Spiegelman JI, Oefner PJ, McCusker JH et al. (2002). Dissecting the architecture of a quantitative trait locus in yeast. Nature 416: 326–330.
Taborda CP, da Silva MB, Nosanchuk JD, Travassos LR . (2008). Melanin as a virulence factor of Paracoccidioides brasiliensis and other dimorphic pathogenic fungi: a minireview. Mycopathologia 165: 331–339.
Trinci APJ . (1971). Influence of width of peripheral growth zone on radial growth rate of fungal colonies on solid media. J Gen Microbiol 67: 325–344.
Valle-Aviles L, Valentin-Berrios S, Gonzalez-Mendez RR, Rodriguez-Del Valle N . (2007). Functional, genetic and bioinformatic characterization of a calcium/calmodulin kinase gene in Sporothrix schenckii. BMC Microbiol 7: 1–12.
Yamori W, Noguchi K, Hikosaka K, Terashima I . (2010). Phenotypic plasticity in photosynthetic temperature acclimation among crop species with different cold tolerances. Plant Physiol 152: 388–399.
Zaffarano PL, McDonald BA, Zala M, Linde CC . (2006). Global hierarchical gene diversity analysis suggests the Fertile Crescent is not the center of origin of the barley scald pathogen Rhynchosporium secalis. Phytopathology 96: 941–950.
Zhan J, McDonald BA . (2011). Thermal adaptation in the fungal pathogen Mycosphaerella graminicola. Mol Ecol 20: 1689–1701.
Acknowledgements
The research was supported by a grant from the Swiss National Science Foundation (31003A_134755). Technical assistance was provided by Tryggvi S Stefansson. The RNA-Seq data was kindly provided by Stefano FF Torriani. RADseq libraries were constructed at the Genetic Diversity Center (GDC) and sequenced in the Quantitative Genomics Facility at the Department of Biosystems Science and Engineering (D-BSSE) at the scientific central facilities of ETH Zurich.
Author information
Authors and Affiliations
Corresponding author
Ethics declarations
Competing interests
The authors declare no conflict of interest.
Additional information
Supplementary Information accompanies this paper on Heredity website
Supplementary information
Rights and permissions
About this article

Cite this article
Lendenmann, M., Croll, D., Palma-Guerrero, J. et al. QTL mapping of temperature sensitivity reveals candidate genes for thermal adaptation and growth morphology in the plant pathogenic fungus Zymoseptoria tritici. Heredity 116, 384–394 (2016). https://doi.org/10.1038/hdy.2015.111
Received:
Revised:
Accepted:
Published:
Issue Date:
DOI: https://doi.org/10.1038/hdy.2015.111
This article is cited by
-
A thousand-genome panel retraces the global spread and adaptation of a major fungal crop pathogen
Nature Communications (2023)
-
Morphological changes in response to environmental stresses in the fungal plant pathogen Zymoseptoria tritici
Scientific Reports (2019)
-
Phenotyping Thermal Responses of Yeasts and Yeast-like Microorganisms at the Individual and Population Levels: Proof-of-Concept, Development and Application of an Experimental Framework to a Plant Pathogen
Microbial Ecology (2019)
-
Transposable element insertions shape gene regulation and melanin production in a fungal pathogen of wheat
BMC Biology (2018)
-
The genetic architecture of low-temperature adaptation in the wine yeast Saccharomyces cerevisiae
BMC Genomics (2017)
