
Figures, tables and video
From the following article
Neural circuits and mediators regulating swallowing in the brainstem
Detlef Bieger and Winfried Neuhuber
GI Motility online (2006)
doi:10.1038/gimo74
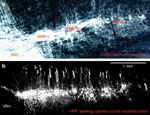
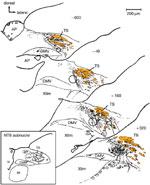
Figure 2
Subnuclear divisions of rat nucleus tractus solitarii (boxed insert) and distribution of central terminals of afferents coursing in the superior laryngeal nerve (SLN).
Full size figure and legend (50K)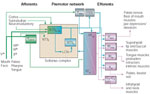
Figure 3
Proposed network circuit controlling the oral stage of swallowing.
Full size figure and legend (45K)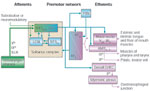
Figure 4
Proposed network circuit controlling the pharyngeal stage of swallowing.
Full size figure and legend (42K)
Figure 5
Proposed network circuit controlling the esophageal stage of swallowing.
Full size figure and legend (41K)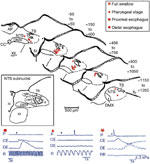
Figure 6
Map of deglutitive response loci in the rat NTS as determined by pressure pulse microejection of L-glutamate or excitatory amino acid agonists.
Full size figure and legend (46K)