
Figure 9 - Temporal relationship of UES pressure, opening and CP EMG during 4-mL barium swallow relative to hyoid movement.
From the following article
Ivan M. Lang
GI Motility online (2006)
doi:10.1038/gimo12
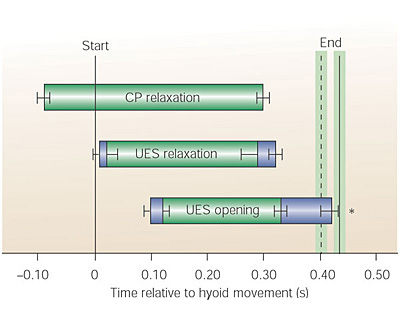
The start and end of hyoid movement are indicated by vertical lines where the shaded areas indicate standard error (SE). Horizontal bars depict mean + SE onset and offset of measured variables relative to start of hyoid movement. Green bars depict data from noninstrumented dogs (n = 8), and blue bars depict data from instrumented dogs (n = 6). Note the electrode implantation significantly delayed time of UES closure. There is approximately a 100-ms difference between CP relaxation, UES relaxation, and UES opening. (Source: Lang et al.,1 with permission of the American Physiological Society.)
Powerpoint slides for teaching
If the slide opens in your browser, Select "File > Save as" to save it.
Download Power Point slide (372K)