
Figure 6 - Effect of stress on UES pressure.
From the following article
Ivan M. Lang
GI Motility online (2006)
doi:10.1038/gimo12
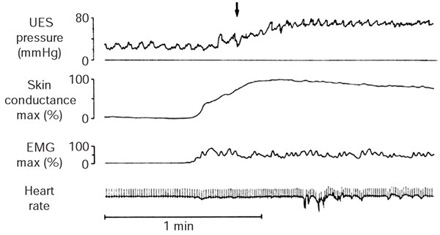
This figure depicts the tracings of UES pressure, skin conductance, integrated frontalis EMG, and heart rate before and during a stressful listening task (at arrow). Note the anticipatory rise in UES pressure about 15 s before the stress begins. (Source: Cook et al.,15 with permission of the American Gastroenterological Association.)
Powerpoint slides for teaching
If the slide opens in your browser, Select "File > Save as" to save it.
Download Power Point slide (448K)