
Abstract
Type 1 diabetes (T1D) is a chronic condition characterized by glucose fluctuations. Laboratory studies suggest that cognition is reduced when glucose is very low (hypoglycemia) and very high (hyperglycemia). Until recently, technological limitations prevented researchers from understanding how naturally-occurring glucose fluctuations impact cognitive fluctuations. This study leveraged advances in continuous glucose monitoring (CGM) and cognitive ecological momentary assessment (EMA) to characterize dynamic, within-person associations between glucose and cognition in naturalistic environments. Using CGM and EMA, we obtained intensive longitudinal measurements of glucose and cognition (processing speed, sustained attention) in 200 adults with T1D. First, we used hierarchical Bayesian modeling to estimate dynamic, within-person associations between glucose and cognition. Consistent with laboratory studies, we hypothesized that cognitive performance would be reduced at low and high glucose, reflecting cognitive vulnerability to glucose fluctuations. Second, we used data-driven lasso regression to identify clinical characteristics that predicted individual differences in cognitive vulnerability to glucose fluctuations. Large glucose fluctuations were associated with slower and less accurate processing speed, although slight glucose elevations (relative to person-level means) were associated with faster processing speed. Glucose fluctuations were not related to sustained attention. Seven clinical characteristics predicted individual differences in cognitive vulnerability to glucose fluctuations: age, time in hypoglycemia, lifetime severe hypoglycemic events, microvascular complications, glucose variability, fatigue, and neck circumference. Results establish the impact of glucose on processing speed in naturalistic environments, suggest that minimizing glucose fluctuations is important for optimizing processing speed, and identify several clinical characteristics that may exacerbate cognitive vulnerability to glucose fluctuations.
Introduction
Type 1 diabetes (T1D) is a chronic condition characterized by elevated glucose and increased glucose variability1,2. Among individuals with T1D, elevated glucose and increased glucose variability are related to adverse health outcomes, including mild neurocognitive disorder, dementia, and microvascular complications3,4,5,6,7. Laboratory studies indicate that very low (hypo) and, to a lesser extent, very high (hyper) glycemia both impair cognitive performance in those with T1D8,9,10,11,12,13,14,15. It remains unclear how continuous variation in glucose impacts cognitive fluctuations in naturalistic environments, with implications for everyday safety (e.g., driving, rapid decision-making)16. The magnitude of naturalistic cognitive fluctuations also shows promise to stratify individuals based on clinical risk17.
Until recently, technological limitations prevented researchers from understanding how moment-to-moment fluctuations in glucose impact moment-to-moment fluctuations in cognition in naturalistic environments. New advances in cognitive ecological momentary assessment (EMA) and continuous glucose monitoring (CGM) enable high-frequency, high-quality data collection within individuals over time. In cognitive EMA, participants complete ultra-brief cognitive tasks several times each day using smartphone devices. Cognitive EMA tasks are validated for repeated, remote, digital administration, and they reliably capture between- and within-person cognitive variation18,19,20. Just as EMA supports reliable and valid cognitive assessment, CGM devices sample glucose frequently (e.g., every five minutes), generating intensive longitudinal time series data of sufficient quality to enable medical decision-making and automated insulin delivery21,22. Together, EMA and CGM timeseries data provide new opportunities to improve understanding of within-person, naturalistic associations between glucose and cognition in T1D. In one of the few studies to date to combine EMA and CGM, overnight glucose variability and hypoglycemia exposure predicted next-day fluctuations in sustained attention23. To our knowledge, moment-to-moment dynamic associations between glucose and cognition have not been examined. Addressing this gap is critical to clarify when and for whom glucose fluctuations predict cognitive impairment, informing the development of empirically supported, person- and context-specific recommendations for diabetes self-management that maximize glycemic control and cognitive performance.
To these ends, the present study characterized dynamic, within-person associations between glucose and cognition (Fig. 1). Using CGM and EMA, we obtained intensive longitudinal glucose and cognitive timeseries in 200 adults with T1D (Table 1). Cognitive tasks measured processing speed (digital symbol matching [DSM]) and sustained attention (gradual onset continuous performance test [GCPT]) (Fig. 2). In Aim 1, we evaluated within-person associations between glucose and cognition. We hypothesized that cognitive performance would be reduced at low and high glucose, reflecting cognitive vulnerability to glucose fluctuations (hypothesis 1 [H1]). We also expected to observe individual differences in cognitive vulnerability to glucose fluctuations (hypothesis 2 [H2]). In Aim 2, we identified clinical characteristics that predicted individual differences in cognitive vulnerability to glucose fluctuations. Successful execution of study aims promises to establish the short-term impact of glucose fluctuations on cognition in naturalistic environments, inform person- and context-specific recommendations for diabetes self-management, and identify a limited number of large-effect clinical characteristics that exacerbate cognitive vulnerability to glucose fluctuations.
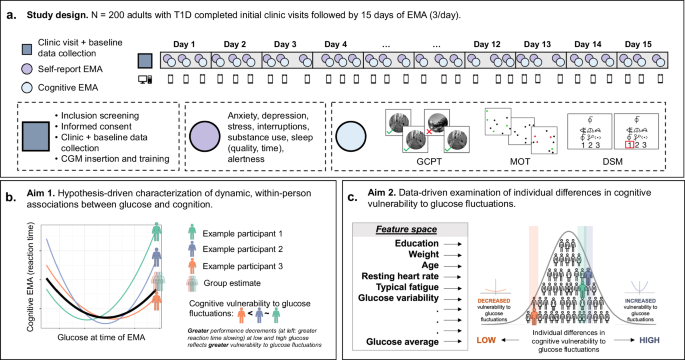
Results are summarized in Figs 3–5. a Adults with type 1 diabetes (T1D) completed initial clinic visits and baseline cognitive data collection followed by 15 days of ecological momentary assessment (EMA). b Analyses characterized dynamic, within-person associations between glucose and cognition for the full sample (group estimate; thick black line) and each participant (individual estimates; example participants 1–3 in green, purple, and orange). U-shaped curves for speeded outcomes (depicted below) indicate slower reaction time at low and high glucose, whereas inverted curves for accuracy outcomes indicate reduced accuracy at low and high glucose. Steeper curves (e.g., example participants 1-2, shaded green and purple) indicate greater cognitive vulnerability to glucose fluctuations, whereas shallower curves (e.g., example participant 3, shaded orange) indicate reduced cognitive vulnerability to glucose fluctuations. c Data-driven analyses identified strong person-level predictors of individual differences in cognitive vulnerability to glucose fluctuations. Strong predictors were selected from a feature space that included 58 clinical, physiological, and demographic variables. Gradual onset continuous performance test [GCPT], multiple object tracking [MOT], digit-symbol matching [DSM].

a DSM: participants were presented with a target symbol and a digit-symbol pairing key. They used their touchscreen to press the digit that was paired with the target symbol in the key. There was no response deadline, and each EMA session lasted 30 seconds. b GCPT: participants viewed a circular, grayscale image of a city or mountain. They were instructed to press their touchscreen device when the image depicted a city and withhold a response when the image depicted a mountain. Each EMA session lasted 60 seconds and consisted of 75 trials. Legend items were not visible during administration.
Results
Demographic characteristics and descriptive statistics
Table 1 reports participant characteristics, and Table 2 provides descriptive statistics and multilevel reliability estimates for cognitive EMA variables. After data cleaning, the analysis sample (n = 190) did not differ from the full sample (N = 200) with respect to any of the following: age, gender, race, ethnicity, educational attainment, hemoglobin A1c, CGM summary statistics (glucose mean, standard deviation, coefficient of variation), CGM percent time in range (70–180 mg/dL, below 70 mg/dL, below 54 mg/dL, above 180 mg/dL, above 250 mg/dL), or number of lifetime severe hypoglycemic events (ps > 0.05).
Aim 1: Processing speed, but not sustained attention, was vulnerable to glucose fluctuations
We used hierarchical Bayesian modeling to estimate dynamic, within-person associations between glucose and cognition. To capture cognitive vulnerability to low and high glucose fluctuations, we modeled glucose using quadratic polynomials. Quadratic terms for glucose were examined for the full sample (group estimates; in Methods, γ20) as well as each participant (individual estimates; in Methods, u2j). To evaluate the impact of potential observation and/or sample selection biases, we ran models across three EMA completion cutoffs (≥50%, ≥66%, ≥80%). We focus interpretation on results that were significant across all completion cutoffs.
Consistent with H1, group estimates of cognitive vulnerability to glucose fluctuations were significant for DSM (Fig. 3a). Specifically, large glucose fluctuations were associated with slower and less accurate DSM performance. This pattern remained significant across all EMA completion cutoffs for DSM reaction time (RT). It was marginally significant using only the ≥66% EMA completion cutoff for DSM accuracy. Table 3 reports results using the ≥66% EMA completion cutoff, and supplementary materials (Supplementary Table 1, Supplementary Fig. 1) report results across all EMA completion cutoffs. Inconsistent with H1, group estimates of cognitive vulnerability to glucose fluctuations were not significant for GCPT. Results suggest that processing speed (DSM) may be more vulnerable to glucose fluctuations than sustained attention (GCPT).

Counter-clockwise from top left: a Group estimates and credible intervals (CIs) for linear and quadratic terms relating glucose to DSM RT (x-axis), evaluated across EMA completion cut-offs (y-axis). 90% CIs are in black, and 95% CIs are in gray. Significant effects (marked by asterisks) were evaluated with respect to 95% CIs. Quadratic terms were significant across all EMA completion cut-offs, indicating cognitive vulnerability to glucose fluctuations. b Variation in individual estimates of cognitive vulnerability to glucose fluctuations for DSM RT. Cognitive vulnerability to glucose fluctuations (y-axis) is visualized for each participant (x-axis) across EMA completion cutoffs (panels). CIs illustrate different levels of uncertainty (95%, 90%, 66%) around individual estimates. Gray lines show 95% CIs, red lines show 90% CIs that do not overlap zero, and blue lines show 66% CIs that do not overlap zero. Most CIs are shaded blue but not red, suggesting moderate to high (66–90%) probability that a given individual exhibited cognitive vulnerability to glucose fluctuations. c Model-implied predictions relating glucose (x-axis) to DSM RT (y-axis) in ≥66% EMA completion data. Group predictions (based on a) are represented by the thick black line, and individual predictions (based on b) are represented by thin gray lines, where one gray line = one participant. DSM RT was slower at low and high glucose, reflecting cognitive vulnerability to glucose fluctuations. Variation in thin gray lines reflects individual differences in cognitive vulnerability to glucose fluctuations.
Consistent with H2, there were meaningful individual differences in cognitive vulnerability to glucose fluctuations for RT (DSM RT, GCPT RT; refer to Supplementary Fig. 2 for visualization and Supplementary Table 2 for statistics). These results suggest that glucose fluctuations affect cognitive slowing for some individuals to a greater extent than others. Specifically, when glucose was one SD below its mean, individuals with high (+1 SD) vulnerability to glucose fluctuations responded 0.76 ms (GCPT RT) and 3.24 ms (DSM RT) slower than individuals with low (−1 SD) vulnerability to glucose fluctuations. When glucose was two SDs below its mean, individuals with high vulnerability to glucose fluctuations responded 1.8 ms (GCPT RT) and 9.30 ms (DSM RT) slower than individuals with low vulnerability to glucose fluctuations (Fig. 3b, c). We did not observe individual differences in cognitive vulnerability to glucose fluctuations for accuracy (DSM accuracy, GCPT accuracy; see Supplementary Table 2).
Given that DSM RT exhibited significant group (H1) and variable individual (H2) estimates of cognitive vulnerability to glucose fluctuations, we next sought to characterize optimal (i.e., fast) performance. Optimal performance consistently occurred above individuals’ glucose means, regardless of the value of those means. On average, it occurred 0.72 SDs (47.49 mg/dL) above individuals’ glucose means and was associated with 0.57% (5.30 ms) performance gain relative to individuals’ cognitive means. Glucose concentrations associated with optimal performance—and the extent to which optimal performance represented an improvement relative to typical performance—varied between individuals (Fig. 4).

Optimal DSM RT (y-axis) plotted against glucose levels that were associated with optimal DSM RT (x-axis) for each EMA completion cutoff (≥50%, ≥66%, ≥80%). Along the x-axis: glucose is centered and scaled within-person (WP). Along the y-axis: optimal DSM RT is plotted as percent (%) deviation from WP average performance. More negative values indicate a larger difference between optimal and average performance. Each dot represents one participant. For most participants (red high-density regions), optimal performance occurred 0.72 standard deviations (47.49 mg/dL) above WP glucose means and was associated with 0.57% (5.30 ms) faster performance relative to WP cognitive means.
Aim 2: Clinical characteristics predicted cognitive vulnerability to glucose fluctuations
Data-driven lasso regression identified seven variables from a larger feature set of 58 (Supplementary Table 3) that explained individual differences in cognitive vulnerability to glucose fluctuations for DSM RT. Lasso regression tends to retain the strongest among correlated predictors (Supplementary Fig. 3)24, so we discuss significant results in terms of constructs rather than variables (refer to Table 4 codebook). Across EMA completion cutoffs, (1) older age, (2) greater CGM time in hypoglycemia, (3) greater number of lifetime severe hypoglycemic events, (4) presence of microvascular complication(s), (5) greater CGM glucose variability, (6) greater self-reported tiredness/fatigue, and (7) larger neck circumference predicted greater cognitive vulnerability to glucose fluctuations (Table 5, Fig. 5). To determine whether these risks specifically indicated cognitive vulnerability to glucose fluctuations, we ran additional analyses using lasso regression to predict individual differences in average cognition (Supplementary Table 4). Except for CGM glucose variability, variables that predicted individual estimates of cognitive vulnerability to glucose fluctuations also predicted individual differences in average cognition, suggesting that they represent general risk for slow responding as well as greater vulnerability to slow responding at low and high glucose.

Group estimates of cognitive vulnerability to glucose fluctuations are visualized as thick black lines, and individual estimates are visualized as thin lines. The color of the individual lines reflects the value of each variable, a–g: a neck circumference (NeckCir_binary: [0] circumference ≤40 cm, [1] circumference > 40 cm), b number of lifetime severe hypoglycemic events (SevereHypoEvents: 0 [no events] to 6 [>10 events]), c tiredness/fatigue (tired_binary: [0] not tired during the day, [1] tired during the day), d percent CGM time in hypoglycemic range (gluBelow70: percent time < 70 mg/dL), e CGM glucose variability (gluCV: percent ratio of glucose standard deviation to glucose mean), f presence vs. absence of microvascular disease (microvascular_binary: [0] microvascular disease absent, [1] microvascular disease present), and g age (in years). Additional details about variable derivation are in Supplementary Table 3.
Post-hoc analyses
Neck circumference was one of seven variables that explained individual differences in cognitive vulnerability to glucose fluctuations. Post-hoc analyses sought to clarify this unexpected finding by correlating individual estimates of cognitive vulnerability to glucose fluctuations with three additional variables (sleep apnea risk, upper body adiposity, gender) that, themselves, have been shown to correlate with neck circumference25,26,27,28. Correlation tests indicated that sleep apnea risk25 (r = 0.43, p <.001) and upper body adiposity (r = 0.16, p = 0.051) were strongly associated with individual estimates of cognitive vulnerability to glucose fluctuations. Gender (r = 0.11, p = 0.17) was not associated with individual estimates of cognitive vulnerability to glucose fluctuations.
To estimate dynamic associations between glucose and cognition independent of clinical target ranges, primary analyses used within-person glucose centering and scaling. To test the robustness of our results under different data processing conditions, we reran analyses in the ≥66% EMA completion sample using within-person glucose centering (without scaling). Consistent with Aim 1 results, we observed significant group (H1) and variable individual (H2) estimates of cognitive vulnerability to glucose fluctuations for DSM RT (statistics reported in Supplementary Tables 5, 6). Specifically, large glucose fluctuations were associated with slower and less accurate DSM performance. The rank order of individual estimates of cognitive vulnerability to glucose fluctuations was similar between primary and post hoc models (r [95% confidence interval] = 0.94 [0.92, 0.96]). Consistent with Aim 2 results, robust predictors from primary analyses that scaled glucose remained significant in post hoc analyses that did not scale glucose (Supplementary Table 7).
Discussion
This study characterized dynamic, within-person associations between glucose fluctuations and cognition in adults with T1D during naturally occurring periods of hypo- (low), hyper- (high), and eu- (target) glycemia, providing foundational knowledge about when and for whom glucose fluctuations predict cognitive impairment. We hypothesized that cognitive performance would be reduced at low and high glucose, reflecting cognitive vulnerability to glucose fluctuations (H1). We also expected to observe individual differences in cognitive vulnerability to glucose fluctuations (H2). Both hypotheses were supported for processing speed (specifically, DSM RT) but not sustained attention. Next, we used data driven methods to understand whether individual differences in vulnerability to glucose fluctuations were associated with clinical features of T1D. For processing speed, we observed that greater vulnerability to glucose fluctuations was explained by (1) older age, (2) greater CGM time in hypoglycemia, (3) greater number of lifetime severe hypoglycemic events, (4) presence of microvascular complication(s), (5) greater CGM glucose variability, (6) greater self-reported tiredness/fatigue, and (7) larger neck circumference. Together, results indicate that processing speed is vulnerable to glucose fluctuations, the magnitude of this effect differs between individuals, and individual differences in vulnerability to glucose fluctuations reflect risk factors that are both specific (e.g., time in hypoglycemia) and non-specific (e.g., fatigue) to T1D.
Group estimates of cognitive vulnerability to glucose fluctuations were evident for processing speed (DSM) but not sustained attention (GCPT) and RT more so than accuracy (Supplementary Fig. 1). This pattern cannot be explained by differences in cognitive task reliability (Table 2). Consistent with present results, some researchers have posited that processing speed impairments are foundational to T1D, underlying observed impairments in other domains29,30. Processing speed impairments may appear stronger for speed (median RT) compared to accuracy (number correct) because speed can be measured using robust statistics, mitigating the impact of environmental disruptions unrelated to T1D19. Alternatively, it is possible that we did not obtain significant results for sustained attention because sustained attention is vulnerable to prolonged (e.g., hour-to-hour) rather than dynamic (moment-to-moment) changes in glucose. Pyatak et al.23 examined the impact of overnight glucose on next-day functioning, observing that overnight glucose variability and time in hypoglycemia prospectively predicted sustained attention. Their results suggest that sustained attention may be vulnerable to longer-term effects of glucose variability on sleep/wake regulatory processes31, whereas present results suggest that processing speed may be vulnerable to current glycemic status. Additional research is necessary to characterize the association between glucose and cognition across a continuum of timescales.
Given that processing speed was vulnerable to glucose fluctuations, we next sought to describe optimal processing speed, defined as the minima of quadratic curves relating glucose to reaction time. Optimal processing speed was 5.30 ms faster than average processing speed (Fig. 4). This effect size compares to effect sizes observed in studies of partial and total sleep restriction32,33,34,35 and suggests that most within-person variation in processing speed occurs over a relatively small range. It remains unclear whether these subtle performance gains and losses are perceived by individuals and/or have practical implications in T1D (e.g., for driving).
Optimal processing speed occurred at glucose concentrations slightly above participants’ glucose means, regardless of the absolute level (e.g., euglycemic vs. hyperglycemic) of those means. Metabolic habituation may explain why optimal performance occurred near participants’ means. Evidence for habituation comes from previous studies demonstrating that repeated exposure to hypoglycemia impairs subjective awareness of hypoglycemia36,37, and sustained exposure to hyperglycemia triggers autonomic responses to hypoglycemia at higher thresholds (e.g., 110 mg/dL rather than 70 mg/dL)38. Our results suggest that individuals may habituate to their typical glucose range and thereafter perform cognitively optimally within that range. The opposite is also possible: individuals with T1D may gravitate toward glucose ranges that support optimal cognitive performance. Future studies are required to disentangle these possibilities. Meal timing may further explain why optimal performance occurred slightly above (rather than at) participants’ glucose means. Glucose and insulin are elevated after meals, and insulin is cognitively enhancing39. Longitudinal burst studies40,41 are necessary to evaluate the cognitive effects of gradual (vs. rapid) increases (vs. decreases) in average glucose. This work may inform recommendations to improve diabetes self-management without compromising cognition.
Although processing speed was generally vulnerable to glucose fluctuations, some individuals were more vulnerable to glucose fluctuations than others (Fig. 3b, c). Individuals who were more vulnerable to glucose fluctuations tended to exhibit poorer diabetes control, including greater CGM time in hypoglycemia, greater number of lifetime severe hypoglycemic events, greater CGM glucose variability, and microvascular complication(s) (Table 5, Fig. 5). In addition to diabetes-specific risks, we observed greater vulnerability to glucose fluctuations among older individuals, individuals with more self-reported fatigue, and individuals with larger neck circumference. The latter result was unexpected and may reflect the fact that neck circumference correlates with several well-established risk factors for cognitive impairment, including sleep apnea risk and upper body adiposity42,43,44,45,46,47. Although we included sleep apnea risk and upper body adiposity in data-driven models, our approach (lasso regression) tends to select only the strongest among correlated features24. Together, results of data-driven analyses identify several diabetes-specific (e.g., time in hypoglycemia) and non-specific (e.g., neck circumference, sleep apnea, upper body adiposity, fatigue) risks that indicate increased cognitive vulnerability to glucose fluctuations. Individuals with these risk factors may be advised to limit consequential, speed-dependent cognitive tasks in moments when glucose is considerably above or below its typical level.
We found that a similar profile of diabetes-specific and non-specific risks also predicted individual differences in average processing speed (Supplementary Table 4), indicating overlap between risks for slow processing speed and risks for cognitive vulnerability to glucose fluctuations. These results replicate prior research implicating suboptimal diabetes control in cognitive impairment23,25,48,49,50,51, and they provide empirical support for theories positing that accumulated diabetes-related insults increase cognitive vulnerability to glucose fluctuations52,53,54. It follows that cognitive vulnerability to glucose fluctuations may be a sensitive digital biomarker (i.e., digital marker of normal or pathogenic biological processes)55 of neurocognitive dysfunction in T1D. Future evidence that cognitive vulnerability predicts long-term clinical outcomes would suggest the utility of digital cognitive assessments for remote risk screening.
This work clarifies the natural time course of dynamic, within-person associations between glucose and cognition in T1D. There are, however, limitations to consider. First, we required 24-hour access to a smartphone with reliable internet access. This requirement may have biased sampling towards individuals with higher socioeconomic status. Although “bring your own device” (BYOD) studies increase accessibility and scalability20,56,57, future studies might mitigate sampling biases by providing participants with smartphones. Second, the present sample was predominantly white and non-Hispanic, limiting generalizability to other racial and ethnic groups. Third, CGM became standard of care during data collection. Thereafter, we allowed participants (n = 130) to use their personal, clinically prescribed (unblinded) CGM in addition to study administered (blinded) CGM. Notably, blinding did not account for individual differences in cognitive vulnerability to glucose fluctuations (Table 5). Finally, age was highly correlated with mean DSM RT (r [95% confidence interval] = 0.67 [0.59, 0.74]). This suggests that the effects of age on cognitive vulnerability to glucose fluctuations may reflect, in part, between-person differences in mean performance. Future efforts to develop age-based norms for cognitive EMA will help to address this limitation.
The present study leveraged recent advances in CGM and cognitive EMA to characterize dynamic, within-person associations between glucose and cognition in naturalistic environments. Results demonstrate that processing speed is vulnerable to glucose fluctuations, the magnitude of this effect differs between individuals, and individual differences in vulnerability to glucose fluctuations reflect diabetes-specific (e.g., time in hypoglycemia) as well as non-specific (e.g., fatigue) risks. These findings have implications for risk screening and behavioral intervention in T1D. With respect to risk screening, our results suggest that individual estimates of cognitive vulnerability to glucose fluctuations can be feasibly, remotely ascertained using scalable digital technologies and show preliminary validity as digital biomarkers of neurocognitive dysfunction in T1D. Future research is required to evaluate the long-term temporal stability and clinical utility of individual estimates of cognitive vulnerability to glucose fluctuations. With respect to intervention, our results focus attention on a limited number of modifiable risks that may be targeted to improve cognitive performance and reduce cognitive vulnerability to glucose fluctuations. Randomized control trials are necessary to lend empirical support to interventions targeting these risks. In the present study, T1D provided a powerful model for understanding the pathophysiology of cognitive fluctuations in a clinical population that experiences frequent, short-term cognitive impairment4,8,9. Beyond T1D, this work demonstrates how data from physiological sensors and EMA can be integrated to better understand individual differences in daily functioning and clinical risk.
Methods
Participants
Adults with T1D (N = 200, 107 female) were recruited from diabetes and endocrinology centers at Mayo Clinic in Rochester, Minnesota, State University of New York (SUNY) Upstate Medical University, University of Pennsylvania, and Advent Health in Orlando, Florida (Table 1). To enroll, participants were required to be over 18 years old, diagnosed with T1D for >1 year, and fluent in English. They were also required to have 24-hour access to a personal smartphone with a reliable internet connection, demonstrate understanding of the EMA protocol, and agree to comply with it. Participants were excluded based on the following: inability to complete cognitive assessments owing to significant visual, motor, hearing, or cognitive impairment; any medical or psychiatric condition or treatment that was determined by the principal investigators to interfere with completion of the study; and inability to complete EMAs (scheduled 9:00 AM–9:00 PM) due to night shift work, planned travel across time zones, and/or other circumstances that would systematically interfere with the ability to complete assessments. Written informed consent was obtained prior to enrollment, and the study procedures were approved by the Jaeb Center for Health Research IRB. The Jaeb Center served as the clinical coordinating center.
Participants completed initial clinic visits (~2 hours) and baseline cognitive data collection (~45 minutes) prior to EMA. Most clinic visits were completed in person; however, a subset of participants (n = 25) completed clinic visits virtually due to the COVID-19 pandemic. Baseline cognitive data collection was completed virtually. Participants were excluded if they completed <50% of EMAs. This was a pre-specified criterion based on concern that low EMA compliance would introduce sampling bias (e.g., increased sampling during periods of euglycemia relative to hypoglycemia). To encourage compliance, participants received bonus compensation if they completed >80% of EMAs.
Cognitive tasks
We administered three cognitive tasks during EMA: digit symbol matching (DSM), gradual onset continuous performance test (GCPT), and multiple object tracking (MOT). Tasks were selected based on (1) their ability to measure performance in domains that are sensitive to cognitive impairment and/or change in T1D30,58,59,60 and (2) mobile pilot testing demonstrating high completion, high usability (e.g., minimal participant-reported burden), minimal range restriction, and good between-person reliability61. In the present manuscript, we did not analyze MOT data due to low within-person reliability <0.319, which limits variance that may be explained by time-varying predictors such as glucose62. Refer to63,64 for MOT task details. Links to tasks, including task instructions and practice trials, are available on GitHub: https://github.com/zwihawks/MomentaryCogT1D/blob/main/CogEMA_tasks.rtf.
TestMyBrain DSM for EMA (Fig. 2a) is a visuospatial task with demands on processing speed and short-term working memory65. It was adapted for remote administration from the Wechsler Adult Intelligence Scale digit symbol coding task66,67 and has been previously validated for cognitive EMA in T1D68. During administration, participants were presented with both a target and a digit-symbol pairing key (Fig. 2a). Participants were instructed to press (using their device’s touchscreen) the digit that was paired with the target symbol in the key. There was no response deadline. After response selection, the next target symbol appeared. In each EMA session, six symbols were sampled from a larger set of thirty. Symbols were paired with digits in a 2:1 symbol-to-digit ratio. Digit-symbol pairings varied across, but not within, EMA sessions. Accuracy was recorded as the number of correct responses in 30 seconds. Reaction time (RT) was recorded as the median RT for correct responses.
TestMyBrain GCPT for EMA (Fig. 2b) is an executive functioning task that requires sustained attention, cognitive control, and response inhibition69,70. It has been previously validated for cognitive EMA in T1D68. In each trial, participants viewed a circular, grayscale image of a city or mountain (Fig. 2b). They were instructed to respond (by pressing their device’s touchscreen) when the image depicted a city (80% of trials), and they were instructed to withhold a response when the image depicted a mountain (20% of trials). GCPT for EMA consisted of seventy-five 800 millisecond trials (test duration = 60 seconds). Images faded in and out between trials. Accuracy was recorded as discrimination sensitivity (d-prime)71, and RT was recorded as the median RT for correct responses.
Ecological Momentary Assessment (EMA)
Participants received text messages prompting them to complete brief (~7-minute) EMA sessions. Each EMA session included self-report questionnaires and cognitive assessments. Text messages (3 per day x 15 days = 45 total) were delivered at random times within 4-hour windows: morning (9:00 AM–12:59 PM, according to the local time zone), afternoon (1:00–4:59 PM), and evening (5:00–9:00 PM). Upon receiving a text, participants had 30 minutes to start an EMA session. If needed, they received a text reminder after 25 minutes had elapsed. Self-report questionnaires were not analyzed. Refer to ref. 61 for questionnaire details.
Cognitive test batteries were identical within EMA sessions (e.g., all participants completed the same test versions in the same order at time 1) but varied across sessions (e.g., each participant completed different test versions at time 1 vs. time 2, and tests were presented in different orders at time 1 vs. time 2). Varying the test versions across sessions discouraged participants from relying on memory, ensuring that tasks remained valid measures of performance within the intended cognitive domains. As part of onboarding, participants reviewed task instructions, completed practice trials, and received corrective feedback.
Continuous Glucose Monitoring (CGM)
Study-administered CGM (Dexcom G6) devices were inserted during the initial clinic visit and worn for a maximum of twenty days. After ten days, participants were instructed to replace the original study administered CGM device with a second one72. Study-administered CGM devices did not require manual calibration, and participants were blinded to their readings. Nonetheless, use of CGM is part of standard care in T1D73, and some participants (n = 128) utilized personal CGM devices in addition to study-administered blinded CGM devices. These participants had access to measurements from personal CGM devices throughout the study.
Data cleaning and processing
Analyses were performed in R v4.1.174 using the tidyverse package for data exclusion and visualization75, the rstanarm and tidybayes packages for hypothesis-driven (hierarchical Bayesian) modeling76,77, and the glmnet package for data-driven (lasso) modeling78,79.
Participants were required to provide >72 hours of raw data from study administered CGM devices. Two participants (1 female) did not provide sufficient CGM data and were excluded from analyses. One participant (female) was excluded due to a protocol deviation (two study-administered CGM devices were worn simultaneously). Within participants, consistent with manufacturer’s instructions, we excluded the first 24 hours data from each study-administered device due to reduced accuracy80. Exclusions occurred prior to EMA for the first device (inserted during the clinic visit) and around day nine of EMA for the second device (inserted mid-study to replace the first device after 10 days of wear). To characterize group estimates of cognitive vulnerability to glucose fluctuations (Aim 1), CGM and EMA data were time-aligned by subsampling CGM observations from 0–5 minutes prior to EMA. To examine individual differences in cognitive vulnerability to glucose fluctuations (Aim 2), person-level indicators of glycemic control (e.g., average glucose, glucose coefficient of variation, hypo- and hyperglycemic event rates, percent time in hypo- and hyperglycemia) were computed from CGM timeseries as previously described81,82,83,84. Variable distributions for Aims 1-2 are provided in Supplementary Figs. 4,5, and codebooks for Aims 1-2 are provided in Supplementary Table 3.
EMA data were excluded when task performance was comparable to chance or unlikely to represent adequate and expected effort, based on the following criteria: DSM accuracy less than 50%, DSM number correct less than six, and GCPT omission errors greater than 50%56. To ensure consistency across participants and sessions, we required responses to be registered using touchscreens, and we required tasks to be marked as complete (e.g., browser did not close prematurely)19. Five participants (all male) were excluded because they did not meet these quality control criteria in 50% or more of possible EMA sessions. Two participants (1 female) were excluded due to a technical anomaly that allowed them to complete more than 45 EMA sessions.
Aim 1 analysis: Characterizing dynamic, within-person associations between glucose and cognition
We used hierarchical Bayesian modeling to obtain group (aggregated across all participants in the sample) and individual (specific to each participant) estimates of dynamic, within-person associations between glucose and cognition. Estimation used Gaussian family response distributions and weakly informative (default) priors76. Consistent with laboratory studies8,9,10,11,12,13,14,15, we hypothesized (H1) that cognitive performance would be reduced at low and high glucose, reflecting cognitive vulnerability to glucose fluctuations. We also hypothesized (H2) that individuals would differ in their cognitive vulnerability to glucose fluctuations.
Target glucose ranges in people with T1D are based on group data indicating risk for acute and long-term diabetes complications, and it is unclear whether boundaries defining these ranges function similarly in terms of short-term cognitive performance38,85,86. To estimate dynamic associations between glucose and cognition independent of clinical target ranges, we used within-person centering and scaling. Specifically, we centered glucose around person-level means and scaled glucose relative to person-level standard deviations. As a test of robustness, we ran post-hoc analyses using within-person centering but not scaling.
To capture cognitive vulnerability to low and high glucose fluctuations, we modeled glucose using orthogonal quadratic polynomials. Orthogonalizing polynomials allowed us to eliminate collinearity between predictors and assess the independent contributions of linear and quadratic terms in explaining outcome variation87,88:
\({Y}_{{ij}}\) represents cognitive score Y in EMA i for participant j, intercepts (group: γ00; individual: u0j) represent average cognitive performance at average glucose, linear terms for glucose (group: γ10; individual deviation: u1j) represent the strength of linear associations between glucose and cognition at average glucose, and quadratic terms for glucose (group: γ20; individual deviation: u2j) represent curvilinear (U-shaped) associations between glucose and cognition, capturing cognitive vulnerability to glucose fluctuations. To eliminate divergent transitions and obtain recommended effective sample sizes89, outlying observations greater than three standard deviations from the mean of glucose2 were excluded prior to modeling, and parameters (target average acceptance probability, number of iterations) were manually tuned. Final models converged with potential scale reduction factor \({\widehat{\left(\right.R}\left.\right)}\le 1.01\)89,90.
Significance was evaluated using 95% credible intervals (CIs). Significant group estimates for glucose2 (γ20) provided support for H1. Significantly variable individual estimates for glucose2 (u2j) provided support for H2. Variation was operationalized with respect to the tau matrix and quantified using the test for practical equivalence with region bounds \(\left[0,0.2* {{SD}}_{y}\right]\)91,92. Optimal cognitive performance was estimated as the minima (for RT) or maxima (for accuracy) of quadratic curves relating glucose to cognition. It was interpreted with respect to percent deviation from typical cognition (i.e., group and individual intercepts). To localize optimal performance, we predicted cognitive performance over the domain of glucose (centered and scaled: [−4, 4], step size = 0.05) by averaging draws (n = 1,000) from the expectation of the posterior predictive distribution77. Summary statistics are reported as weighted averages across EMA completion samples, and predictions were centered around participant-level intercepts for visualization. Additional model formulas and R syntax are provided in Supplementary Note 1.
To evaluate the impact of observation vs. sample selection biases, models were run for each cognitive outcome (DSM RT and accuracy, GCPT RT and accuracy) across three EMA completion cutoffs (≥50%, ≥66%, ≥80%). With low (e.g., ≥50%) completion, we risk sampling bias: EMA observations may be systematically missing when glucose is very low or very high. With high (e.g., ≥80%) completion, we risk selection bias: individuals excluded from analysis may differ systematically from those included in analysis. We only interpreted results that were significant across all completion cutoffs.
Aim 2 analysis: Examining individual differences in cognitive vulnerability to glucose fluctuations
We used data-driven lasso regression to identify participant characteristics that predicted individual differences in cognitive vulnerability to glucose fluctuations. Given dependencies between aims, Aim 2 analyses focused on cognitive outcomes for which Aim 1 hypotheses were supported. In lasso regression, strong predictors were selected from a larger feature space (n = 58 variables, described in Supplementary Table 3) that included standardized clinical, CGM, and demographic variables relevant to diabetes self-management. Hyperparameter tuning was performed using cv.glmnet with 10-fold cross-validation. Coefficients were estimated by refitting tuned models to the full dataset. This process was repeated 1,000 times using each EMA completion cutoff (≥50%, ≥66%, ≥80%). Predictors were considered robust if they were selected in over 50% of repetitions for all completion cutoffs.
Reporting summary
Further information on research design is available in the Nature Research Reporting Summary linked to this article.
Data availability
Data for the current study are available from the corresponding author upon reasonable request.
Code availability
Code to analyze and visualize data is available on GitHub, https://github.com/zwihawks/MomentaryCogT1D.
References
Van Belle, T. L., Coppieters, K. T. & Von Herrath, M. G. Type 1 diabetes: etiology, immunology, and therapeutic strategies. Physiol. Rev. 91, 79–118 (2011).
Ozougwu, J. C., Obimba, K. C., Belonwu, C. D. & Unakalamba, C. B. The pathogenesis and pathophysiology of type 1 and type 2 diabetes mellitus. J. Physiol. Pathophysiol. 4, 46–57 (2013).
Kumar, N. et al. Mild cognitive impairment in young type 1 diabetes mellitus patients and correlation with diabetes control, lipid profile, and high-sensitivity C-reactive protein. Indian J. Endocrinol. Metab. 22, 780 (2018).
Chaytor, N. S. et al. Clinically significant cognitive impairment in older adults with type 1 diabetes. J. Diabetes Complications 33, 91–97 (2019).
Shalimova, A. et al. Cognitive dysfunction in type 1 diabetes mellitus. J. Clin. Endocrinol. Metab. 104, 2239–2249 (2019).
Jin, C.-Y., Yu, S.-W., Yin, J.-T., Yuan, X.-Y. & Wang, X.-G. Corresponding risk factors between cognitive impairment and type 1 diabetes mellitus: A narrative review. Heliyon 8, e10073 (2022).
He, Z. & King, G. L. Microvascular complications of diabetes. Endocrinol. Metab. Clin. 33, 215–238 (2004).
Allen, K. V. et al. Effects of acute hypoglycemia on working memory and language processing in adults with and without type 1 diabetes. Diabetes Care 38, 1108–1115 (2015).
Ewing, F. M. E., Deary, I. J., McCrimmon, R. J., Strachan, M. W. J. & Frier, B. M. Effect of acute hypoglycemia on visual information processing in adults with type 1 diabetes mellitus. Physiol. Behav. 64, 653–660 (1998).
McAulay, V., Deary, I. J., Ferguson, S. C. & Frier, B. M. Acute hypoglycemia in humans causes attentional dysfunction while nonverbal intelligence is preserved. Diabetes Care 24, 1745–1750 (2001).
Mcaulay, V., Deary, I. J., Sommerfield, A. J., Matthews, G. & Frier, B. M. Effects of acute hypoglycemia on motivation and cognitive interference in people with type 1 diabetes. J. Clin. Psychopharmacol. 26, 143–151 (2006).
Sommerfield, A. J., Deary, I. J., McAulay, V. & Frier, B. M. Moderate hypoglycemia impairs multiple memory functions in healthy adults. Neuropsychology 17, 125 (2003).
Wright, R. J., Frier, B. M. & Deary, I. J. Effects of acute insulin-induced hypoglycemia on spatial abilities in adults with type 1 diabetes. Diabetes Care 32, 1503–1506 (2009).
Schächinger, H., Cox, D., Linder, L., Brody, S. & Keller, U. Cognitive and psychomotor function in hypoglycemia: response error patterns and retest reliability. Pharmacol. Biochem. Behav. 75, 915–920 (2003).
Cox, D. J. et al. Relationships between hyperglycemia and cognitive performance among adults with type 1 and type 2 diabetes. Diabetes Care 28, 71–77 (2005).
Bando, S. & Nozawa, A. Detection of driver inattention from fluctuations in vehicle operating data. Artif. Life Robot. 20, 28–33 (2015).
Cerino, E. S. et al. Variability in cognitive performance on mobile devices is sensitive to mild cognitive impairment: Results from the Einstein Aging Study. Front. Digit. Health 3, 1–17 (2021).
Arnold, K. D. & Rohn, K. C. Internet-Enabled Experience Sampling: Innovations in Signaling and Data Sources. in Advancing Educational Research With Emerging Technology 124–151 (IGI Global, 2020).
Hawks, Z. W. et al. Accurate prediction of momentary cognition from intensive longitudinal data. Biol. Psychiatry Cogn. Neurosci. Neuroimaging 8, 841–851 (2023).
Germine, L., Strong, R., Singh, S. & Sliwinski, M. J. Toward dynamic phenotypes and the scalable measurement of human behavior. Neuropsychopharmacology 1–8. https://doi.org/10.1038/s41386-020-0757-1 (2020).
Elbalshy, M. et al. Effect of divergent continuous glucose monitoring technologies on glycaemic control in type 1 diabetes mellitus: A systematic review and meta‐analysis of randomised controlled trials. Diabetic Med. 39, e14854 (2022).
Sherr, J. L. et al. Automated insulin delivery: benefits, challenges, and recommendations. A Consensus Report of the Joint Diabetes Technology Working Group of the European Association for the Study of Diabetes and the American Diabetes Association. Diabetes Care 45, 3058–3074 (2022).
Pyatak, E. A. et al. Impact of overnight glucose on next-day functioning in adults with Type 1 Diabetes: An exploratory intensive longitudinal study. Diabetes Care dc222008. https://doi.org/10.2337/dc22-2008 (2023).
Emmert-Streib, F. & Dehmer, M. High-dimensional LASSO-based computational regression models: regularization, shrinkage, and selection. Mach. Learn. Knowl. Extr. 1, 359–383 (2019).
Chung, F. et al. STOP questionnaire: a tool to screen patients for obstructive sleep apnea. J. Am. Soc. Anesthesiol. 108, 812–821 (2008).
Hingorjo, M. R., Qureshi, M. A. & Mehdi, A. Neck circumference as a useful marker of obesity: a comparison with body mass index and waist circumference. J. Pak. Med. Assoc. 62, 36 (2012).
Kawaguchi, Y. et al. Different impacts of neck circumference and visceral obesity on the severity of obstructive sleep apnea syndrome. Obesity 19, 276–282 (2011).
Dancey, D. R. et al. Gender differences in sleep apnea: the role of neck circumference. Chest 123, 1544–1550 (2003).
van Duinkerken, E. & Ryan, C. M. Diabetes mellitus in the young and the old: Effects on cognitive functioning across the life span. Neurobiol. Dis. 134, 104608 (2020).
Brands, A. M. A. et al. Cognitive performance, psychological well-being, and brain magnetic resonance imaging in older patients with type 1 diabetes. Diabetes 55, 1800–1806 (2006).
Hudson, A. N., Van Dongen, H. P. A. & Honn, K. A. Sleep deprivation, vigilant attention, and brain function: a review. Neuropsychopharmacology 45, 21–30 (2020).
Axelsson, J. et al. Sleepiness and performance in response to repeated sleep restriction and subsequent recovery during semi‐laboratory conditions. Chronobiol. Int. 25, 297–308 (2008).
Mota Albuquerque, P., Ribeiro Franco, C. M. & Sampaio Rocha-Filho, P. A. Assessing the impact of sleep restriction on the attention and executive functions of medical students: a prospective cohort study. Acta Neurol Belg 1–7 https://doi.org/10.1007/s13760-023-02250-w (2023).
Koa, T. B. & Lo, J. C. Neurobehavioural functions during variable and stable short sleep schedules. J. Sleep Res. 30, e13252 (2021).
Gosselin, D., De Koninck, J. & Campbell, K. Novel measures to assess the effects of partial sleep deprivation on sensory, working, and permanent memory. Front. Psychol. 8, 1607 (2017).
Seaquist, E. R., Teff, K. & Heller, S. R. Impaired Awareness of Hypoglycemia in Type 1 Diabetes: A Report of An NIDDK Workshop in October 2021. Diabetes Care 45, 2799–2805 (2022).
McNeilly, A. D. & McCrimmon, R. J. Impaired hypoglycaemia awareness in type 1 diabetes: lessons from the lab. Diabetologia 61, 743–750 (2018).
Schwartz, M. W., Krinsley, J. S., Faber, C. L., Hirsch, I. B. & Brownlee, M. Brain Glucose Sensing and the Problem of Relative Hypoglycemia. Diabetes Care 46, 237–244 (2023).
Kern, W. et al. Improving influence of insulin on cognitive functions in humans. Neuroendocrinology 74, 270–280 (2001).
Nesselroade, J. R. The warp and the woof of the developmental fabric. Visions of aesthetics, the environment, and development: The legacy of Joachim F. Wohlwill 213–240 (1991).
Sliwinski, M., Hoffman, L. & Hofer, S. Modeling retest and aging effects in a measurement burst design. In Individual pathways of change: Statistical models for analyzing learning and development (eds Molenaar, P. C. M. & Newell, K. M.) 37–50 (American Psychological Association, 2010). https://doi.org/10.1037/12140-003.
Vanek, J. et al. Obstructive sleep apnea, depression and cognitive impairment. Sleep Med. 72, 50–58 (2020).
Caporale, M. et al. Cognitive impairment in obstructive sleep apnea syndrome: a descriptive review. Sleep Breath. 25, 29–40 (2021).
Bubu, O. M. et al. Obstructive sleep apnea, cognition and Alzheimer’s disease: A systematic review integrating three decades of multidisciplinary research. Sleep Med. Rev. 50, 101250 (2020).
West, R. K. et al. Waist circumference is correlated with poorer cognition in elderly type 2 diabetes women. Alzheimer’s Dementia 12, 925–929 (2016).
Rodríguez-Fernández, J. M., Danies, E., Martínez-Ortega, J. & Chen, W. C. Cognitive decline, body mass index, and waist circumference in community-dwelling elderly participants: results from a nationally representative sample. J. Geriatr. Psychiatry Neurol. 30, 67–76 (2017).
West, N. A. et al. Adiposity, change in adiposity, and cognitive decline in mid‐and late life. J. Am. Geriatr. Soc. 65, 1282–1288 (2017).
Agiostratidou, G. et al. Standardizing clinically meaningful outcome measures beyond HbA1c for type 1 diabetes: A consensus report of the American Association of Clinical Endocrinologists, the American Association of Diabetes Educators, the American Diabetes Association, the Endo. Diabetes Care 40, 1622–1630 (2017).
Nevo-Shenker, M. & Shalitin, S. The impact of hypo- And hyperglycemia on cognition and brain development in young children with type 1 diabetes. Horm. Res. Paediatr. 94, 115–123 (2021).
Perfect, M. M. et al. Sleep, glucose, and daytime functioning in youth with type 1 diabetes. Sleep 35, 81–88 (2012).
Jun, J. E. et al. Continuous glucose monitoring defined glucose variability is associated with cardiovascular autonomic neuropathy in type 1 diabetes. Diabetes Metab. Res. Rev. 35, e3092 (2019).
McCrimmon, R. J. Consequences of recurrent hypoglycaemia on brain function in diabetes. Diabetologia 64, 971–977 (2021).
Cameron, F. J., Northam, E. A. & Ryan, C. M. The effect of type 1 diabetes on the developing brain. Lancet Child Adolesc. Health 3, 427–436 (2019).
Wrighten, S. A., Piroli, G. G., Grillo, C. A. & Reagan, L. P. A look inside the diabetic brain: Contributors to diabetes-induced brain aging. Biochim. Biophys. Acta Mol. Basis. Dis. 1792, 444–453 (2009).
Vasudevan, S., Saha, A., Tarver, M. E. & Patel, B. Digital biomarkers: Convergence of digital health technologies and biomarkers. npj Digit. Med. 5, 36 (2022).
Passell, E. et al. Cognitive test scores vary with choice of personal digital device. Behav. Res. Methods 53, 2544–2557 (2021).
Nicosia, J. et al. To BYOD or Not: Are Device Latencies Important for Bring Your Own Device (BYOD) Smartphone Cognitive Testing? Behav. Res. Methods 55, 2800–2812 (2023).
Brands, A. M. A., Biessels, G. J., De Haan, E. H. F., Kappelle, L. J. & Kessels, R. P. C. The effects of type 1 diabetes on cognitive performance: a meta-analysis. Diabetes Care 28, 726–735 (2005).
McCrimmon, R. J., Ryan, C. M. & Frier, B. M. Diabetes and cognitive dysfunction. Lancet 379, 2291–2299 (2012).
D’Ardenne, K., Savage, C. R., Small, D., Vainik, U. & Stoeckel, L. E. Core neuropsychological measures for obesity and diabetes trials: initial report. Front. Psychol. 11, 554127 (2020).
Mascarenhas Fonseca, L. et al. Glycemic variability and fluctuations in cognitive status in adults with type 1 diabetes (GluCog): observational study using ecological momentary assessment of cognition. JMIR Diabetes 8, e39750 (2023).
Sliwinski, M. J. et al. Reliability and validity of ambulatory cognitive assessments. Assessment 25, 14–30 (2018).
Pylyshyn, Z. W. & Storm, R. W. Tracking multiple independent targets: Evidence for a parallel tracking mechanism. Spat. Vis. 3, 179–197 (1988).
Treviño, M. et al. How do we measure attention? Using factor analysis to establish construct validity of neuropsychological tests. Cogn. Res. Princ. Implic. 6, 1–26 (2021).
Wechsler, D. WAIS‐III administration and scoring manual. The Psychological Corporation, San Antonio, TX. Wechsler, D.(1997). WAIS III Administration and Scoring Manual. The Psychological Corporation: San Antonio, TX (1997).
Hartshorne, J. K. & Germine, L. T. When does cognitive functioning peak? The asynchronous rise and fall of different cognitive abilities across the life span. Psychol. Sci. 26, 433–443 (2015).
Chaytor, N. S. et al. Construct validity, ecological validity and acceptance of self-administered online neuropsychological assessment in adults. Clin.Neuropsychol. 35, 148–164 (2021).
Singh, S. et al. Ecological momentary assessment of cognition in clinical and community samples: reliability and validity study. J. Med. Internet Res. 25, e45028 (2023).
Fortenbaugh, F. C. et al. Sustained attention across the life span in a sample of 10,000: Dissociating ability and strategy. Psychol. Sci. 26, 1497–1510 (2015).
Esterman, M., Noonan, S. K., Rosenberg, M. & Degutis, J. In the zone or zoning out? Tracking behavioral and neural fluctuations during sustained attention. Cerebr. Cortex 23, 2712–2723 (2013).
Pastore, R. E. & Scheirer, C. J. Signal detection theory: Considerations for general application. Psychol. Bull. 81, 945 (1974).
Shah, V. N., Laffel, L. M., Wadwa, R. P. & Garg, S. K. Performance of a factory-calibrated real-time continuous glucose monitoring system utilizing an automated sensor applicator. Diabetes Technol. Ther. 20, 428–433 (2018).
American Diabetes Association. Standards of Care in Diabetes - 2023. Diabetes Care 46, S1–S291 (2023).
R Core Team. R: A language and environment for statistical computing. (R Foundation for Statistical Computing, Vienna, Austria, 2023). https://www.R-project.org/.
Wickham, H. et al. Welcome to the Tidyverse. J. Open Source Softw. 4, 1686 (2019).
Goodrich, B., Gabry, J., Ali, I. & Brilleman, S. rstanarm: {Bayesian} applied regression modeling via {Stan} (2024). https://mc-stan.org/rstanarm/
Kay, M. tidybayes: Tidy Data and Geoms for Bayesian Models (2023). https://doi.org/10.5281/zenodo.1308151.
Friedman, J., Hastie, T. & Tibshirani, R. Regularization paths for generalized linear models via coordinate descent. J. Stat. Softw. 33, 1–22 (2010).
Simon, N., Friedman, J., Hastie, T. & Tibshirani, R. Regularization paths for Cox’s proportional hazards model via coordinate descent. J. Stat. Softw. 39, 1–13 (2011).
Segev, N. et al. Continuous glucose monitoring in the intensive care unit following total pancreatectomy with islet autotransplantation in children: Establishing accuracy of the dexcom g6 model. J. Clin. Med. 10, 1893 (2021).
Battelino, T. et al. Continuous glucose monitoring and metrics for clinical trials: an international consensus statement. Lancet Diabetes Endocrinol. 11, 42–57 (2023).
Kovatchev, B. P. Measures of risk and glucose variability in adults versus youths. Diabetes Technol Ther. 17, 766–769 (2015).
Service, F. J. et al. Mean amplitude of glycemic excursions, a measure of diabetic instability. Diabetes 19, 644–655 (1970).
Russell, S. J. & Beck, R. W. Design considerations for artificial pancreas pivotal studies. Diabetes Care 39, 1161–1167 (2016).
Carr, A. L. J., Evans-Molina, C. & Oram, R. A. Precision medicine in type 1 diabetes. Diabetologia 65, 1854–1866 (2022).
Holt, R. I. G. et al. The management of type 1 diabetes in adults. A consensus report by the American Diabetes Association (ADA) and the European Association for the Study of Diabetes (EASD). Diabetes Care 44, 2589–2625 (2021).
Law, C. W. et al. A guide to creating design matrices for gene expression experiments. F1000Res 9, 1444 (2020).
Chatterjee, S. & Greenwood, A. G. Note on second‐order polynomial regression models. Decis. Sci. 21, 241–245 (1990).
Vehtarh, A., Gelman, A., Simpson, D., Carpenter, B. & Burkner, P. C. Rank-normalization, folding, and localization: an improved (formula presented) for assessing convergence of MCMC (with Discussion)*†. Bayesian Anal. 16, 667–718 (2021).
Gelman, A. & Rubin, D. B. Inference from iterative simulation using multiple sequences. Stat. Sci. 7, 457–472 (1992).
Makowski, D., Ben-Shachar, M. & Lüdecke, D. bayestestR: Describing effects and their uncertainty, existence and significance within the Bayesian Framework. J. Open Source Softw. 4, 1541 (2019).
Kruschke, J. K. Rejecting or accepting parameter values in Bayesian estimation. Adv. Methods Pract. Psychol. Sci. 1, 270–280 (2018).
Brose, A., Lövdén, M. & Schmiedek, F. Daily fluctuations in positive affect positively co-vary with working memory performance. Emotion 14, 1–6 (2014).
Sliwinski, M. J., Smyth, J. M., Hofer, S. M. & Stawski, R. S. Intraindividual coupling of daily stress and cognition. Psychol. Aging 21, 545–557 (2006).
Acknowledgements
The authors wish to thank individuals who participated in this study for their contributions. We also thank Donna Desjardins, Corey Reid, Keri Whitaker, Shannon Angelis, Patricia Bourne, and Cornelia Dalton-Bakes for their contributions to study recruitment and management. This research was supported by grants from the National Institutes of Health (R01 DK121240 to LG and NC; R01 MH121617 to LG; F32 MH127812 to ZWH; K99 AG082864 to LMF; F31 MH124291 to MRF; UL1 TR001878 to MRR; R01 DK122603, U01 DK135131, U01 DK127392, R01 AG060153, R01 AG060542, and R01 AG058883 to RP), the Brain & Behavior Research Foundation (Young Investigator Award to LG), and the Alzheimer’s Association (AARFD-21-851373 to LMF). This content is solely the responsibility of the authors and does not necessarily represent the official views of the National Institutes of Health, the Brain and Behavior Research Foundation, or the Alzheimer’s Association.
Author information
Authors and Affiliations
Contributions
L.T.G. and N.S.C. designed the study, acquired funding, and supervised the project. Z.W.H. analyzed the data, wrote the manuscript, and incorporated coauthor revisions. R.S.W., J.B., Y.K., R.P., M.R., and S.R.R. contributed to clinical data collection and provided clinical oversight. L.J., E.G., K.J., R.W.S., and I.X. contributed to data processing and management. E.D.B., H.V.D., M.R.F., and M.C. provided statistical support and feedback. L.M.F., MS, R.S.W., S.S., N.S.C., and L.T.G. contributed to the conceptualization and methodology of the paper. All authors provided critical feedback during revision and approved the final version of this manuscript.
Corresponding author
Ethics declarations
Competing interests
LG is on the Board of Directors of the Many Brains Project, a 501c3 nonprofit organization that disseminates cognitive tests. NC is a paid consultant for Adaptelligence, LLC. ZWH and MRF have received consulting fees from Blueprint Health. SS has received consulting fees from Aphelion Capital. RSW has participated in multicenter clinical trials through her institution sponsored by Eli Lilly Novo Nordisk, Insulet, Tandem, Amgen, MannKind and Diasome and has used devices donated by DexCom in research studies. YCK has had product support from Dexcom Inc. and Tandem Inc., is on an advisory board for Novo Nordisk, USA, and has participated in multicenter clinical trials through his institution funded by Dexcom, Tandem, Medtronic and Mannkind. HVD is a paid consultant for Jazz Pharmaceuticals. The authors declare no other competing interests.
Additional information
Publisher’s note Springer Nature remains neutral with regard to jurisdictional claims in published maps and institutional affiliations.
Supplementary information
Rights and permissions
Open Access This article is licensed under a Creative Commons Attribution 4.0 International License, which permits use, sharing, adaptation, distribution and reproduction in any medium or format, as long as you give appropriate credit to the original author(s) and the source, provide a link to the Creative Commons licence, and indicate if changes were made. The images or other third party material in this article are included in the article’s Creative Commons licence, unless indicated otherwise in a credit line to the material. If material is not included in the article’s Creative Commons licence and your intended use is not permitted by statutory regulation or exceeds the permitted use, you will need to obtain permission directly from the copyright holder. To view a copy of this licence, visit http://creativecommons.org/licenses/by/4.0/.
About this article

Cite this article
Hawks, Z.W., Beck, E.D., Jung, L. et al. Dynamic associations between glucose and ecological momentary cognition in Type 1 Diabetes. npj Digit. Med. 7, 59 (2024). https://doi.org/10.1038/s41746-024-01036-5
Received:
Accepted:
Published:
DOI: https://doi.org/10.1038/s41746-024-01036-5
