
Abstract
Amidst the contemporary shifts within early childhood education (ECE) in China, the significance of multimedia tools and their effective deployment by educators is increasingly paramount. Situated within the theoretical underpinnings of the Technology Acceptance Model (TAM), this inquiry elucidates the intricate dynamics between the Perceived Usefulness (PU) and Perceived Ease of Use (PEU) of said tools and their consequential influence on educators’ effectiveness. Empirical data gleaned from a rigorous quantitative survey of 400 educators within ECE institutions in Guangdong Province underscore the importance of PU and PEU as determinants of the successful assimilation of multimedia tools, thereby influencing the pedagogical efficacy of educators. There are several implications of this investigation. The study primarily contributes to the academic discourse by bridging a discernible lacuna and offering insights into multimedia tool adoption dynamics within the specific milieu of ECE in China. The findings have implications for a spectrum of stakeholders, from multimedia tool developers to educational policy-makers, underscoring that tools, to be truly transformative, must be perceived as both intrinsically valuable and user-centric. Notwithstanding the robustness of the findings, the geographically circumscribed focus on Guangdong Province warrants prudence in generalizing insights across China. This suggests the need for future scholarly endeavours to broaden the research purview across diverse provinces, aspiring to provide a more holistic understanding of the dynamics of multimedia tool integration within China’s expansive ECE domain.
Introduction
In the contemporary landscape, rapid advancements in multimedia technologies are significantly transforming educational practices worldwide (Shunkov et al., 2022). This technological shift is especially pronounced in China’s Early Childhood Education (ECE) sector (Nisak et al., 2022), where professionals educators play a pivotal role. These roles emphasise their contributions that extend beyond conventional teaching to a wide range of nurturing, mentoring, and developmental responsibilities. The emergence of the educator aligns with directives from China’s central government in 2019 (Central People’s Government of the People’s Republic of China, 2019). However, as multimedia tools become increasingly embedded in educational arenas, educators are challenged with leveraging their capabilities to optimize their effectiveness (Sudarsana, 2018).
Using multimedia tools extends beyond mere access; it encompasses acceptance and skilful implementation of such technologies. In this context, the Technology Acceptance Model (TAM) offers a comprehensive framework to decipher the variables affecting technology utilization (Davis et al., 1989). A noticeable void exists in the current literature regarding the influence of multimedia on educator effectiveness in China, signalling a research opportunity.
Addressing this gap, our study delves into how multimedia applications, grounded in TAM principles, impact educator effectiveness in Guangdong Province, China. The research makes multiple contributions. Primarily, it shapes educational strategies and methodologies by shedding light on factors influencing educator effectiveness in multimedia applications. Furthermore, employing TAM to analyse multimedia dynamics as used by educators, this study introduces a fresh perspective, especially considering the specific cultural and regional background.
This research endeavours to elucidate multimedia utilization and its repercussions on educators’ effectiveness. We aim to explore the interplay of TAM variables, including Multimedia of Perceived Usefulness (PU), Perceived Ease of Use (PEU), and their bearing on Educators’ Effectiveness (EE) in Guangdong Province, China. To realize this, a quantitative survey method is adopted, targeting educators from the province’s ECE domain.
Our study’s paramount contribution lies in the novel application of TAM to ECE in China. The insights promise to demystify the determinants fuelling the successful integration of multimedia technologies in education, potentially amplifying educator effectiveness and enriching ECE quality (Livingstone et al., 2019). Consequently, this inquiry stands at the juncture of technology acceptance, education, and productivity, heralding both theoretical innovations and tangible enhancements in the domain.
Literature review
Conceptualization and role of educators in early childhood education
China’s evolving ECE landscape, particularly in Guangdong Province, has led to the emergence of educators as a distinctive role that unifies educational and caregiving responsibilities (Kong, 2023; Zhao et al., 2022). These professionals cultivate children’s holistic development and facilitate a vital communication bridge between homes and educational institutions (Arvola et al., 2021). Nevertheless, Guangdong’s flourishing ECE sector must also grapple with maintaining quality standards and addressing the scarcity of adequately trained educators (Oon et al., 2019).
The educator role originated from the unique societal and policy context in China. The pivotal turning point came in 2019 when the Chinese central government decreed the provision of care services for infants and toddlers under three years of age (Central People’s Government of the People’s Republic of China, 2019). Consequently, the scope of the role expanded beyond traditional educational duties to incorporate professional caregiving services. This broader remit led to reconsidering the term ECE educator and represents a more refined classification within ECE, acknowledging these professionals’ distinct and substantial contributions during children’s critical early developmental stages.
The emergence of this role has its challenges. The scarcity of qualified educators and escalating demand for ECE services have heightened concerns regarding the quality of care and education in some contexts. Moreover, the inconsistent availability of ongoing professional development opportunities, critical for enhancing educators’ competencies and practices, compounds these challenges (Logan et al., 2020).
Efforts towards improving ECE are evident in China’s ongoing policy initiatives, encompassing national and regional strategies to enhance early childcare services (Central People’s Government of the People’s Republic of China, 2019; Guangdong Provincial People’s Government, 2020). As the integration of new media technology becomes more commonplace in ECE settings, educators are poised at the intersection of numerous opportunities and challenges within this rapidly evolving educational milieu.
Multimedia technologies in early childhood education: adoption and integration
Multimedia technologies, a critical facet of modern education, encompass interactive, digital, and combined media to enhance teaching and learning experiences (Neo and Neo, 2004). This includes digital tools, such as tablets, software applications, video and audio tools, interactive whiteboards, and online platforms. They enable a combination of text, graphics, sound, animation, and video to create engaging, multisensory learning environments (Kamran, 2019).
In today’s technological environment, these multimedia technologies have markedly influenced global ECE practices, including those in China. Recognizing the pivotal role technology plays in education, the Chinese government has been proactively fostering its integration, catalysing technology adoption within ECE environments (Adarkwah, 2021).
Many digital tools and resources have been ingeniously woven into China’s ECE curricula to enhance children’s learning experiences and facilitate the acquisition of essential 21st-century competencies (Weng and Li, 2018). In addition, the proliferation of multimedia technologies has diversified communication and collaboration channels among educators, children, and parents, enabling remote and flexible learning paradigms (Anderson and Rivera Vargas, 2020). Government initiatives, such as the “Internet Plus” education strategy and the “National Outline for Medium and Long-term Education Reform and Development (2010–2020)”, illustrate China’s commitment to encouraging technology use in educational settings, including ECE (Li et al., 2016).
However, the extent of multimedia technology integration within Chinese ECE contexts varies and is influenced by factors such as geographical location, funding availability, and access to resources (Luo et al., 2023). While urban ECE institutions equipped with advanced digital resources are typically at the vanguard of this shift, rural institutions grapple with infrastructural, financial, and access-related challenges (Hu et al., 2021).
Given this scenario, there is a critical need for professional development and training programs that equip educators with the necessary skills to efficiently integrate multimedia technologies into their pedagogical practices. Thus, understanding the factors contributing to successful technology adoption in Chinese ECE settings and the specific roles and experiences of educators within technology-enhanced ECE environments is a crucial avenue for future research.
Implications of multimedia technologies in early childhood education: opportunities and challenges
Multimedia technologies’ integration within ECE offers notable benefits but, at the same time, poses some challenges. A thorough understanding of both aspects is instrumental to enhancing the practical application of technology in ECE settings.
Multimedia technologies stand to significantly improve children’s learning experiences (Naluwooza et al., 2023). They foster learner engagement, enable personalized learning experiences, and expand access to diverse learning resources (Ismoilovich and Ravshanbekovich, 2023). With multimedia-enhanced learning activities, children can develop critical 21st-century skills such as creativity, problem solving, and critical thinking (Alzubi, 2023). Furthermore, multimedia technologies offer educators refined methods for assessing learner progress and addressing individual needs. They enhance stakeholder communication and collaboration and provide the groundwork for flexible, remote learning environments. Finally, they can foster continuity between home and school learning environments (Sonnenschein et al., 2021).
However, incorporating multimedia technologies into ECE settings is challenging (Lindeman et al., 2021). For example, excessive screen time poses potential risks to children’s physical health and social development (Kaimara et al., 2022). Organizations such as the American Academy of Paediatrics advise limited screen time for young children and underscore the importance of educator and parental supervision (Przybylski, 2019).
Educators may also need help integrating technology into their practices due to technical skill gaps, inadequate training, or resource limitations (Hu et al., 2021). These challenges necessitate ongoing professional development and adequate support for educators.
The digital divide—a disparity in access to digital resources—can intensify existing inequalities in educational opportunities among children from different socioeconomic backgrounds (Reddick et al., 2020). Thus, ensuring equitable access to multimedia technologies is critical to delivering inclusive, high-quality ECE experiences.
Hence, despite the manifold benefits multimedia technologies offer for ECE, it is vital to navigate the associated challenges to ensure meaningful, effective, and equitable technology integration. Understanding educators’ experiences within technology-enhanced ECE environments and identifying the factors influencing successful technology adoption are critical steps towards optimizing multimedia technology use in early childhood education.
The intersection of multimedia efficacy and educator efficiency: bridging prior research with current inquiry
The multimedia integration in ECE is not just a matter of technological innovation; it represents a significant shift in pedagogical practices and educator roles. This nexus between technology and education offers a compelling backdrop to understand the evolving role of educators and the factors that affect their effectiveness.
Mertala (2019) highlighted the nuanced roles of teachers beyond imparting education. They also attend to students’ emotional, physical, and social needs and their role in society. Teachers’ beliefs and attitudes become paramount when introducing technology, especially multimedia tools, into the educational sphere. Mertala suggests that there is a critical role that educators’ beliefs play in shaping their approach to technology. However, while Mertala brings to light the importance of beliefs, there is a gap in understanding how these beliefs directly influence the effectiveness of educators in utilizing multimedia in their teaching.
Drawing insights from Latini et al. (2020), the choice of medium for reading, whether print or digital, has been shown to affect comprehension processes. Their study suggests that participants exhibited more integrative processing with printed than digital materials. This raises critical questions about the potential challenges educators might face while leveraging multimedia resources. If comprehension is affected by the medium, then understanding how this affects the effectiveness of educators in imparting knowledge remains to be fully explored.
Li et al. (2019) extensively analysed multimedia learning trends over two decades. While they identified prevailing themes and trends, such as the importance of cognitive load and animation in multimedia learning, their practical application and impact on educator effectiveness are underresearched. Knowing the trends is essential, but how they align with the day-to-day practices of educators and their efficacy in diverse educational settings is an area our study seeks to explore further.
Gong (2022) discussed the confluence of multimedia technology and children’s drama education. The study highlighted the promising potential of human–computer interaction technologies in preschool drama education. However, while the tools and methodologies are advancing, understanding the nuances of how educators adapt to and effectively implement these tools in their curriculum is a dimension that needs to be deeply examined by Gong.
Last, Coskun and Cagiltay (2022) used eye-tracking metrics to understand learners’ cognitive processes in animated multimedia settings. Their insights provide a nuanced understanding of the relationship between design, attention, and learning outcomes. However, how educators can harness this understanding to improve their effectiveness, especially when animations and simulations become standard tools, remains an area with potential for further inquiry.
Our research aims to fill the gaps identified above by examining the direct impact of multimedia tools and methodologies on the effectiveness of educators. We seek to understand how these multimedia advancements, while promising on the surface, translate into real-world effectiveness in educational contexts, especially in Guangdong Province. Our inquiry aims to provide a more grounded perspective that juxtaposes the promise of multimedia with the practical realities and challenges faced by educators.
Theoretical framework and hypothesis development
Overview of the Technology Acceptance Model (TAM)
The Technology Acceptance Model (TAM), developed by Davis et al. (1989), is a seminal theoretical framework in information systems (Granić, 2023). Crafted to predict and understand user acceptance and utilization of information technology, TAM pivots around two principal determinants: Perceived Usefulness (PU) and Perceived Ease of Use (PEU) (Warsono et al., 2023).
As shown in Fig. 1, both PU and PEU are directly linked to an individual’s Behavioural Intention to Use (BIU), a system within the TAM framework. When educators perceive multimedia technology to be advantageous (PU) and user-friendly (PEU), their intention to integrate and employ that technology (BIU) increases. This intention ultimately materializes as Actual System Use, representing the integration and use of multimedia tools in their teaching methods.
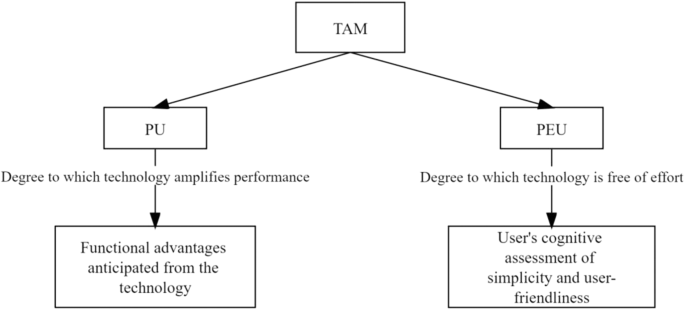
Technology Acceptance Model.
In the context of our research, which probes the effects of multimedia on the effectiveness of educators, TAM serves as an instrumental analytical framework. Utilizing TAM, we can systematically analyse how educators evaluate multimedia technologies regarding their perceived advantages and user accessibility. Furthermore, by integrating specific external variables pertinent to the educational realm—such as institutional guidelines, pedagogical training, or curriculum directives—we can direct our insights towards the factors influencing the acceptance and adaptation of multimedia tools by educators.
Building on these theoretical foundations, our research model and hypotheses will explore the complex interplay between perceived ease of use, perceived usefulness, and the diverse external variables that influence an educator’s decision to incorporate multimedia technologies into educational strategies.
Applying TAM to this study
The TAM has become instrumental in probing the determinants driving technology adoption, especially within educational landscapes. It is highly pertinent when integrating multimedia technology into teaching paradigms. At the heart of this examination lies the quest to discern educators’ perspectives on the benefits and ease of using such multimedia tools. Based on the solid foundations of TAM, the present study seeks to debunk the hidden correlations between educators’ adoption of multimedia technology and their subsequent effectiveness.
Two pivotal independent variables underscore this inquiry. First, the PU serves as a barometer measuring the extent of educators’ conviction that multimedia tools can bolster the quality of their pedagogical endeavours. This translates into gauging the level of agreement among educators that multimedia-rich content can curate a learning experience that is in-depth and interactive for students. Complementing this is the second variable, PEU, which focuses on the anticipations of educators regarding how seamlessly multimedia technology can be woven into their teaching fabric. The underlying contemplation is whether educators perceive these technologies as intuitive additions to their teaching arsenal, bereft of any substantial impediments.
By synthesizing these several strands, the focal point that emerges is the dependent variable of Educators’ Effectiveness (EE). This encapsulates the tangible, positive repercussions observed when multimedia instruments are deployed in instructional settings. Effectiveness is broadly conceived, ranging from a palpable surge in student engagement to discernible strides in learning outcomes or even the clarity of feedback on delivered content.
Based on the above, we formulate the following hypotheses. Figure 2 shows the variables and their hypothesized relationships.
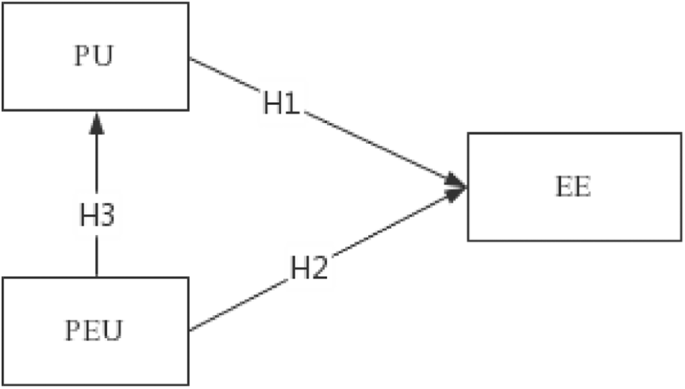
Research Model.
Hypothesis 1 (H1): The PU of multimedia tools significantly affects EE.
Hypothesis 2 (H2): The PEU of multimedia tools significantly affects EE.
Hypothesis 3 (H3): PEU significantly affects the PU of multimedia tools among educators.
Methodology
Questionnaire design and measurement items
This study leverages a quantitative research design and employs a meticulously crafted questionnaire to extract insights from educators, parents, and other pivotal stakeholders within ECE in Guangdong Province, China. The focus is to elucidate participants’ demographics and perceptions of multimedia technology’s PU and PEU and its influence on the effectiveness of educators in ECE.
Our questionnaire is influenced by the foundational works of Davis et al. (1989) and Seligman (2001) for the PU and PEU dimensions. Notably, while Seligman’s original research revolved around computer-based patient records (CBPR), we adapted his items, replacing “CBPR” with “multimedia technology in ECE” to better fit our study context. A 5-point Likert scale was used for all items covered by the variables, with 1 indicating strong disagreement and 5 indicating strong agreement.
Below Table 1 presents the dimensions, their corresponding items, the item number, and the originating sources:
Deploying this questionnaire on Questionnaire Star (https://www.wjx.cn/) aligns with our commitment to accessibility and participant data protection. This online format guarantees a streamlined data collection process, reaching a wider sample base. Furthermore, all collected data are safeguarded through strict measures, ensuring participant confidentiality. The gathered data will be statistically analysed to identify pertinent patterns and relationships.
Sampling technique and sample size
A cluster sampling technique was employed to ensure that the study sample adequately represented the target population of educators in Guangdong Province. The process involves grouping participants based on their roles and geographical locations and ensures the inclusion of diverse perspectives while accounting for the potential variation in experiences with technology-enhanced ECE across different settings.
Utilizing Cochran’s (1977) method for determining sample size in survey research, it was possible to determine the ideal sample size for this study.
where: n0 = required sample size; Z = Z score (1.96 for a 95% confidence level); p = estimated proportion of the population with the characteristic of interest (0.5, if unknown); q = complementary proportion (1-p); E = margin of error (e.g., 0.05 for a 5% margin of error)
As reported by Shen (2022) and cited by the official website of the National People’s Congress of the PRC (2022), there are ~90,000 educators employed in over 5400 early childhood education institutions within Guangdong Province.
To initiate the process, the complementary proportion (q) is computed:
Subsequently, the values are input into Cochran’s formula:
Consequently, with a margin of error of 5%, the estimated sample size for this study is ~384 participants.
Using Cochran’s formula and the stratified random sampling technique will enhance the study’s internal and external validity, ensuring that the findings can be generalized to the broader population of educators within Guangdong Province.
Based on the data needs described above, we employed a systematic and purposive sampling strategy to select participating institutions and educators within our data sampling pool. Based on information from the Infant Care and Early Development Industry Association of Guangdong Province China (2023), 225 ECE member institutions are located across various cities in Guangdong Province, China.
Our first step involved the systematic sampling of institutions. We selected every fifth institution from the Infant Care and Early Development Industry Association list to ensure broad coverage. Given our population size of 225 institutions, this systematic selection yielded a sample of 45 institutions.
Following the selection of institutions, we employed purposive sampling to select educators within these chosen establishments. Our goal is to achieve a target sample size of 384 educators. Therefore, we aim to disseminate approximately ten questionnaires per institution, adjusting the exact number slightly based on the total number of educators available at each institution.
Data analysis
Utilizing the SPSSAU tool (The SPSSAU Project, 2023), this study used descriptive and inferential statistical methodologies. Descriptive statistics offered insight into data features, encompassing central tendencies and variability metrics. The questionnaire’s reliability, construct validity, and item analysis were assessed.
Structural equation modelling (SEM) was then employed through the abovementioned analysis tool to decipher relationships between observable variables and underlying constructs, such as the influence of Innovative Behaviour on Professional Community and Shared Leadership. Through these methods, the study empirically addressed the research hypotheses.
Results and analysis
From August 2 to August 11, 2023, we distributed questionnaires to 450 educators affiliated with institutions that are members of the Infant Care and Early Development Industry Association. We received 400 valid responses; the response rate was high at 89%, representing substantial participation from the targeted educators.
Participants’ demographic information
This section provides a detailed breakdown of the demographic data of the participants who took part in the survey, as shown in Table 2. A total of 400 respondents participated, and their demographic information spans five main categories: gender, age, education level, years of experience in their current role, and the location of their ECE institution.
From Table 2, most participants were female, representing 70.75% of the total respondents. Most participants were between the ages of 25 and 45, with the largest group being those aged 35–45. The predominant education level was a vocational/technical diploma, held by 48.75% of participants. Most respondents had 1–3 years of experience in their current role, and a significant majority, 90.25%, were associated with ECE institutions located in urban areas.
Reliability and validity
In our study, the reliability of the questionnaire was measured using Cronbach’s alpha for the 24 items, as shown in Table 3. Based on a sample of 400 respondents, the calculated Cronbach’s alpha was 0.958. Generally, in social science research a Cronbach’s alpha value above 0.7 is acceptable, suggesting that the questionnaire items have good internal consistency.
As shown in Table 4, the KMO statistic was calculated to be 0.966. A KMO value close to 1 suggests that patterns of correlations are relatively compact, and, hence, factor analysis should yield distinct and reliable factors. Specifically, KMO values greater than 0.8 are considered significant, indicating that the dataset is suitable for factor analysis. Moreover, Bartlett’s Test data also support this view, as shown in Table 4.
Items analysis
The data in Table 5 compare the means (M) and standard deviations (SD) for PU, perceived PEU, and EE between the low and high groups. All items for PU, PEU, and EE consistently show statistically significant differences between the low and high groups, as evidenced by p values that are all <0.01. The asterisks also reinforce this, which denote significance at the 0.01 level.
For the PU items, the low group’s mean values range between 2.58 and 2.82, whereas the high group’s mean values are between 4.32 and 4.51. The t values (or CR values) for these comparisons are all significantly large, ranging from 10.090 to 13.023, further affirming the robustness of the difference between the two groups. Similarly, for the PEU items, the low group’s means are between 2.72 and 2.94, while the high group’s means span from 4.39 to 4.52. Their t values (CR) fluctuate from 10.412 to 12.476, emphasizing the marked distinction in perceived ease of use between the two groups. Last, concerning EE items, the low group’s means are from 2.49 to 2.85, while the high group’s means are more elevated, ranging from 4.37 to 4.58. The t values for these items vary between 10.803 and 14.269, with the latter being the highest t value in the entire table, indicating the most significant difference observed between the low and high groups for item EE-1.
Hence, the evident difference in mean scores across all items for PU, PEU, and EE between the low and high groups suggests a marked difference in the perceptions of usefulness, ease of use, and effectiveness of multimedia tools between these two categories. The consistently significant p values solidify this observation, underscoring that these differences are statistically significant and not due to random chance.
Average
Figure 3 shows the average scores for each item, giving us an overall picture of respondents’ attitudes and values towards the question.

Average.
For the PU measures, the average responses range between 3.795 and 3.875. This suggests that participants, on average, leaned towards agreeing that the multimedia tools were helpful, as these scores are closer to 4 on a 5-point scale. The slight variations within this range are subtle, with PU-4 having the highest mean value of 3.875, indicating that this aspect of perceived usefulness had the highest agreement among respondents. Regarding the PEU domain, the average responses span from 3.845 to 3.935, which implies that participants typically found multimedia tools relatively easy to use. The highest average value is for PEU-3 at 3.935, which might indicate a specific feature or aspect of the multimedia tool that was particularly intuitive for the respondents. For EE, the mean values fluctuate between 3.853 and 3.947. These values again tilt towards the higher end of the scale, signifying that, on average, participants felt that multimedia tools enhanced the effectiveness of educators. Within this domain, EE-7 registers the highest mean value of 3.947, suggesting that participants most recognized or valued this specific dimension of effectiveness.
SEM analysis
Table 6 presents various metrics assessing the fit of a statistical model.
A central focus is on the chi-square statistic (χ2 = 394.034) with degrees of freedom (df) of 249. Although the p value is significant at 0.000, caution should be exercised when interpreting this result, as chi-square is known to be sensitive to sample size. A more informative indicator might be the chi-square to degrees of freedom ratio (χ2/df). This ratio stands at 1.582, well below the recommended threshold of 3, suggesting an acceptable fit of the model.
Several goodness-of-fit indices support this observation: the goodness-of-fit index (GFI = 0.927), comparative fit index (CFI = 0.983), normed fit index (NFI = 0.955), and nonnormed fit index (NNFI = 0.981) all exceed the desired threshold of 0.9. Moreover, the root mean square error of approximation (RMSEA) is 0.038. Values below 0.05 frequently signify a strong alignment with the data, although values up to 0.08 are acceptable. This observation further reinforces the proposition of a model that fits well. The evaluation above is additionally supported by the RMSEA 90% Confidence Interval, which spans from 0.031 to 0.045, falling within the permitted range.
In addition, the standardized root mean square residual (SRMR) of 0.024 further supports the adequacy of the model’s fit, as values below 0.1 are typically considered favourable. Other indices, such as the AGFI (0.912), IFI (0.983), PGFI (0.769), PNFI (0.862), and PCFI (0.887), further reinforce the robustness of the model’s fit to the observed data.
The presented fit indicators consistently signal a satisfactory model fit to the data, making it a robust foundation for drawing subsequent inferences.
Table 7 comprehensively delineates the predictive relationships between various constructs. Examining these relationships offers a panorama of the associations and their strengths, highlighting the constructs’ ability to predict various outcomes.
The nonstandardized regression coefficients and standard errors present the raw associations between the predictor and the outcome variables. Meanwhile, the z (critical ratio value) and p values provide statistical indicators for the significance of these relationships. The standardized regression coefficients provide insight into the relative strength of the relationships, adjusting for the scales of the variables.
A closer look at the relationships suggests that PU, PEU, and EE are significant predictors for their respective outcome variables, as evidenced by p values consistently being less than 0.001.
For instance, the association between PU and EE reveals a nonstandardized coefficient of 0.227, with a standardized value of 0.242, underscoring a moderate yet significant relationship. Similarly, PEU’s influence on PU and EE stands out, particularly with a substantial effect on PU, as shown by a standardized coefficient of 0.506. Such findings emphasize the central role these predictors play in determining the outcomes.
Moreover, the predictors’ relationships with their respective measures, such as PU’s association with PU-1 to PU-6 and EE’s influence on EE-1 to EE-12, are all statistically robust. This is evident from the significant critical ratio values and the consistently significant p values.
In essence, the table provides a comprehensive view of the regression relationships, underscoring the robustness and significance of the predictors in explaining the variances in their corresponding outcomes. This analytical exposition aids in understanding the crucial pathways and associations in the studied context, offering valuable insights for scholars and practitioners alike.
Figure 4 illustrates the research model, visually mapping the intricate relationships between constructs reinforced by the standardized regression coefficients and offering a concise graphical summary of the statistical findings presented in the Model Regression Coefficient Summary Table.
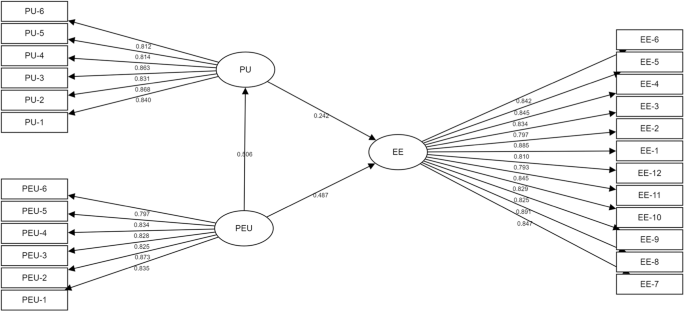
Research Model with Data Testing.
Conclusion
Our study aimed to explore the potential relationships between multimedia tools and PU and PEU and the resultant effects on EE. Drawing on the data and subsequent analyses, we arrive at the following conclusions concerning the hypotheses.
PU of multimedia tools significantly affects EE
Our data robustly support this hypothesis, showing a significant positive regression coefficient of 0.227 (p < 0.001, standardized coefficient: 0.242). This reveals a clear connection between the perceived value of multimedia tools and the resulting effectiveness of educators. In essence, when multimedia tools are perceived as valuable and relevant, educators are more likely to integrate them effectively into their teaching and care methods, leading to enhanced outcomes in early childhood education. This highlights the inherent need for developers and policy-makers to ensure that multimedia tools are not only technologically advanced but also cater directly to the practical needs of educators.
PEU of multimedia tools significantly affects EE
The hypothesis is strongly supported by our findings, reflected by a significant regression coefficient of 0.493 (p < 0.001, standardized coefficient: 0.487). The implications of this are profound. If educators find multimedia tools cumbersome or nonintuitive, even the most advanced features can be underutilized, undermining potential educational benefits. The ease with which these professionals can navigate and apply multimedia tools directly impacts their ability to harness their full potential, directly influencing the quality of the education and care provided.
PEU significantly affects the PU of multimedia tools among educators
The data offer a solid endorsement for this hypothesis, with a regression coefficient of 0.545 (p < 0.001, standardized coefficient: 0.506). This suggests a symbiotic relationship between ease of use and perceived value. If a multimedia tool is user-friendly, its perceived utility among educators increases, making it more likely to be integrated into their daily routines. This intertwining of utility and usability underscores the importance of holistic tool design, where functionality and user experience are both prioritised.
Overall, the conclusions drawn from our hypotheses provide a compelling narrative about the importance of both perceived usefulness and ease of use in the context of multimedia tools for educators. It is not merely about creating technologically sophisticated tools; it is about ensuring they align with the practical needs and comfort levels of educators. As the landscape of early childhood education in China continues to evolve, these insights offer critical guidance for both tech developers and educational policy-makers, emphasizing the need for tools that are both potent and accessible.
Discussion
The intricate connection between technology, specifically multimedia tools, and education has been extensively examined in academic research. With the ever-evolving landscape of digital learning, it is imperative to understand the factors that influence the successful adoption and effectiveness of these tools. Our study, rooted in this context, offers several insights that warrant discussion.
First, our findings align with the broader literature that emphasizes the role of PU in technology adoption. The significant effect of PU on EE aligns with the tenets of the TAM, which posits that the perceived usefulness of technology is a primary determinant of its acceptance and use. This result underscores the importance for developers and educators alike to ensure that multimedia tools incorporate advanced features and are genuinely helpful in the intended context.
Our observation on the role of PEU sheds light on a critical aspect of technology implementation in educational contexts. The positive influence of PEU on educators’ effectiveness is a testament to the age-old adage: simplicity is the ultimate sophistication. It is about more than having a tool with many features; its potential benefits remain unrealized if it is not user-friendly. The influence of PEU on PU further cements the notion that tools perceived as easy to use are also deemed more practical. This interconnectedness suggests that usability and utility are not mutually exclusive but intertwined dimensions that educational technology developers must address concurrently.
In addition, the robust effect size of the relationship between PEU and PU is noteworthy. While usefulness is paramount, the ease with which educators can harness this usefulness is equally critical. This has significant implications for training and professional development programs. As institutions introduce new multimedia tools, they must ensure that support mechanisms are in place to make the transition smooth for educators.
However, our study is not without its limitations. Factors such as cultural nuances, institutional peculiarities, or regional specifics might affect the observed relationships. It is also relevant to highlight that our survey was conducted exclusively in Guangdong Province. As such, the findings may not be generalizable to other provinces in China, suggesting the need for caution when interpreting the outcomes.
In conclusion, our investigation stresses the significance of the association between perceived usefulness and ease of use in determining the effectiveness of multimedia tools for educators. As we navigate deeper into the digital age, these revelations serve not just as scholarly reflections but as essential guideposts for stakeholders straddling technology and education, mapping out the trajectory of digital education.
Directions for future studies
Given the geographical limitation of our study in Guangdong Province, future research could explore similar dynamics in other provinces of China to ascertain the generalizability of our findings. Cross-provincial comparisons might identify regional variances in the adoption and effectiveness of multimedia tools. In addition, longitudinal studies could be conducted to track changes in perceptions and usage patterns over time, offering insights into the evolving nature of digital learning. There is also a potential avenue to delve deeper into specific multimedia tool features and their direct impact on educators’ teaching methodologies and student outcomes. Ultimately, as technology continues to permeate educational settings, it is imperative for research to stay abreast of these developments, ensuring that tools are both relevant and effective in the ever-changing educational landscape.
Data availability
The data are not publicly available due to privacy protection. The data that support the findings of this study are available on reasonable request from the corresponding author.
References
Adarkwah MA (2021) “I’m not against online teaching, but what about us?”: ICT in Ghana post Covid-19. Educ Inf Technol 26(2):1665–1685
Alzubi A (2023) The role of multimedia tools in Hashemite Kingdom of Jordan education classroom teaching in the digital era. Eur J Interact Multimed Educ 4(2):e02303
Anderson T, Rivera Vargas P (2020) A critical look at educational technology from a distance education perspective. Digital Educ Rev 2020(37):208–229
Arvola O, Pankakoski K, Reunamo J, Kyttälä M (2021) Culturally and linguistically diverse children’s participation and social roles in the finnish early childhood education – is play the common key? Early Child Dev Care 191(15):2351–2363
Campbell JP (2012) Behavior, performance, and effectiveness in the twenty-first century. In: Kozlowski SWJ (ed) The Oxford handbook of organizational psychology. Oxford University Press, New York, p 159–194
Central People’s Government of the People’s Republic of China (2019) General office of the state council on promoting guiding opinions on promoting the development of care services for infants and children under the age of 3. https://www.gov.cn/gongbao/content/2019/content_5392295.htm. Accessed 10 Jun 2023
Cochran WG (1977) Sampling techniques. John Wiley & Sons, New York
Coskun A, Cagiltay K (2022) A systematic review of eye-tracking-based research on animated multimedia learning. J Comput Assist Learn 38(2):581–598
Davis FD, Bagozzi RP, Warshaw PR (1989) User acceptance of computer technology: a comparison of two theoretical models. Manag Sci 35(8):982–1003
Gong H (2022) Application of multimedia human-computer interaction technology in preschool children drama education. Adv Multimed 2022:6388057
Granić A (2023) Technology adoption at individual level: toward an integrated overview. Univers Access Inf Soc. https://doi.org/10.1007/s10209-023-00974-3
Guangdong Provincial People’s Government (2020) Implementation opinions of the general office of the Guangdong Provincial people’s government on promoting the development of care services for infants and young children under the age of 3. http://www.gd.gov.cn/xxts/content/post_2924459.html. Accessed 10 Jun 2023
Hu X, Chiu MM, Leung WMV, Yelland N (2021) Technology integration for young children during COVID-19: towards future online teaching. Br J Educ Technol 52(4):1513–1537
Infant Care and Early Development Industry Association of Guangdong Province China (2023) Member units. https://www.gdeea.org.cn/member. Accessed 20 Jun 2023
Ismoilovich NI, Ravshanbekovich GaS (2023) The importance of information and communication technologies in education: enhancing learning in the digital age. Eurasia J Learn Acad Teach 21:18–22
Kaimara P, Oikonomou A, Deliyannis I (2022) Could virtual reality applications pose real risks to children and adolescents? A systematic review of ethical issues and concerns. Virtual Real 26(2):697–735
Kamran M (2019) ICTs in learning: multimedia learning in classroom. Glob Media J Pak Ed 12(1):77–94
Kong D (2023) 31 provinces (autonomous regions and municipalities) 2022 regional GDP have been released, what signal does the GDP of each province convey? Central people’s government of the people’s republic of China. https://www.gov.cn/xinwen/2023-02/06/content_5740185.htm. Accessed 10 Jun 2023
Latini N, Bråten I, Salmerón L (2020) Does reading medium affect processing and integration of textual and pictorial information? A multimedia eye-tracking study. Contemp Educ Psychol 62:101870
Li J, Antonenko PD, Wang J (2019) Trends and issues in multimedia learning research in 1996–2016: a bibliometric analysis. Educ Res Rev 28:100282
Li H, Yang W, Chen JJ (2016) From ‘Cinderella’to ‘Beloved Princess’: the evolution of early childhood education policy in China. Int J Child Care Educ Policy 10:1–17
Lindeman S, Svensson M, Enochsson AB (2021) Digitalisation in early childhood education: a domestication theoretical perspective on teachers’ experiences. Educ Inf Technol 26(4):4879–4903
Livingstone S, Mascheroni G, Staksrud E (2019) European research on children’s internet use: assessing the past and anticipating the future. N. Media Soc 21(3):657–674
Logan H, Cumming T, Wong S (2020) Sustaining the work-related wellbeing of early childhood educators: perspectives from key stakeholders in early childhood organisations. Int J Early Child 52(1):95–113
Luo W, Berson IR, Berson MJ (2023) A social media analysis of the experiences of Chinese early childhood educators and families with young children during COVID-19. Sustainability 15(3):2560
Mertala P (2019) Teachers’ beliefs about technology integration in early childhood education: a meta-ethnographical synthesis of qualitative research. Comput Hum Behav 101:334–349
Naluwooza R, Ayeni F, Langmia K, Mbarika V (2023) Fostering learning outcomes in a non-reading culture at foundational level of education: the role of information technology and pupil engagement. Int J Educ Manag 37(3):558–574
Neo TK, Neo M (2004) Classroom innovation: engaging students in interactive multimedia learning. Campus Wide Inf Syst 21(3):118–124
Nisak FF, Munawaroh H, Abbas S (2022) The effect of “kids moderations” interactive multimedia on religious moderation attitudes in early childhood. Indones J Educ Res Rev 1:38–47
Oon PT, Hu BY, Wei B (2019) Early childhood educators’ attitudes toward science teaching in Chinese schools. Australas J Early Child 44(4):423–435
Przybylski AK (2019) Digital screen time and pediatric sleep: evidence from a preregistered cohort study. J Pediatrics 205:218–223
Reddick CG, Enriquez R, Harris RJ, Sharma B (2020) Determinants of broadband access and affordability: an analysis of a community survey on the digital divide. Cities 106:102904
Seligman LS (2001) Perceived value impact as an antecedent of perceived usefulness, perceived ease of use, and attitude: a perspective on the influence of values on technology acceptance. The University of Texas at Austin, Austin
Shen H (2022) NPC deputy Lu Xin: Suggesting appropriate extension of parental leave for men. Official website of the national people’s congress of the PRC. http://www.npc.gov.cn/npc/c30834/202203/3e05eb005cd94403bcd140e6c48d6106.shtml. Accessed 20 Jun 2023
Shunkov V, Shevtsova O, Koval V, Grygorenko T, Yefymenko L, Smolianko Y, Kuchai O (2022) Prospective directions of using multimedia technologies in the training of future specialists. Int J Comput Sci Netw Secur 22(6):739–746
Sonnenschein S, Stites M, Ross A (2021) Home learning environments for young children in the U.S. during COVID-19. Early Educ Dev 32(6):794–811
Sudarsana IK (2018) Quality improvement of early childhood education through the utilization of multimedia. J Penjaminan Mutu 4(2):174–183
The SPSSAU Project (2023) SPSSAU. (Version 23.0). https://www.spssau.com
Warsono H, Yuwono T, Putranti I (2023) Analyzing technology acceptance model for collaborative governance in public administration: empirical evidence of digital governance and perceived ease of use. Int J Data Netw Sci 7(1):41–48
Weng J, Li H (2018) Early technology education in China: a case study of Shanghai. Early Child Development and Care
Zhao Z, Pan Y, Zhu J, Wu J, Zhu R (2022) The impact of urbanization on the delivery of public service–related SDGs in China. Sustain Cities Soc 80:103776
Author information
Authors and Affiliations
Contributions
XT: Significantly contributed to establishing the conceptual framework and defining the research objectives. Led the primary data collection efforts and was instrumental in the extensive drafting and composition of the manuscript, ensuring a comprehensive presentation of the research findings. SRBMZ: Provided invaluable guidance and oversight throughout the research process. Her contributions were critical in refining the manuscript, offering essential insights for its improvement, and rigorously correcting any errors, thereby upholding the academic integrity and quality of the work. QL: Assisted effectively in the systematic collection of data. Responsible for the creation and curation of graphical elements and charts within the manuscript, enhancing its visual appeal and clarity. In addition, conducted thorough proofreading of the document, focusing on refining its linguistic accuracy and textual coherence.
Corresponding author
Ethics declarations
Competing interests
The authors declare no competing interests.
Ethical approval
Considering the study’s categorization within the social sciences domain, which neither encompasses sensitive subjects nor involves vulnerable populations, the submission of a formal ethical review application to the Universiti Sains Malaysia’s ethics committee was not required.
Informed consent
All participants were informed of the purpose and scope of the study and how the data would be used. They were also assured that their anonymity would be maintained and that no personal or identification information would be collected or disclosed. All participants gave their informed consent for inclusion before they participated in this research.
Additional information
Publisher’s note Springer Nature remains neutral with regard to jurisdictional claims in published maps and institutional affiliations.
Rights and permissions
Open Access This article is licensed under a Creative Commons Attribution 4.0 International License, which permits use, sharing, adaptation, distribution and reproduction in any medium or format, as long as you give appropriate credit to the original author(s) and the source, provide a link to the Creative Commons license, and indicate if changes were made. The images or other third party material in this article are included in the article’s Creative Commons license, unless indicated otherwise in a credit line to the material. If material is not included in the article’s Creative Commons license and your intended use is not permitted by statutory regulation or exceeds the permitted use, you will need to obtain permission directly from the copyright holder. To view a copy of this license, visit http://creativecommons.org/licenses/by/4.0/.
About this article

Cite this article
Tang, X., Zainal, S.R.B.M. & Li, Q. Multimedia use and its impact on the effectiveness of educators: a technology acceptance model perspective. Humanit Soc Sci Commun 10, 923 (2023). https://doi.org/10.1057/s41599-023-02458-4
Received:
Accepted:
Published:
DOI: https://doi.org/10.1057/s41599-023-02458-4
