
Abstract
Many recent studies reported coronavirus point-of-care tests (POCTs) based on isothermal amplification. However, the performances of these tests have not been systematically evaluated. Cochrane Handbook for Systematic Reviews of Diagnostic Test Accuracy was used as a guideline for conducting this systematic review. We searched peer-reviewed and preprint articles in PubMed, BioRxiv and MedRxiv up to 28 September 2020 to identify studies that provide data to calculate sensitivity, specificity and diagnostic odds ratio (DOR). Quality Assessment of Diagnostic Accuracy Studies 2 (QUADAS-2) was applied for assessing quality of included studies and Preferred Reporting Items for a Systematic Review and Meta-analysis of Diagnostic Test Accuracy Studies (PRISMA-DTA) was followed for reporting. We included 81 studies from 65 research articles on POCTs of SARS, MERS and COVID-19. Most studies had high risk of patient selection and index test bias but low risk in other domains. Diagnostic specificities were high (> 0.95) for included studies while sensitivities varied depending on type of assays and sample used. Most studies (n = 51) used reverse transcription loop-mediated isothermal amplification (RT-LAMP) to diagnose coronaviruses. RT-LAMP of RNA purified from COVID-19 patient samples had pooled sensitivity at 0.94 (95% CI: 0.90–0.96). RT-LAMP of crude samples had substantially lower sensitivity at 0.78 (95% CI: 0.65–0.87). Abbott ID Now performance was similar to RT-LAMP of crude samples. Diagnostic performances by CRISPR and RT-LAMP on purified RNA were similar. Other diagnostic platforms including RT- recombinase assisted amplification (RT-RAA) and SAMBA-II also offered high sensitivity (> 0.95). Future studies should focus on the use of un-bias patient cohorts, double-blinded index test and detection assays that do not require RNA extraction.
Introduction
Coronavirus epidemics have caused serious damage to public health and the global economy. Severe acute respiratory syndrome coronavirus (SARS-CoV) and Middle East respiratory syndrome coronavirus (MERS-CoV) infected over ten thousand people and killed over a thousand people worldwide1. A novel coronavirus (SARS-CoV-2) that causes coronavirus disease 2019 (COVID-19) infected over 60 million people and so far killed over 1,400,000 people (as of Nov 26th, 2020). The global GDP is predicted to shrink by almost one percent2. Rapid and low-cost diagnostic screening of a population at risk is critical for controlling sources of infection. Such diagnostic capability also helps policy makers decide when and to what extent to ease restrictions and restore the economy3.
Reverse transcription quantitative polymerase chain reaction (RT-qPCR) has been the gold standard for RNA virus detection4,5. Nonetheless, RT-qPCR requires up to 4 h sample-to-result time and needs a bulky expensive thermal cycler with fluorimetry. To fulfil the demand for rapid diagnoses during disease outbreaks, point-of-care tests (POCTs) are needed that are cheaper, faster and deployable in the field.
Nucleic acid detections based on isothermal amplification obviate the need for a thermal cycler thereby simplifying and speeding up the diagnosis process. For instance, loop-mediated isothermal amplification (LAMP) relies on strand displacing DNA polymerase and primers to amplify specific DNA sequences of pathogens6. Reverse transcription LAMP (RT-LAMP) has been applied for the detection of various RNA viruses including Ebola, Zika, West Nile, Influenza and Yellow fever viruses7,8,9,10,11. Rolling circle amplification (RCA) utilizes highly processive strand displacement DNA polymerase and circularizable oligonucleotide probes for detecting single strand DNA or RNA12. Reverse transcription insulated isothermal PCR (RT-iiPCR) relies on a temperature gradient to drive denaturation/annealing/extension cycle similar to conventional PCR but in the absence of a thermal cycler13. Reverse transcription recombinase polymerase amplification (RT-RPA) or reverse transcription recombinase aided amplification (RT-RAA) uses recombinase, single strand binding protein, DNA polymerase and reverse transcriptase to amplify the RNA target14. Simple amplification based assay (SAMBA) uses DNA dependent RNA polymerase and RNA dependent DNA polymerase to alternately transcribe and reverse transcribe RNA target15. CRISPR diagnosis combines isothermal amplification techniques (such as RT-LAMP and RT-RPA) with specific DNA or RNA targeting ability of crRNA and Cas12 or Cas13 enzymes16. The outputs of these detection techniques can be coupled with fluorescent or colorimetric reporters as well as lateral flow strip platforms to facilitate readout processes.
While many studies presented nucleic acid POCTs for human coronaviruses, it is important to systematically evaluate and draw conclusions about the performance of POCTs and quality of these studies. These could guide clinical practice and highlight opportunities for next generation POCTs. Here, we aim to determine the accuracy of nucleic acid point-of-care diagnosis for human coronaviruses, particularly, SARS-CoV, MERS-CoV and SARS-CoV-2, using systematic review and meta-analysis techniques.
Methods
This study followed the guidelines in the ‘Cochrane Handbook for Systematic Reviews of Diagnostic Test Accuracy’17.
Eligibility criteria
Inclusion criteria
This systematic review and meta-analysis included (1) both peer-reviewed and preprint original articles on nucleic acid based POCTs; (2) the test must be isothermal, i.e., thermal cycling is not required during the test; (3) full text is available (in any language); and (4) provide enough information to determine the number of true positive, false positive, false negative and true negative on POCTs (performed on clinical samples) relative to a standard reference test.
Exclusion criteria
We excluded (1) studies investigating antibody test, direct antigen tests or non-isothermal nucleic acid test, (2) studies that did not use clinical samples.
Search strategy
Peer-reviewed articles were searched on PubMed from its inception up to 28 September 2020 with the following search terms: (coronavirus OR COVID-19 OR severe acute respiratory syndrome OR middle east respiratory syndrome) AND (rapid diagnosis OR isothermal amplification). Preprint articles were searched on BioRxiv and MedRxiv from 1 January 2020 to 28 September 2020 using a search term ‘isothermal amplification’. The titles, abstracts and duplicates were screened and the full text of relevant articles were reviewed by PS and cross-checked by CK. We registered our systematic review and meta-analysis on PROSPERO on April 21, 2020; registration number yet to be updated.
Quality assessment
The quality of each study was assessed with the Quality Assessment of Diagnostic Accuracy Studies 2 (QUADAS-2)18. QUADAS-2 consists of four key domains: (1) patient selection; (2) index test; (3) reference standard; (4) flow and timing. Each is assessed in terms of risk of bias and the first three in terms of concerns regarding applicability. These domains were assessed by using 18 signalling questions with ‘yes’, ‘no’ and ‘unclear’ answers. Specific criteria for what qualified as ‘yes’, ‘no’ and ‘unclear’ are shown (Table S1). Then, the answers were used to judge whether the risk of bias and the concern for the applicability of the research is low, high or unclear. Specific criteria for each domain i.e., what qualified as high or low risk of bias are shown (Table S2). Two reviewers (PS and CK) independently judged the quality of each study. Disagreements were resolved by consensus with additional input from ML.
Data extraction
Data were extracted by one reviewer (PS) and where the results were unclear, the two other reviewers (CK and ML) were consulted. The parameters extracted included: citation information, types of coronaviruses, methodology, and the diagnostic accuracy of results (Table S3).
Handling articles during data extraction:
-
(1)
For studies performing on different sets of samples (e.g. different patient groups from different hospitals) using the same diagnosis assays and parameter settings, we included all studies separately.
-
(2)
For studies performing on the same sets of samples using different diagnosis assays (e.g. CRISPR diagnosis vs RT-LAMP) or different variants of the same assays (e.g. using crude samples vs purified RNA or using fluorescent readout vs lateral flow strip test), we included all studies separately. Notably, redundant samples were excluded in subgroup analysis.
-
(3)
For studies performing on the same set of samples using the same diagnosis assay but different parameter settings (e.g. using different incubation times and temperatures), we included only the study that reported the highest sensitivity and specificity.
Statistical data analysis and reporting
Forest plots were generated and pooled sample statistics were calculated using R packages ‘mada’19 in R program (version 4.0.0)20. To avoid statistical artefacts from cells containing zero values in a 2 × 2 table (for example when false positive or false negative are zero), continuity corrections = 0.5 were added to the observed frequencies when calculating diagnostic odds ratio (DOR)19. Since the sensitivity and specificity of a diagnostic test depend on each other, bivariate approaches to the meta-analysis of diagnostic accuracy was recommended for estimating sensitivity, specificity and DOR in the ‘mada’ package.
Since Deeks’ test is recommended for diagnostic test accuracy (DTA) meta-analyses21 formal testing for publication bias was undertaken by a regression of diagnostic log odds ratio against 1/sqrt (effective sample size), weighted by effective sample size, with P < 0.10 for the slope coefficient indicating significant asymmetry22.
The Preferred Reporting Items for a Systematic Review and Meta-analysis of Diagnostic Test Accuracy Studies’ (PRISMA-DTA) was used for reporting23.
Results
Search results
We identified 2060 articles in total through database searching (Fig. 1). After title and abstract screening, we excluded 1941 articles that were not primary research articles, had no full text available or were unrelated to nucleic acid POCTs for human coronaviruses. 62 non-English articles were found but only two met above eligibility criteria. These two articles were later excluded as the authors did not use clinical samples. After reviewing full text, we found 65 articles with sufficient information to calculate sensitivity, specificity and diagnostic odds ratio (DOR) on clinical samples24,25,26,27,28,29,30,31,32,33,34,35,36,37,38,39,40,41,42,43,44,45,46,47,48,49,50,51,52,53,54,55,56,57,58,59,60,61,62,63,64,65,66,67,68,69,70,71,72,73,74,75,76,77,78,79,80,81,82,83,84,85,86,87,88 (Table S3). Of 65 articles, 13 reported more than one study conducted on different sample groups or using different diagnostic procedures. In total, we included 81 studies in our systematic review.
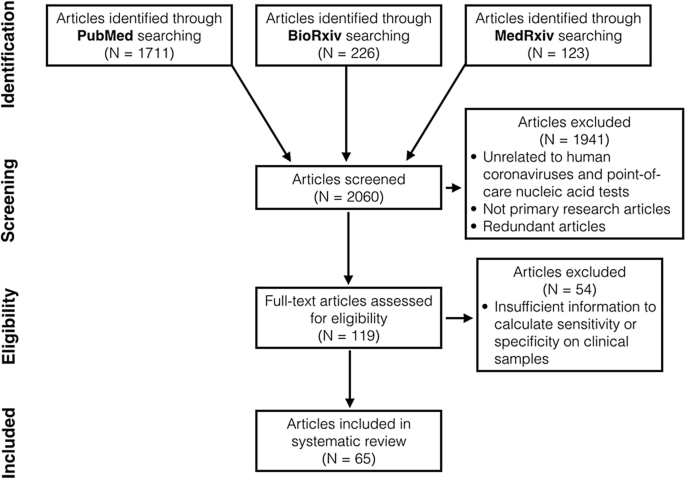
The preferred reporting items for a systematic review and meta-analysis (PRISMA) flow diagram.
Characteristics of the included studies
Most studies used clinical samples from USA (n = 20 out of 81 studies), followed by China (n = 17) and UK (n = 10). Most studies (n = 76) were COVID-19 diagnostic studies published or uploaded to preprint databases in 2020. Most studies (n = 51) use RT-LAMP as nucleic acid POCTs, followed by CRISPR diagnosis (n = 12), RT-RPA/RAA (n = 7), Abbot ID Now (n = 5), and SAMBA II (n = 2). The rest were iAMP, RT-iiPCR, RT-MDCA, and RCA (n = 1 each). Over a third (n = 28) of all studies attempted to diagnose coronaviruses in crude patient samples, i.e., nasopharyngeal swabs, sputum, saliva, etc. The others (n = 53) used purified RNA from patient samples for viral diagnosis.
Quality of articles
Almost two thirds of all studies (n = 50 out of 81 studies) have high risk of patient selection bias due to non-random patient selection and case–control study design (Fig. 2, Table S2). These studies specifically recruited clinical samples known to be uninfected or infected with coronavirus. Over a third of all studies have unclear risk of patient selection bias because these studies were not case–control but provided insufficient detail about patient inclusion/exclusion criteria. Only four studies38,49,65 has low risk of patient selection bias.

Quality assessment of diagnostic accuracy studies 2 (QUADAS-2) finding per domain for 81 studies included in this systematic review.
Over one fifth of all studies (n = 18 out of 81 studies) have high risk of index test bias because these tests used qualitative fluorescent or colorimetric readout without defined detection thresholds. Only seven studies had low risk of index test bias as these studies had quantitative detection readouts with reported thresholds. These studies also explicitly declared that their index and reference tests were done simultaneously/in parallel to each other or that testing was blinded from each other. For other studies (n = 56), it was either unclear whether index test results were interpreted with knowledge of reference test results or qualitative readout was used for interpreting the results. Thus, index test bias of these studies are unclear.
Only two studies have high risk of reference standard bias as they used RT-PCR (not quantitative, readout result in agarose gel electrophoresis)47 or immunofluorescent assay (IFA)69 as a reference standard test. For the rest of included studies, almost two thirds (n = 52) have unclear risk of reference standard bias because these studies did not provide enough information about whether reference standard results were interpreted without knowledge of the results of the index test.
Most studies have a low risk of flow and timing bias with the following exceptions. One study provided no information on whether the samples for a reference test (IFA) and the index test (RT-LAMP) were taken at the same time69. Another study might have excluded some samples from the workflow87. These two studies were marked as having unknown risk of flow and timing bias. Three studies were designated as having high risk because they used different standard references on different samples80, used different samples test flow on different sample groups65, and excluded some samples from the analysis76 (Table S2).
Our review question did not focus on any particular patient demographics. None of the included studies attempted to exclude patients based on demographics and thus had no ‘concern of patient selection applicability’(Fig. 2, Table S2). Index isothermal tests of all studies have generally been used for POCTs and thus have low concern of index test applicability. Reference standard tests of nearly all studies are RT-qPCR, the current gold standard for RNA virus detection. Thus, we graded these studies as having low concern of standard test applicability. Two studies that used (non-quantitative) RT-PCR47 and IFA69, were marked as having high concern of standard test applicability.
Sensitivity, specificity and diagnostic odd ratio (DOR) of nucleic acid POCTs
Nearly all studies (n = 77 out of 81) reported at least 90% diagnosis specificity while less than two third (n = 48 out of 81) reported 90% sensitivity or above (Fig. 3). Less than a third (n = 14 out of 53) of studies that used purified RNA for diagnosis reported below 90% sensitivity (Fig. 3A). In contrast, over two thirds (n = 19 out of 28) of studies that used crude patient samples for diagnosis reported sensitivities less than 90% (Fig. 3B). Thus, for most studies, diagnostic specificity is of less concern than sensitivity. Moreover, diagnostic sensitivity of purified RNA is generally higher than those of crude patient samples. All studies reported DOR above one.

The forest plot of sensitivity, specificity and diagnostic odds ratio (DOR) of human coronavirus nucleic acid point-of-care tests (POCTs) on purified RNA samples (A) and on crude patient samples (B). Rows shows first author name, and performance (sensitivity, specificity and DOR) of each study. Different studies from the same research articles are labelled with different letter [a], [b], [c], etc. Blue parentheses after first author names indicates the types of coronaviruses diagnosed and publication years of the studies. All rows without blue parentheses show studies on COVID-19 diagnosis published in 2020. Red dots indicate those studies that were only available as pre-prints (not peer-reviewed). The far right blue texts indicate the types of diagnostic assays used in the studies. The far left yellow boxes prefacing the author names denote the studies having no QUADAS-2 domain with high risk bias or high concern of applicability but have unclear bias or concerns in some QUADAS-2 domain. Green boxes denote that the study has low risk of bias and low concern of applicability in all QUADAS-2 domains. All rows without yellow or green box show studies with high risk of bias or high concern of applicability in at least one QUADAS-2 domain.
Among studies that used RT-LAMP on purified RNA samples, the study by Rohaim et al. (2020) is clearly an outlier (Fig. 3A)74. This study used artificial intelligence to interpret the RT-LAMP colorimetric readout. While this approach can reduce assay time and eliminate subjectivity of result interpretation, the false positive rate was high (approximately 50% when using RT-qPCR as a reference test). Osterdahl et al. (2020) is the only study whose both sensitivity and specificity were 80% or below65. This study had high risk of flow and timing bias because some clinical samples were taken on different days for index test and standard reference test. Poon et al. (2004) reported the lowest sensitivity (at 65%) among all studies using RT-LAMP on purified RNA samples69. This study has a high risk of reference test bias and high concern of reference test applicability because immunofluorescent assay (IFA) was used for reference test instead of RT-qPCR. Since the antibody may persist much longer in patients than the virus. As a result, some samples might give a positive result to the antibody test but provide a negative result to the LAMP test. Buck et al. (2020), Thi et al. (2020) and Rodel et al. (2020) are also studies with sensitivity below 80%34,39,72. These studies also reported quantity of viral RNA (as Ct value of RT-qPCR) in purified RNA sample. The authors showed that that samples with low viral RNA (i.e. high Ct value above 30) accounted for a significant portion of coronavirus positive samples used in the studies. Since these samples were more difficult to detect (i.e. more likely to get false negative), this could explain apparently low sensitivities reported by these three studies.
For diagnosis of purified RNA samples using non RT-LAMP assays, all studies using RT-RPA/RAA, CRISPR diagnosis, RT-iiPCR, and RCA as index tests reported sensitivity and specificity at close to 90% or above (Fig. 3A). The Li et al. (2020)59 study is clearly an outlier. The study introduced a new diagnosis assay called reverse transcription multiple cross displacement amplification (RT-MCDA). The authors claimed that this new assay was more sensitive than RT-qPCR. Nonetheless, the result showed that RT-MCDA could only detect viral RNA in 33.8% of COVID-19 confirmed patient samples. Such low sensitivity could result from the performance of RT-MDCA itself or the fact that viral RNA in some samples was degraded as a follow-up RT-qPCR could detect COVID-19 in only 30.7% of the same sample set.
Nearly all studies (n = 12 out of 15) using RT-LAMP on crude patient samples reported less than 90% diagnostic sensitivity. The studies by Thi et al. (2020) and Lamb et al. (2020) reported even less than 50% sensitivity39,57. Such low sensitivity measure could be explained by the fact that these studies used patient samples with low viral load. Excluding positive samples with Ct = 30 or above, the calculated sensitivities from these studies rise above 60% (Table S4). Diagnosis of crude patient samples using non RT-LAMP assays has sensitivity ranging from 74 to 100%, with two exceptions. Basu et al. (2020)29 and Schermer et al. (2020)75 reported 55% and 56% diagnostic sensitivity for ID Now and CRISPR diagnosis, respectively. For the study by Schermer et al., all positive samples had Ct value below 30. This implies that poor sensitivity measure resulted from the performance of the assay itself and not because the samples had low viral load. Basu et al. did not show Ct value of samples used in their study29. Thus, it could still be possible that poor performance partially resulted from positive samples with low viral load. In fact, another study by Smithgall et al. showed that ID Now diagnostic sensitivity is 100% for samples with Ct value not exceeding 30 but only at 34.4% for samples with Ct value above 3077 (Table S4).
Publication bias
Publication bias of all 81 included studies was determined using Deek’s funnel plot test for DOR. The result indicates significant asymmetry in funnel plot (p-value = 3.203 × 10⁻⁴).
Meta-analysis of sensitivity, specificity and DOR
We performed subgroup analysis of all studies that used RT-qPCR as reference test and had at least ten positive and ten negative patient samples. The two outlier studies by Rohaim et al.74 and Li et al.59 were excluded from the subgroup analysis. If multiple studies were conducted on the same set of patient samples, only a study with the highest sensitivity and specificity was used. For example, Patchsung et al.67 reported two CRISPR diagnosis studies on the same set of patient samples, one using fluorescent readout and the other using lateral flow assay. In our analysis, we included only the fluorescent readout study, which had higher sensitivity and similar specificity to the lateral flow assay.
In total, 61 studies were used for subgroup analyses (Fig. 4A, Table S5). These studies were divided up further according to the types of samples used (purified RNA vs crude patient samples) and index test assays. We only estimated pooled sensitivity, specificity and diagnosis odds ratio for subgroups that had at least four studies. For the studies subgroup using RT-LAMP on purified RNA samples, we also performed a further subgroup analysis to compare the performance of studies from peer-reviewed and from pre-print articles.

Hierarchical subgrouping of studies for meta-analysis. (A) subgrouping of all qualified studies. (B) subgrouping of only qualified studies that provide Ct values of positive samples. “n” indicates the number of studies in a subgroup. Pooled diagnosis results from subgroups in white boxes were used for calculating pooled sensitivity, specificity and DOR. Subgroups in grey boxes were not used for sensitivity, specificity, nor DOR calculation.
Pooled sensitivity and specificity of all included studies are at 91% and 99%, respectively, indicating overall good performance of isothermal amplification based diagnosis test so far (Table 1). Pooled sensitivity of studies using purified RNA sample at 0.94 (95% CI: 0.92–0.96) is clearly higher than those using crude patient samples at 0.83 (95% CI: 0.74–0.89).
Similarly, pooled sensitivity of studies using RT-LAMP on purified RNA sample is clearly higher than that for studies using RT-LAMP on crude patient samples. Pooled sensitivity of RT-LAMP on crude samples was similar to that of ID Now. Both pooled sensitivities were lower than that of SAMBA II (Fig. 3, not used in subgroup analysis). For diagnosis of purified RNA samples, pooled sensitivities of RT-LAMP, CRISPR diagnosis and RT-RPA/RAA were similar.
Additionally, pooled sensitivity of RT-LAMP studies in peer-reviewed articles was not significantly different from that in pre-print articles.
The distribution of viral load in tested samples is one of the key factors that determine measured sensitivity of an index test. If a large fraction of positive samples used in a study have low viral load (i.e., high Ct value), measured sensitivity will be low. Unfortunately, the majority of our included studies (n = 35 out of 61) do not show Ct values of positive samples. Thus, it was not possible to determine the extent to which viral load in positive samples from these studies affected their measured sensitivity. For this reason, we decide to focus our analysis on only studies that reported Ct values.
In total, 26 studies were used for subgroup analyses (Fig. 4B, Table S5). Again, these studies were divided up further according to types of samples used (purified RNA vs crude patient samples) and index test assays. For each subgroup analysis, we calculated pooled sensitivity, specificity and DOR for the cases when all samples were used and the cases when positive samples with high Ct values were excluded. The ‘high’ Ct cut-off values were not the same in all included studies (depending on data available from the original research articles). Most studies (n = 19 out of 26) had Ct cut-off values of 30–33; the remainder had Ct cut-off values of 34–39 (Table S4). Excluding samples with high Cts from the calculation resulted in substantial increases in sensitivity, particularly for diagnosis of crude samples (Table 1, Table S4). The calculated pooled sensitivity for crude samples increases from 0.76 (95% CI: 0.57–0.88) to 0.95 (95% CI: 0.84–0.99); the calculated pooled sensitivity for RT-LAMP on crude samples increases from 0.73 (95% CI: 0.51–0.88) to 0.91 (95% CI: 0.79–0.97). Diagnostic sensitivity of purified RNA samples remained higher than those of crude patient samples. However, when positive samples with high Ct values were excluded, such difference in sensitivity become smaller.
Discussion
To our knowledge, this is the first systematic review and meta-analysis examining the performance of isothermal nucleic acid POCTs for human coronavirus. The majority of studies that used purified RNA for diagnosis reported at least 90% sensitivity and specificity; over a third of these studies reported 100% sensitivity and specificity. Sensitivities were generally lower for studies that used crude patient samples for diagnosis while specificities were not substantially different. Subgroup analyses confirmed the difference in sensitivity between diagnostic test performed on purified RNA and on crude patient samples. Nonetheless, when positive samples with low viral loads (Ct value = 30 or above) were excluded from calculation, such difference become much smaller. In other words, for samples with medium to high viral load, coronaviruses could be reliably detected directly from crude patient samples without an RNA purification step which takes more time and technical expertise.
Almost two thirds of the included studies used RT-LAMP as an index test. At the time of this writing, the only published meta-analysis of RT-LAMP performance was on a diagnostic accuracy of Enterovirus 71 by Lei et al. (2014)89. That meta-analysis included 907 clinical samples from ten studies, all performed on purified RNA. Pooled data had a sensitivity of 0.99 (95% CI: 0.97–1.00), specificity of 0.97 (95% CI: 0.94–1.00) and ln(DOR) of 6.74 (95% CI: 5.68–7.79). Our subgroup analysis showed that RT-LAMP on purified RNA samples had pooled sensitivity of 0.94 (95% CI: 0.90–0.96), specificity of 1.00 (95% CI: 0.99–1.00) and ln(DOR) of 8.49 (95% CI: 7.06–9.92) (Table 1). Pooled sensitivity of RT-LAMP from our analysis appeared to be lower. Nonetheless, when samples with high Ct values were excluded, pooled sensitivity of analyses went up to 1.00 (95% CI: 0.89–1.00) which is within the same range as the analysis by Lei et al. Thus, our reported RT-LAMP performance is likely to reflect the true performance of this isothermal nucleic acid test as the performance value is generalizable across different target viruses. This could serve as a reference point for assessing the performance of other diagnostic methods.
Among RT-LAMP studies on purified RNA, the studies by Hu et al., Kitakawa et al., Thi et al. and Yan et al.39,49,55,84 were of high quality: they tested large sample sizes and had no QUADAS-2 domain with high risk of bias or concern of applicability (Table S2). Yet, these four studies reported contrasting results with respect to diagnostic performance. While Kitakawa et al.55 and Yan et al.84 demonstrated 100% diagnostic sensitivity, Thi et al.39 reported only 70% sensitivity. Generally, the measured false negative rate of a diagnosis test is high when the viral loads in the majority of tested samples are low.
For example, Thi et al. showed that RT-LAMP sensitivity is at 100% when the samples have viral RNA concentration equivalent to Ct of 0–25 cycles. The sensitivity decreases to about 30% at RNA concentration equivalent to Ct of 30–35 cycles and to sensitivity less than 6% at RNA concentration equivalent to Ct of 35–40 cycles. Approximately a third of positive samples in Thi et al. study has Ct of 30–40 cycles. This could explain why RT-LAMP in this study appear to have such a high false negative rate. Yan et al. and Kitakawa et al. did not report the distribution of viral RNA level in their tested samples. Thus, it is possible these two studies appear to achieve 100% sensitivity simply because most of their positive samples had high viral RNA level.
Viral RNA levels in samples depend on several factors including severity of the disease, timing of sample collection, types of samples and sample handling processes. Without such information, it is difficult to determine whether the difference in observed sensitivity results from the performance of the test itself or properties of the samples used in the test. Unfortunately, most included studies provided no information about viral RNA levels in the infected samples (as determined by a standard reference test, e.g., RT-qPCR). Information about disease severity and sample collection timing (i.e., days after disease onset) are often missing. Future works should provide this information in order to allow a better assessment of diagnosis test performance and must identify their actual limitations.
Of all included studies in this review, only two studies by Schermer et al. (2020) attempted to directly compare the coronavirus detection accuracy of CRISPR diagnosis to that of RT-LAMP using the same set of clinical samples75. They estimated diagnostic sensitivity (in crude patient samples) of RT-LAMP at 73% and of CRISPR diagnosis at 56%. While the sensitivity of RT-LAMP shown in this study was on par with RT-LAMP performance reported by other studies in our review, diagnosis sensitivity by CRISPR was surprisingly low. Other studies including Arizti-Sanz et al. (2020) and Joung et al. (2020) estimated sensitivity of CRISPR diagnosis on crude samples at 90–100%26,52. From Schermer et al. study, CRISPR diagnosis failed to detect any positive samples with Ct values above 21 cycles. In contrast, the study by Joung et al. (2020) using CRISPR diagnosis could reliably detect all positive samples with Ct of 20–35 cycles52. For coronavirus detection in purified RNA samples, estimated sensitivity of RT-LAMP and of CRISPR diagnosis were almost identical according to our subgroup analysis (Table 1). Given available data, the difference in performance of CRISPR diagnosis and RT-LAMP remains inconclusive. Existing CRISPR diagnosis also required RT-LAMP or other isothermal techniques to pre-amplify nucleic acid targets before CRISPR detection. The use of cas12 or cas13 enzyme adds to the cost of CRISPR diagnosis test kit, making it likely to be more expensive than RT-LAMP. Future studies should directly compare and highlight the unique strength of CRISPR diagnosis relative to other isothermal techniques, for example, its ability for multiplex detection and identifying single base differences in targeted genomes90,91,92.
All seven studies using RT-RPA/RAA as an index test reported over 90% sensitivity and at least 98% specificity. Additionally, the studies by Qian et al. (2020) showed that RT-RPA/RAA based diagnosis on crude patient samples could achieve detection sensitivity level similar to diagnosis on purified RNA samples70. While most studies did not report Ct value of positive samples, one study by Wu et al. (2020) demonstrated that RT-RPA/RAA based diagnosis can detected 91% (30 out of 33) positive samples with Ct values of 30–36 cycles82. Together, the results from these studies suggested that RT-RPA/RAA could potentially be one of the most promising approaches for developing coronavirus POCTs. Future works should directly compare this assay to other nucleic acid POCTs such as RT-LAMP using the same sample sets in order to determine the actual difference in their diagnosis performance.
Besides RT-LAMP, CRISPR diagnosis and RT-RPA/RAA, two other diagnostic assays with over a hundred positive and negative pooled samples in our review were Abbott ID Now and SAMBA II. Abbott ID Now is famous for being “the fastest” (5–13 min) isothermal COVID-19 nucleic acid detection system in the market. However, four out of five ID Now studies included in our review reported less than 80% sensitivity. Pooled data from ID Now studies have sensitivity levels on par with that of RT-LAMP applied to crude samples. Only one of these five studies by Smithgall et al. (2020) showed Ct values of positive samples77. The study reported 74% sensitivity when all samples were used for calculation. For samples with Ct below 30 cycles, the sensitivity is 100%. Thus, the poor performance of ID Now reported in these studies could partly result from having the large proportion of positive samples with low viral loads. The two SAMBA II studies each included over a hundred tested samples and had no high risk or concern QUADAS-2 domains27,38. In these two studies, sensitivity and specificity at 97% or above were among those with highest accuracy of all the included studies in our current systematic review. Despite being the slowest POCTs among our included studies (> 1 h from sample to readout), SAMBA II is arguably one of the most promising POCTs thus far regarding diagnostic accuracy for coronavirus detection of crude patient samples. Unfortunately, neither of these two studies reported Ct values of the samples used. Thus, given data availability for this review, we still cannot directly compare the performance of this approach to other assays.
Our study identified both relevant peer-reviewed studies and preprints for deriving better scientific conclusions in diagnosis of the life-threatening novel coronavirus in a timely manner. Our study also adhered to the standard methodology of systematic review and meta-analysis as indicated by the PRISMA-DTA statement93. However, our study had few limitations. First, almost half of the included studies (n = 38 out for 81) had high risk of patient selection bias or index test bias. Such bias could lead to over-estimation of diagnosis performance. Nonetheless, the studies that reported the highest performance (near 100% sensitivity and 100% specificity with narrow 95% CIs) were also the ones with lowest QUADAS risk and concerns in all domains27,38,41,45,55,82,83,84. Second, almost two thirds (n = 28) of included studies had not been peer-reviewed. Nevertheless, our analysis showed that sensitivity and specificity for pooled data from these preprint manuscripts was not significantly different from that of the peer-reviewed studies. Therefore, an inclusion of data from preprint manuscripts is unlikely to skew the results of our other analyses. Given that the peer-review process often takes at least a few months, the systematic review that includes preprint manuscripts is timely for guiding the direction of on-going research especially during a global pandemic. Third, our analysis indicated significant publication bias in included studies. Given that all nucleic acid isothermal POCTs for coronaviruses were still in an early stage of development, nearly all reported diagnosis accuracy assessments were performed and published only by the same research groups that developed or optimised the assays. Thus, there is likely to be bias toward reporting higher diagnosis performance. We expected that such bias would be mitigated once these POCTs are fully deployed in the field and assessed by multiple and independent research teams, not directly affiliated with POCT developers.
We identified a recent comprehensive systematic review on nucleic acid POCTs of SARS-CoV-2 by Dinnes et al. (2020)94. The review by Dinnes et al. was published after our preprint version was available online95. Dinnes et al. searched article database only up to 25 May 2020 and did not include any isothermal POCT assays besides ID Now. While the systematic review by Dinnes et al. was more selective for studies that were highly relevant to ongoing clinical uses, our review offered a broader perspective on the performance of diverse competing diagnostic platforms.
In conclusion, our systematic review and meta-analysis revealed the current state of nucleic acid POCTs for human coronaviruses. Overall diagnostic accuracy of these POCTs reported so far was high but the quality of these studies was still in question. Particularly, future study should attempt to use un-bias (e.g., random or consecutive) patient cohorts and perform double-blinded index test. Such improvement in study design and methodology would enhance validity of the estimated sensitivity and specificity of POCTs. This would allow researchers and healthcare providers to make correct decisions on which POCTs platforms to deploy or upgrade.
Sensitivity and specificity of RT-LAMP, RT-RPA/RAA and CRISPR diagnosis on purified RNA samples were not materially different. Critical information about viral load or factors influencing viral load was missing in most studies. It is still unclear whether CRISPR diagnosis was superior to a cheaper, simpler and more established nucleic acid POCTs such as RT-LAMP. The performance of viral detection directly from patient samples is substantially lower than from purified RNA.SAMBA II had highest diagnostic accuracy among all POCTs for crude samples in this systematic review while Abbott ID Now had lower diagnostic accuracy. A breakthrough in bypassing an RNA purification step will simplify the workflow, reduce time, cost and possible errors. The improvement in these key areas will bring nucleic acid POCTs toward large practical uses for surveillance of on-going and future coronavirus outbreaks.
References
Prompetchara, E., Ketloy, C. & Palaga, T. Immune responses in COVID-19 and potential vaccines: Lessons learned from SARS and MERS epidemic. Asian Pac. J. Allergy Immunol. 38, 1–9 (2020).
United Nation. https://www.un.org/sustainabledevelopment/blog/2020/04/covid-19-likely-to-shrink-global-gdp-by-almost-one-per-cent-in-2020/ (2020).
Vashist, S. K. In vitro diagnostic assays for COVID-19: Recent advances and emerging trends. Diagnostics 10, 202, https://doi.org/10.3390/diagnostics10040202 (2020).
Centers for Disease Control and Prevention. CDC 2019-Novel Coronavirus (2019-nCoV) Real-Time RT-PCR Diagnostic Panel. https://www.fda.gov/media/134922/download (2020).
Shen, M. et al. Recent advances and perspectives of nucleic acid detection for coronavirus. J. Pharm. Anal. 10, 97–101 (2020).
Becherer, L. et al. Loop-mediated isothermal amplification (LAMP)-review and classification of methods for sequence-specific detection. Anal. Methods. 12, 717–746 (2020).
Lin, X. et al. Fast and parallel detection of four ebola virus species on a microfluidic-chip-based portable reverse transcription loop-mediated isothermal amplification system. Micromachines 10 (2019).
da Silva, S. J. R., Pardee, K. & Pena, L. Loop-mediated isothermal amplification (LAMP) for the diagnosis of Zika virus: A review. Viruses 12, 1–20 (2020).
Cao, Z. et al. Visual detection of West Nile virus using reverse transcription loop-mediated isothermal amplification combined with a vertical flow visualization strip. Front. Microbiol. 7, 1–9 (2016).
Ahn, S. J. et al. Rapid and simple colorimetric detection of multiple influenza viruses infecting humans using a reverse transcriptional loop-mediated isothermal amplification (RT-LAMP) diagnostic platform. BMC Infect. Dis. 19, 1–12 (2019).
Ole Kwallah, A. et al. A real-time reverse transcription loop-mediated isothermal amplification assay for the rapid detection of yellow fever virus. J. Virol. Methods 193, 23–27 (2013).
Goo, N. I. & Kim, D. E. Rolling circle amplification as isothermal gene amplification in molecular diagnostics. Biochip J. 10, 262–271 (2016).
Krishnan, M., Ugaz, V. M. & Burns, M. A. PCR in a Rayleigh-Bénard convection cell. Science 298, 793 (2002).
Li, J., Macdonald, J. & von Stetten, F. Review: A comprehensive summary of a decade development of the recombinase polymerase amplification. Analyst 144, 31–67 (2019).
Lee, H. H. et al. Simple amplification-based assay: A nucleic acid-based point-of-care platform for HIV-1 testing. 201, 65–72 (2010).
Aman, R., Mahas, A. & Mahfouz, M. Nucleic acid detection using CRISPR/Cas biosensing yechnologies. ACS Synth. Biol. 9, 1226–1233 (2020).
Deeks, J. J., Bossuyt, P. M. & Gatsonis, C. Cochrane Handbook for Systematic Reviews of Diagnostic Test Accuracy. (The Cochrane Collaboration, 2010).
Whiting, P. F. et al. QUADAS-2: A revised tool for the quality assessment of diagnostic accuracy studies. Ann. Intern. Med. 154, 253–260 (2011).
Doebler, P & Holling, H. Meta-Analysis of Diagnostic Accuracy with Mada. https://cran.r-project.org/web/packages/mada/vignettes/mada.pdf (2020).
R Core Team. R: A Language and Environment for Statistical Computing. (R Foundation for Statistical Computing). https://www.r-project.org/ (2020)
Van Enst, W. A., Ochodo, E., Scholten, R. J., Hooft, L. & Leeflang, M. M. Investigation of publication bias in meta-analyses of diagnostic test accuracy: A meta-epidemiological study. BMC Med. Res. Methodol. 14, 70, https://doi.org/10.1186/1471-2288-14-70 (2014).
Deeks, J. J., Macaskill, P. & Irwig, L. The performance of tests of publication bias and other sample size effects in systematic reviews of diagnostic test accuracy was assessed. J. Clin. Epidemiol. 58, 882–893 (2005).
McInnes, M. D. F. et al. Preferred reporting items for a systematic review and meta-analysis of diagnostic test accuracy studies the PRISMA-DTA statement. JAMA J. Am. Med. Assoc. 319, 388–396 (2018).
Ali, Z. et al. iSCAN: An RT-LAMP-coupled CRISPR-Cas12 module for rapid, sensitive detection of SARS-CoV-2. Preprint at https://www.medrxiv.org/content/10.1101/2020.06.02.20117739v1 (2020)
Anahtar, M. N. et al. Clinical assessment and validation of a rapid and sensitive SARS-CoV-2 test using reverse-transcription loop-mediated isothermal amplification. Preprint at https://www.medrxiv.org/content/10.1101/2020.05.12.20095638v1 (2020)
Arizti-Sanz, J. et al. Integrated sample inactivation, amplification, and Cas13-based detection of SARS-CoV-2. Preprint at https://www.biorxiv.org/content/10.1101/2020.05.28.119131v1 (2020)
Assennato, S. M. et al. Performance evaluation of the point-of-care SAMBA II SARS-CoV-2 Test for detection of SARS-CoV-2. Preprint at https://www.medrxiv.org/content/10.1101/2020.05.24.20100990v3 (2020)
Baek, Y. H. et al. Development of a reverse transcription-loop-mediated isothermal amplification as a rapid early-detection method for novel SARS-CoV-2. Emerg. Microbes Infect. 9, 998–1007 (2020).
Basu, A. et al. Performance of abbott id now covid-19 rapid nucleic acid amplification test using nasopharyngeal swabs transported in viral transport media and dry nasal swabs in a New York city academic institution. J. Clin. Microbiol. 58, e01136–20, https://doi.org/10.1128/JCM.01136-20 (2020)
Behrmann, O. et al. Rapid detection of SARS-CoV-2 by low volume real-time single tube reverse transcription recombinase polymerase amplification using an exo probe with an internally linked quencher (Exo-IQ). Clin. Chem. 66, 1047–1054 (2020).
Ben-Assa, N. et al. SARS-CoV-2 on-the-spot virus detection directly from patients. Preprint at https://www.medrxiv.org/content/10.1101/2020.04.22.20072389v2 (2020)
Brandsma, E. et al. Rapid, sensitive and specific SARS coronavirus-2 detection : a multi-center comparison between standard qRT-PCR and CRISPR based DETECTR. Preprint at https://www.medrxiv.org/content/10.1101/2020.07.27.20147249v1 (2020)
Broughton, J. P. et al. CRISPR – Cas12-based detection of SARS-CoV-2. Nat. Biotechnol. 38, 870–874 (2020).
Buck, M. D. et al. Standard operating procedures for SARS-CoV-2 detection by a clinical diagnostic RT-LAMP assay. Preprint at https://www.medrxiv.org/content/10.1101/2020.06.29.20142430v1 (2020)
Bulterys, P. L. et al. Comparison of a laboratory-developed test targeting the envelope gene with three nucleic acid amplification tests for detection of SARS-CoV-2. J. Clin. Virol. 129, 104427 (2020).
Butt, A. M., Siddique, S., An, X. & Tong, Y. Development of a dual-gene loop-mediated isothermal amplification (LAMP) detection assay for SARS-CoV-2: A preliminary study. Preprint at https://www.medrxiv.org/content/10.1101/2020.04.08.20056986v1 (2020)
Chow, F. W. N. et al. A rapid, simple, inexpensive, and mobile colorimetric assay covid-19-lamp for mass on-site screening of covid-19. Int. J. Mol. Sci. 21, 5380, https://doi.org/10.3390/ijms21155380 (2020).
Collier, D. A. et al. Rapid point of care nucleic acid testing for SARS-CoV-2 in hospitalised patients: A clinical trial and implementation study. Preprint at https://www.medrxiv.org/content/10.1101/2020.05.31.20114520v2 (2020).
Thi, V. L. D. et al. A colorimetric RT-LAMP assay and LAMP-sequencing for detecting SARS-CoV-2 RNA in clinical samples. Sci. Transl. Med. 12, eabc7075, https://doi.org/10.1126/scitranslmed.abc7075 (2020).
Dong, Y. et al. Comparative evaluation of 19 reverse transcription loop-mediated isothermal amplification assays for detection of SARS-CoV-2. Preprint at https://www.medrxiv.org/content/10.1101/2020.07.22.20159525v1 (2020)
Fowler, V. L. et al. A highly effective reverse-transcription loop-mediated isothermal amplification (RT-LAMP) assay for the rapid detection of SARS-CoV-2. Preprint at infection https://www.medrxiv.org/content/10.1101/2020.06.30.20142935v4 (2020).
Ganguli, A. et al. Rapid isothermal amplification and portable detection system for SARS-CoV-2. Proc. Natl. Acad. Sci. U. S. A. 117, 22727–22735 (2020).
Ghofrani, M. et al. Performance characteristics of the ID NOW COVID-19 assay : A regional health care system experience. Preprint at https://www.medrxiv.org/content/10.1101/2020.06.03.20116327v1 (2020)
Go, Y. Y. et al. Evaluation and clinical validation of two field-deployable reverse transcription-insulated isothermal PCR assays for the detection of the middle east respiratory syndrome-coronavirus. J. Mol. Diagn. 19, 817–827 (2017).
Gouilh, M. A. R. et al. An easy, reliable and rapid SARS-CoV2 RT-LAMP based test for point-of-care and diagnostic lab. Preprint at https://www.medrxiv.org/content/10.1101/2020.09.25.20200956v1 (2020)
Haq, F. et al. Development Optimization and Validation of RT-LAMP based COVID-19 Facility in Pakistan. Preprint at https://www.biorxiv.org/content/10.1101/2020.05.29.124123v1 (2020).
Hong, T. C. et al. Development and evaluation of a novel loop-mediated isothermal amplification method for rapid detection of severe acute respiratory syndrome coronavirus development and evaluation of a novel loop-mediated isothermal amplification method for rapid detection. J. Clin. Microbiol. 42, 1956–1961 (2004).
Hou, T. et al. Development and evaluation of a rapid CRISPR-based diagnostic for COVID-19. PLoS Pathog. 16, e1008705, https://doi.org/10.1371/journal.ppat.1008705 (2020).
Hu, X. et al. Development and clinical application of rapid and sensitive loop-mediated isothermal amplification test for SARS-CoV-2 infection. mSphere 5, e00808–20, https://doi.org/10.1128/mSphere.00808-20 (2020).
Huang, W. E. et al. RT-LAMP for rapid diagnosis of coronavirus SARS-CoV-2. Microb. Biotechnol. 13, 950–961 (2020).
Jiang, M. et al. Development and validation of a rapid single-step reverse transcriptase loop-mediated isothermal amplification (RT-LAMP) system potentially to be used for reliable and high-throughput screening of COVID-19. Preprint at https://www.medrxiv.org/content/10.1101/2020.03.15.20036376v2 (2020).
Joung, J. et al. Point-of-care testing for COVID-19 using SHERLOCK diagnostics. Preprint at https://www.medrxiv.org/content/10.1101/2020.05.04.20091231v1 (2020).
Kellner, M. J. et al. A rapid, highly sensitive and open-access SARS-CoV-2 detection assay for laboratory and home testing. https://www.biorxiv.org/content/10.1101/2020.06.23.166397v2 (2020).
Kim, Y. et al. Single-strand RPA for rapid and sensitive detection of SARS-CoV-2 RNA. Preprint at https://www.medrxiv.org/content/10.1101/2020.08.17.20177006v2 (2020).
Kitagawa, Y. et al. Evaluation of rapid diagnosis of novel coronavirus disease (COVID-19) using loop-mediated isothermal amplification. J. Clin. Virol. 129, 104446, https://doi.org/10.1016/j.jcv.2020.104446 (2020).
L’Helgouach, N. et al. EasyCOV : LAMP based rapid detection of SARS-CoV-2 in saliva. Preprint at https://www.medrxiv.org/content/10.1101/2020.05.30.20117291v1 (2020).
Lamb, L. E., Bartolone, S. N., Ward, E. & Chancellor, M. B. Rapid detection of novel coronavirus/severe acute respiratory syndrome coronavirus 2 mediated isothermal amplification. PLoS One 15, e0234682, https://doi.org/10.1371/journal.pone.0234682 (2020).
Lee, J. Y. H. et al. Validation of a single-step, single-tube reverse transcription loop-mediated isothermal amplification assay for rapid detection of SARS-CoV-2 RNA. J. Med. Microbiol. 69, 1169–1178 (2020).
Li, S. et al. Highly sensitive and specific diagnosis of coronavirus disease 19 (COVID-19) by reverse transcription multiple cross displacement amplification-labelled nanoparticles biosensor. Eur. Respir. J. 19, 2002060, https://doi.org/10.1183/13993003.02060-2020 (2020).
Lu, R. et al. A novel reverse transcription loop-mediated isothermal amplification method for rapid detection of sars-cov-2. Int. J. Mol. Sci. 21, 2826, https://doi.org/10.3390/ijms21082826. (2020).
Lu, R. et al. Development of a novel reverse transcription loop-mediated isothermal amplification method for rapid detection of SARS-CoV-2. Virol. Sin. 35, 344–347 (2020).
Mohon, A. N. et al. Development and validation of direct RT-LAMP for SARS-CoV-2. Preprint at https://www.medrxiv.org/content/10.1101/2020.04.29.20075747v2 (2020).
Moore, N. M., Li, H., Schejbal, D., Lindsley, J. & Hayden, M. K. Comparison of two commercial molecular tests and a laboratory-developed modification of the CDC 2019-nCOV RT-PCR assay for the qualitative detection of SARS-CoV-2 from upper respiratory tract specimens. Preprint at https://www.medrxiv.org/content/10.1101/2020.05.02.20088740v1 (2020).
Nassir, A. A., Baptiste, M. J., Mwikarago, I. & Habimana, M. R. RPA-Based method for the detection of SARS-CoV-2. Preprint at https://www.medrxiv.org/content/10.1101/2020.09.17.20196402v1 (2020).
Osterdahl, M. et al. Detecting SARS-CoV-2 at Point of Care: Preliminary Data Comparing Loop-Mediated Isothermal Amplification (LAMP) to PCR. Preprint at https://www.medrxiv.org/content/10.1101/2020.04.01.20047357v1 (2020).
Papadakis, G. et al. Real-time colorimetric LAMP methodology for quantitative nucleic acids detection at the point-of-care. Preprint at https://www.biorxiv.org/content/10.1101/2020.07.22.215251v1 (2020).
Patchsung, M. et al. Clinical validation of a Cas13-based assay for the detection of SARS-CoV-2 RNA. Nat. Biomed. Eng. https://doi.org/10.1038/s41551-020-00603-x (2020).
Peto, L. et al. Diagnosis of SARS-CoV-2 infection with LamPORE, a high- throughput platform combining loop-mediated isothermal amplification and nanopore sequencing. Preprint at https://www.medrxiv.org/content/10.1101/2020.09.18.20195370v1 (2020).
Poon, L. L. M. et al. Rapid detection of the severe acute respiratory syndrome (SARS) coronavirus by a loop-mediated isothermal amplification assay. Clin. Chem. 50, 1050–1052 (2004).
Qian, J. et al. An enhanced isothermal amplification assay for viral detection. Preprint at https://www.biorxiv.org/content/10.1101/2020.05.28.118059v1 (2020).
Ramachandran, A. et al. Electric-field-driven microfluidics for rapid CRISPR-based diagnostics and its application to detection of SARS-CoV-2. Preprint at https://www.biorxiv.org/content/10.1101/2020.05.21.109637v1 (2020).
Rodel, J. et al. Use of the Veriplex SARS-CoV-2 RT-LAMP as a rapid molecular assay to complement RT-PCR for COVID-19 diagnosis. J. Clin. Virol. 132, 104616, https://doi.org/10.1016/j.jcv.2020.104616 (2020).
Rodriguez-manzano, J. et al. A handheld point-of-care system for rapid detection of SARS-CoV-2 in under 20 minutes. Preprint at https://www.medrxiv.org/content/10.1101/2020.06.29.20142349v1 (2020).
Rohaim, M. A. et al. Artificial intelligence-assisted loop mediated isothermal amplification (AI-LAMP) for rapid detection of SARS-CoV-2. Viruses 12, 972, https://doi.org/10.3390/v12090972 (2020).
Schermer, B. et al. Rapid SARS-CoV-2 testing in primary material based on a novel multiplex LAMP assay. Preprint at https://www.medrxiv.org/content/10.1101/2020.06.18.20130377v1 (2020).
Shirato, K. et al. Development of fluorescent reverse transcription loop-mediated isothermal amplification (RT-LAMP) using quenching probes for the detection of the Middle East respiratory syndrome coronavirus. J. Virol. Methods 258, 41–48 (2018).
Smithgall, M. C., Scherberkova, I., Whittier, S. & Green, D. A. Comparison of cepheid Xpert Xpress and Abbott ID now to Roche cobas for the rapid detection of SARS-CoV-2. J. Clin. Virol. 128, 104428 (2020).
SoRelle, J. et al. Evaluation of symptomatic patient saliva as a sample type for the Abbott ID NOW COVID-19 assay. Preprint at https://www.medrxiv.org/content/10.1101/2020.06.01.20119198v1 (2020).
Wang, B. et al. Rapid and sensitive detection of severe acute respiratory syndrome coronavirus by rolling circle amplification. J. Clin. Microbiol. 43, 2339–2344 (2005).
Wang, J. et al. Multiple-centre clinical evaluation of an ultrafast single-tube assay for SARS-CoV-2 RNA. Clin. Microbiol. Infect. 26, 1076–1081 (2020).
Wei, S. et al. Direct diagnostic testing of SARS-CoV-2 without the need for prior RNA extraction. Preprint at https://www.medrxiv.org/content/10.1101/2020.05.28.20115220v1 (2020).
Wu, T. et al. A reverse-transcription recombinase-aided amplification assay for the rapid detection of N gene of severe acute respiratory syndrome coronavirus 2(SARS-CoV-2). Virology 549, 1–4 (2020).
Xue, G. et al. Reverse-transcription recombinase-aided amplification assay for rapid detection of the 2019 novel coronavirus (SARS-CoV-2). Anal. Chem. 92, 9699–9705 (2020).
Yan, C. et al. Rapid and visual detection of 2019 novel coronavirus (SARS-CoV-2) by a reverse transcription loop-mediated isothermal amplification assay. Clin. Microbiol. Infect. 26, 773–779 (2020).
Yang, W. et al. Rapid Detection of SARS-CoV-2 Using Reverse transcription RT-LAMP method. Preprint at https://www.medrxiv.org/content/10.1101/2020.03.02.20030130v2 (2020).
Yoshimi, K. et al. Rapid and accurate detection of novel coronavirus SARS-CoV-2 using CRISPR-Cas3. Preprint at https://www.medrxiv.org/content/10.1101/2020.06.02.20119875v1 (2020).
Zhang, Y. et al. Rapid Molecular Detection of SARS-CoV-2 (COVID-19) Virus RNA Using Colorimetric LAMP. Preprint at https://www.medrxiv.org/content/10.1101/2020.02.26.20028373v1 (2020).
Zhu, X. et al. Multiplex reverse transcription loop-mediated isothermal amplification combined with nanoparticle-based lateral flow biosensor for the diagnosis of COVID-19. Biosens. Bioelectron. 166, 112437, https://doi.org/10.1016/j.bios.2020.112437 (2020).
Lei, X., Wen, H., Zhao, L. & Yu, X. Performance of reversed transcription loop-mediated isothermal amplification technique detecting EV71: A systematic review with meta-analysis. Biosci. Trends 8, 75–83 (2014).
Lee, S. H., Park, Y. H., Jin, Y. B., Kim, S. U. & Hur, J. K. CRISPR diagnosis and therapeutics with single base pair precision. Trends Mol. Med. 26, 337–350 (2020).
Gootenberg, J. S. et al. Multiplexed and portable nucleic acid detection platform with Cas13, Cas12a and Csm6. Science 360, 439–444 (2018).
Pardee, K. et al. Rapid, low-cost detection of Zika virus using programmable biomolecular components. Cell 165, 1255–1266 (2016).
Moher, D. et al. Preferred reporting items for systematic reviews and meta-analyses: The PRISMA statement. PLoS Med. 6 (2009).
Dinnes, J. et al. Rapid, point-of-care antigen and molecular-based tests for diagnosis of SARS-CoV-2 infection (Review). Cochrane Database Syst. Rev. 8, CD013705, https://doi.org/10.1002/14651858.CD013705 (2020).
Subsoontorn, P., Lohitnavy, M. & Kongkaew, C. The diagnostic accuracy of nucleic acid point-of-care tests for human coronavirus: A systematic review and meta-analysis. Preprint at https://www.medrxiv.org/content/10.1101/2020.07.09.20150235v1 (2020).
Acknowledgements
We would like to thank Dr. Norman Scholfield, Faculty of Pharmaceutical Sciences, Naresuan University, for editing the manuscript.
Funding
We received no financial support from any individual or organization.
Author information
Authors and Affiliations
Contributions
P.S. conceptualized the research. P.S. and C.K. performed systematic review and meta-analysis. P.S., C.K. and M.L. wrote the manuscript.
Corresponding author
Ethics declarations
Competing interests
The authors declare no competing interests.
Additional information
Publisher's note
Springer Nature remains neutral with regard to jurisdictional claims in published maps and institutional affiliations.
Supplementary Information
Rights and permissions
Open Access This article is licensed under a Creative Commons Attribution 4.0 International License, which permits use, sharing, adaptation, distribution and reproduction in any medium or format, as long as you give appropriate credit to the original author(s) and the source, provide a link to the Creative Commons licence, and indicate if changes were made. The images or other third party material in this article are included in the article's Creative Commons licence, unless indicated otherwise in a credit line to the material. If material is not included in the article's Creative Commons licence and your intended use is not permitted by statutory regulation or exceeds the permitted use, you will need to obtain permission directly from the copyright holder. To view a copy of this licence, visit http://creativecommons.org/licenses/by/4.0/.
About this article

Cite this article
Subsoontorn, P., Lohitnavy, M. & Kongkaew, C. The diagnostic accuracy of isothermal nucleic acid point-of-care tests for human coronaviruses: A systematic review and meta-analysis. Sci Rep 10, 22349 (2020). https://doi.org/10.1038/s41598-020-79237-7
Received:
Accepted:
Published:
DOI: https://doi.org/10.1038/s41598-020-79237-7
This article is cited by
-
Comparison of PCR-HRM, colorimetric LAMP and culture based diagnostic assays in the detection of endometritis caused by Streptococcus equi subsp. zooepidemicus in mares
Veterinary Research Communications (2023)
-
Diagnostic Efficacy of LAMP Assay for Human Fungal Pathogens: a Systematic Review and Meta-analysis
Current Fungal Infection Reports (2023)
-
Vivid COVID-19 LAMP is an ultrasensitive, quadruplexed test using LNA-modified primers and a zinc ion and 5-Br-PAPS colorimetric detection system
Communications Biology (2023)
-
Modular micro-PCR system for the onsite rapid diagnosis of COVID-19
Microsystems & Nanoengineering (2022)
-
Social distancing and mask-wearing could avoid recurrent stay-at-home restrictions during COVID-19 respiratory pandemic in New York City
Scientific Reports (2022)
Comments
By submitting a comment you agree to abide by our Terms and Community Guidelines. If you find something abusive or that does not comply with our terms or guidelines please flag it as inappropriate.
