
Abstract
Education and intelligence are highly correlated and inversely associated with schizophrenia. Counterintuitively, education genetically associates with an increased risk for the disease. To investigate why, this study applies a multivariable Mendelian randomization of intelligence and education. For those without college degrees, older age of finishing school associates with a decreased likelihood of schizophrenia—independent of intelligence—and, hence, may be entangled with the health inequalities reflecting differences in education. A different picture is observed for schooling years inclusive of college: more years of schooling increases the likelihood of schizophrenia, whereas higher intelligence distinctly and independently decreases it. This implies the pleiotropy between years of schooling and schizophrenia is horizontal and likely confounded by a third trait influencing education. A multivariable Mendelian randomization of schooling years and bipolar disorder reveals that the increased risk of schizophrenia conferred by more schooling years is an artefact of bipolar disorder – not education.
Introduction
Schizophrenia is a heterogeneous neurological syndrome, typically presenting in early adolescence, and observationally associated with lower intelligence and lower educational attainment1,2,3.
Education is positively associated with many health outcomes4,5. Counterintuitively, more years of schooling is genetically associated with an increased risk for schizophrenia3. Intelligence and education are highly positively correlated both phenotypically (r = 0.8)6 and genetically (r = 0.7)7. The traits are bidirectionally causally related: higher intelligence causes more years of schooling and more years of schooling increases intelligence8. The interwoven traits are also pleiotropically related to schizophrenia: a recent genome-wide association (GWA) study found evidence of an increased risk for schizophrenia for the single-nucleotide polymorphisms (SNPs) tagging years of schooling (P = 3.2 × 10⁻⁴) and strong genetic covariance between cognitive performance and increased years of schooling (P = 9.9 × 10−50)9.
Three possible explanations exist for the associations between intelligence, education, and schizophrenia: vertical, horizontal, and confounding pleiotropy (Fig. 1). Uncovering the nature of these relationships could inform interventional strategies. To that end, this study uses univariable and multivariable Mendelian randomization (MR) to appraise these pleiotropic relationships and considers two measures of education: 1) age at completion of full-time schooling without a college degree (Education Age) and 2) years of schooling inclusive of college (Education Years). Due to the nature of the pleiotropy suggested by the findings for Education Years and schizophrenia, the study also considers a multivariable MR appraisal of Education Years and bipolar disorder in relation to schizophrenia.
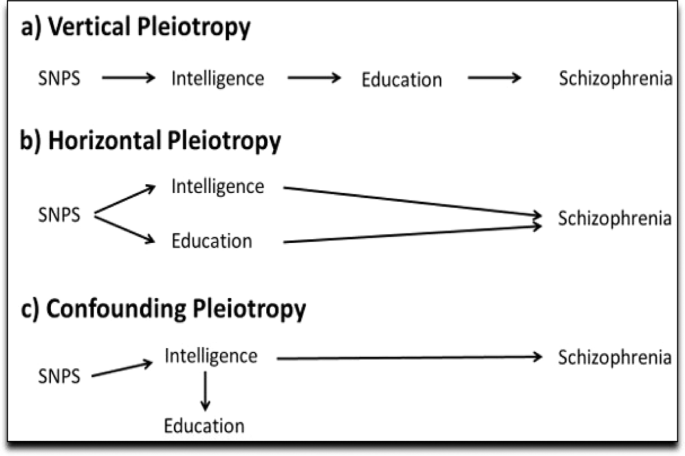
Possible explanations for the pleiotropy between intelligence, education, and schizophrenia. An example of vertical pleiotropy would be the SNPs for intelligence influencing schizophrenia (only) through their effect on education. Vice versa, the SNPs for education might influence schizophrenia (only) through their effect on intelligence. Since education influences intelligence, an increase in intelligence from education might influence risk for schizophrenia (a). An example of horizontal pleiotropy would be if the SNPs for intelligence and/or the SNPs for education have independent, direct effects on schizophrenia (b). An example of confounding pleiotropy would be if education has no influence on schizophrenia but appears to due to strong association with intelligence. Vice versa, intelligence might not influence schizophrenia but appears to due to strong association with education (c). Multivariate MR can be used to investigate these relationships. (Multivariable MR does not eliminate potential bias from pleiotropic pathways not tested for in a given model5. For instance, in a multivariable MR of education and intelligence on schizophrenia, the multivariable analysis would not overcome possible bias from other traits, such as depression43.).
Results
Table 1 and Table 2 contain the results for (i) the univariable (total) effects of education and intelligence on schizophrenia, (ii) the univariable results for the (total) effect of bipolar disorder on schizophrenia, and (iii) the bidirectional effects of Education Years and intelligence.
MR-Egger intercept
While inverse-variance weighted (IVW) column provides the main MR results in Tables 1 and 2, the MR-Egger intercept column is shaded grey. This is because its interpretation is different than that of the IVW and the other sensitivity estimators; the MR-Egger intercept provides a test for directional pleiotropy and an assessment of the validity of the instrument assumptions10. If the intercept is not different than 1 on the exponentiated scale (or 0 on the non-exponentiated scale), that indicates a lack of evidence for bias in the IVW estimate. For all the univariable results, the MR-Egger intercept demonstrated no evidence for pleiotropy (P > 0.05).
Education Years (Lee instrument) on schizophrenia
An increased (but null) effect on schizophrenia is observed for Education Years (odds ratio (OR) for schizophrenia per SD increase in years of schooling: IVW estimate 1.13; 95% CI 0.98, 1.29; P = 0.085). The sensitivity estimators are discrepant both in direction and magnitude of effects, indicating possible unwanted pleiotropy. Simulation extrapolation (SIMEX), which adjusts the MR-Egger estimate for potential regression dilution to the null11, did not ameliorate the discrepancy for the MR-Egger estimate.
Education Years (Okbay instrument) on schizophrenia
In contrast, a robust increased risk for schizophrenia is observed for the Education Years: OR for schizophrenia per SD increase in Education Years: instrument estimate 1.49; 95% CI 1.23, 1.81; P < 0.001). There is comportment in the direction of effects among the sensitivity estimators. The weak F-statistic for the Lee instrument may explain the discrepancy between the Lee and Okbay results (see the Methods section for a discussion of the F-statistics).
Education age on schizophrenia
A strong protective effect against schizophrenia is observed for Education Age (OR for schizophrenia per SD increase in Education Age): IVW estimate 0.46; 95% CI 0.28, 0.76; P = 0.002). The sensitivity estimators align both in direction and magnitude of effects.
Intelligence (Hill instrument) on schizophrenia
A protective effect of intelligence against schizophrenia is observed for both the Hill and UK Biobank instrumental variables. There is, however, substantial disagreement between the IVW and MR-Egger estimates for the Hill instrument, which was rescued by SIMEX correction (the direction of the effect is reversed towards that of the IVW). The remaining discordance in the sensitivity estimators for the Hill instrument likely indicates pleiotropy: OR for schizophrenia per SD increase in intelligence: IVW estimate 0.76; 95% CI 0.63, 0.93; P = 0.007.
Intelligence (UK Biobank instrument) on schizophrenia
A robust protective effect against schizophrenia is observed for the UK Biobank instrument (OR for per SD increase in intelligence): IVW estimate 0.86; 95% CI 0.78, 0.95; P = 0.006. The sensitivity estimators align.
IQ = intelligence; UKBB = UK Biobank; EduYears=Education Years; EduAge=Education Age; P = P-value; F = F-statistic; OR = odds ratio; CI = confidence interval. IVW = inverse-weighted variance test; IVW is the primary MR method. The MR-Egger, weighted median estimator, and weighted mode estimators are included as sensitivity tests to examine horizontal pleiotropy. The magnitude and direction of their effects in comparison to the IVW are what are gauged—and are more informative than their p-values. If the magnitudes and directions of effects are similar to those of the IVW, this provides some evidence against pleiotropy. (When p-values for the sensitivity estimators are>0.05, this does not invalidate the results from the IVW estimate; it simply means that the sensitivity estimators do not provide additional evidence in support of the IVW findings.) SIMEX = simulation extrapolation, a correction that adjusts the MR-Egger estimate for potential regression dilution to the null11. The MR-Egger intercept is shaded grey because it is interpreted differently than the IVW estimate and the sensitivity estimators; the MR-Egger intercept provides a test for directional pleiotropy10. If the MR-Egger intercept is not different than 1 (P > 0.05), that indicates a lack of evidence for bias due to pleiotropy in the IVW estimate.
Bipolar disorder on schizophrenia
An increased risk for schizophrenia is observed per genetic liability to bipolar disorder (IVW estimate 1.17; 95% CI 1.09, 1.26; P < 0.001). The effect estimate is reversed for the MR-Egger estimator, and the magnitudes of the various estimators vary, possibly indicative of some unwanted pleiotropy.
Multivariable results
Figure 2 contains the comparison of the univariable and multivariable (adjusted) estimates for the effects of education and intelligence on schizophrenia and bipolar disorder and education (Education Years) on schizophrenia.

Comparison of univariable and multivariable (adjusted) estimates of the effects of education and intelligence on schizophrenia and bipolar disorder and Education Years on schizophrenia. IQ = intelligence; EduYears=Education Years; EduAge=Education Age; SZ = schizophrenia; UKBB = UK Biobank; OR = odds ratio; CI = confidence interval.
Intelligence, adjusting for education age
The impact of intelligence on schizophrenia attenuates to the null when adjusting for Education Age (adjusted OR for schizophrenia per SD increase in intelligence: IVW estimate 0.92; 0.82, 1.04; P = 0.219). One explanation for the difference observed between the univariable and multivariable MR estimates for the effect of intelligence on schizophrenia is that intelligence affects schizophrenia through its effect on Education Age, rather than through a direct effect on schizophrenia.
Intelligence, adjusting for education years
The protective effect of intelligence remains after adjusting for Education Years (adjusted OR for schizophrenia per SD increase in intelligence: IVW estimate 0.84; 95% CI 0.74, 0.94; P = 0.004). This suggests intelligence has a robust and direct protective effect against schizophrenia. The effect attenuates some in comparison to the univariable model, perhaps reflecting the loss of the contribution of Education Years to intelligence.
Education age, adjusting for intelligence
A direct protective effect against schizophrenia is observed for Education Age (adjusted OR for schizophrenia per SD increase in Education Age: IVW estimate 0.51; 95% 0.30, 0.89; P = 0.02).
Education years, adjusting for intelligence
An increased risk for schizophrenia is observed for Education Years (adjusted OR for schizophrenia per SD increase in Education Years: IVW estimate 1.95; 95% 1.43, 2.67; P < 0.001). Together with the multivariable results for intelligence when adjusted for Education Years, these findings strongly suggest that the underlying pleiotropy between intelligence and Education Years is horizontal in relationship to schizophrenia (Fig. 1b) and that the relationship is additionally caught up by the presence of an unmeasured confounder (similar to Fig. 1c).
The horizontal pleiotropy and opposing directions of effect for Education Years and intelligence prompted a univariable investigation of bipolar disorder and schizophrenia and a multivariable Mendelian randomization of bipolar disorder and Education Years on schizophrenia. The proposed hypothesis is seen in Fig. 3.

Hypothesized relationships between Education Years, intelligence, bipolar disorder, and schizophrenia suggested by the multivariable analysis of education and intelligence on schizophrenia. DAG = directed acyclic graph.
Education years on schizophrenia, adjusting for bipolar disorder
The increased risk for Education Years on schizophrenia attenuated to the null when accounting for bipolar disorder (adjusted OR: IVW estimate 1.31; 95% CI 0.87, 1.98; P = 0.207).
Bipolar disorder on schizophrenia, adjusting for education years
A direct, increased risk is observed for genetic liability to bipolar disorder on schizophrenia (adjusted OR for schizophrenia: IVW estimate 1.16, 95% CI 1.01, 1.33; P = 0.033).
Bidirectional relationship between education years and intelligence
Table 2 and Fig. 4 depict the results for the bidirectional analysis of Education Years and intelligence. A SD-unit higher intelligence causes more Education Years (β 0.45, 95% CI 0.42, 0.48; P < 0.001) and a SD-year more of Education Years increases intelligence (β 1.90, 95% CI 1.80, 1.99; P < 0.001). These findings replicate those of Anderson et al. (2018)8.

Bidirectional relationship between intelligence (IQ) and Education Years (EduYears). LD = linkage disequilibrium.
EduYears=Education Years; EduAge=Education Age; IQ = intelligence; F = F-statistic; β = beta coefficient; α = MR-Egger intercept estimate; P = P-value; CI = confidence interval. The MR-Egger intercept column is shaded grey because it is interpreted differently than the IVW estimate and the sensitivity estimators; the MR-Egger intercept provides a test for directional pleiotropy10. If the MR-Egger intercept is not different than 0 (P > 0.05), that indicates a lack of evidence for bias due to pleiotropy in the IVW estimate.
Discussion
The MR findings show that, for those without college degrees, older age of finishing school (Education Age) associates with a decreased likelihood of schizophrenia—independent of intelligence. For those without college degrees, education—not intelligence—acts as the mechanism conferring protection against schizophrenia. The implications of this are uncertain, since the protective effect is likely to be entangled with the social inequalities linked to educational attainment. Nonetheless, efforts to retain at-risk adolescents in school, especially those beginning to show features of cognitive impairment, may be worth exploring, even if difficult to implement societally.
A different picture is observed for years of schooling inclusive of college (Education Years): more schooling years increases the likelihood of schizophrenia, whereas higher intelligence distinctly and independently decreases it. This implies the pleiotropy between schooling years and schizophrenia is horizontal and likely confounded by a third trait also influencing Education Years. Further to this, bipolar disorder, associated observationally with both higher education and schizophrenia3,12,13, was investigated along with Education Years, using multivariable MR. The findings suggest that the increased risk of schizophrenia conferred by more schooling years is an artefact of bipolar disorder – not Education Years.
Educational attainment has been described as feature of bipolar disorder12,13. Bipolar disorder shares some cognitive deficits and genetic overlap with schizophrenia, but also predisposes to cognitive adeptness and creativity that distinguish it from the more neurodevelopmental aspects of schizophrenia3. This complex picture is reflected in the horizontal and confounding pleiotropy uncovered by the multivariate analyses here. Specifically, when bipolar disorder is not accounted for, it appears that more years of schooling increase risk for schizophrenia. Hence, bipolar disorder is a confounder of the relationship between Education Years and schizophrenia. Since more years of schooling increase intelligence and higher intelligence strongly protects against schizophrenia, these findings imply that staying in school is neuroprotective.
The bidirectional analysis of intelligence and Education Years revealed that higher intelligence increases years of schooling and years of schooling increase intelligence, replicating the findings by Anderson et al. (2018). Anderson et al. observed over a two-fold greater magnitude of effect for Education Years on intelligence (IVW estimate=1.04; 95% CI 0.99, 1.10) compared with intelligence on Education Years (IVW estimate=0.51; 95% CI 0.49, 0.54)8. This comports with what was found in the present study. Given the multivariable finding that Education Years does not cause schizophrenia once bipolar disorder is accounted for, the bidirectional causation between intelligence and Education Years strengthens the implication that staying in higher education longer may have beneficial consequences against acquisition of schizophrenia.
The primary strength of this study is that it capitalizes on the power of seven large GWA studies to probe these complexly related traits. It is the most detailed and comprehensive joint investigation of them to date. An unintended benefit of doing so demonstrates the value of these massive public datasets for etiologic discovery.
The study has several limitations. MR critically relies on the validity of the instrumental variables. As such, measures were taken to assess the robustness of the analyses to potential unwanted pleiotropy, including the use of instruments lacking between-SNP heterogeneity and comparison of the IVW estimate with a battery of sensitivity estimators, each making different assumptions.
Another possible limitation, which, like unwanted pleiotropy, cannot be entirely ruled out, is the possible introduction of bias caused by some instances of the same individuals being included in the GWA studies of both the exposures and the outcomes. The greatest overlap is likely to be for the Lee Education Years instrument on intelligence and the Hill intelligence instrument on Lee’s Education Years. However, since that bidirectional appraisal is a replication of Anderson et al.’s (2018) study that used non-overlapping samples with comparable results, the impact of the bias is likely to be minimal.
Methods
Conceptual approach
MR is an instrumental variables technique, and, as a heuristic, it is analogous to a randomized controlled trial. It capitalizes on several features of the genome for causal inference:
- 1)
Mendel’s Laws of Inheritance,
- 2)
genotype assignment at conception, and
- 3)
Two-sample MR (Fig. 5) uses summary statistics from two genome-wide association (GWA) studies10,17,18,19,20,21. Bidirectional MR, as the name suggests, is an MR method for examining causal relationships in two directions. Bidirectional MR helps orient the causal direction and determine whether both traits causally influence each other—“bidirectional causation”. Multivariable MR permits adjustment, similar to multivariable regression to adjust for potential confounders in observational studies22. Multivariable MR is especially useful when two variables are highly correlated with each other, as is the case for Education Years and intelligence. In a multivariable MR analysis of Education Years and intelligence on schizophrenia, the estimated effect of Education Years is the effect given a constant level of intelligence, and the effect for intelligence is the effect given a constant level of Education Years. The effect estimates from univariable and multivariable MR can be compared to obtain total (univariable, unadjusted) and direct (multivariable, adjusted) effects.

Two-sample Mendelian randomization testing the causal effect of intelligence or education on schizophrenia. Estimates of the SNP-intelligence (or SNP-education) associations (\({\hat{\beta }}_{{ZX}}\)) are calculated in sample 1 (from GWA study of intelligence or GWA study of education). The association between these same SNPs and schizophrenia are then estimated in sample 2 (\({\hat{\beta }}_{{ZY}}\)) (from a schizophrenia GWA study). These estimates are combined into Wald ratios (\({\hat{\beta }}_{{XY}}\)=\({\hat{\beta }}_{{ZY}}/{\hat{\beta }}_{{ZX}}\)). The \({\hat{\beta }}_{{XY}}\) estimates are meta-analyzed using the inverse-variance weighted analysis (\(\hat{\beta }\) IVW) method. The IVW method produces an overall causal estimate of intelligence and/or education on schizophrenia.
Mendelian randomization assumptions
In order for MR to be valid, three assumptions must hold: (i) the SNPs acting as the instrumental variables must be strongly associated with the exposure; (ii) the instrumental variables must be independent of confounders of the exposure and the outcome; and (iii) the instrumental variables must be associated with the outcome only through the exposure19,23. For example, for the present analysis, the following assumptions must hold: (i) genetic variants robustly associated with Education Years must be chosen as instruments to test the causal relationship between Education Years and schizophrenia; (ii) the genetic variants chosen to instrument Education Years must not be associated with confounders of the relationship between Education Years and schizophrenia; and (iii) the genetic variants chosen to instrument Education Years must only impact schizophrenia through their impact on Education Years. When violated, assumption (iii) describes horizontal pleiotropy (Fig. 1b), which can invalidate causal inference from vertical (Fig. 1a) pleiotropy probed in univariable MR designs.
GWA study data sources for instruments
Education age on schizophrenia
Two measures of education were selected to instrument education: age at completion of full-time schooling without a college degree (Education Age) and years of schooling inclusive of college (Education Years). The Education Age measure was obtained from field 845 in the UK Biobank project24,25. Participants were asked if they had a college or university degree. Those without a college or university degree were asked what age they left continuous full-time education. Summary statistics for a GWA study of Education Age (adjusted for sex and 10 principal components), including 226,899 UK Biobank participants who answered field 845, are publicly available; the GWA study was performed by the Neale lab, after transforming the item into a normally distributed quantitative variable26 (SNP coefficients per standard deviation (SD) units of Education Age). Because the instrument for Education Age captures only those without college or university degrees, the inference from the use of Education Age as an instrument is restricted to those without college or university degrees.
The F-statistic, a function of how much variance in a trait is explained by an instrument (R2), the sample size, and the number of SNPs in an instrument, provides an indication of instrument strength27. F-statistics <10 are conventionally considered to be weak28. The F-statistic for the Education Age instrument is 13.3.
Education years on schizophrenia
The primary years of schooling measure was obtained from the Lee et al. (2018) GWA study of 1,131,881 participants of European ancestry from 71 cohorts29. Education Years was measured for those who were at least 30 years of age, and International Standard Classification of Education (ISCED) categories were used to impute a years-of-education equivalent (SNP coefficients per SD units of years of schooling). The F-statistic for the Lee Education Years instrument is 4.7, indicating the instrument may be weak. Due to this, a second measure of Education Years from a smaller GWA study of years of schooling was used to construct a second instrument for Education Years9. The Okbay et al. (2016) GWA study used the same construction of Education Years as did Lee et al. (2018) GWA study and contained 293,723 participants of European ancestry9. The Okbay Education Years instrument has an F-statistic of 11.3. Because it is aptly strong, the Okbay Education Years instrument was used in the multivariate model of intelligence and education on schizophrenia.
Education years on intelligence (Bidirection 1)
The Lee et al. (2018) GWA study was used to extract SNPs for the first part of the bidirectional analysis of education on intelligence. The instrument has an F-statistic of 5.8, indicating it may be inadequately strong. However, a bidirectional appraisal of Education Years and intelligence using the Okbay et al. (2016) GWA study for instrumental variables was previously reported8. The Anderson et al. study is treated as a natural-history sensitivity analysis, since they included fewer and (likely) stronger SNPs (148 compared to 299, respectively), which can increase the F parameter30. (See Table 3 for a list of the number of selected SNPs for each of the instrumental variables).
Intelligence on schizophrenia (Hill instrument)
Two GWA studies were used to create instruments for intelligence. The first came from the Hill et al. (2019), which included 248,482 individuals of European ancestry (SNP coefficients per one SD increase in intelligence test scores7. The instrument’s F-statistic is 14.9.
Intelligence on schizophrenia (UK Biobank instrument)
A second instrument for intelligence was constructed from a GWA study performed by the Neale lab using the UK Biobank measure for fluid intelligence (field 20016) (n = 108,818). The participants answered 13 logic questions within two minutes and the number of correct answers were summed. The data were transformed into a normally distributed quantitative variable (SNP coefficients per one SD unit increase in fluid intelligence score)26. The instrument’s F-statistic is 26.
Intelligence on Education Years (Bidirection 2)
The Hill et al. (2019) GWA study of intelligence was used for the second part of the bidirectional analysis of intelligence and education (Education Years). The instrument has an F-statistic of 42.2.
Bipolar disorder on schizophrenia
A GWA of bipolar disorder containing 16,731 participants of European descent (of which 7,481 were cases) was available for the instrument for bipolar disorder31. The instrument has an F-statistic of 34.5.
GWA study data sources for outcomes
Intelligence
Because the full GWA study summary data were unavailable for the Hill GWA study of intelligence, the UK Biobank GWA study of intelligence (n = 108,818) was used as the outcome GWA study for the tests of Education Years and Education Age on intelligence.
Education (education years)
Full summary data were available for 766,345 participants in the Lee et al. Education Years GWAS.
Education (education age)
Full summary data were available for 226,899 participants in the UK Biobank Education Age GWAS.
Schizophrenia
Full summary data were available for a schizophrenia GWA study dataset containing 82,315 participants of European ancestry, of which 35,476 were cases32.
Instrument construction
For each instrument (\({\hat{\beta }}_{{ZX}}\)), independent (those not in linkage disequilibrium, LD; R2 < 0.01) SNPs associated at genome-wide significance (P < 5 × 10⁻⁸) with a trait were extracted from within their respective GWA study. The summary statistics for the instrument-associated SNPs were then extracted from an outcome GWA study (\({\hat{\beta }}_{{ZY}}\)). SNP-exposure and SNP-outcome associations were harmonized with the “harmonization_data” function within the MR-Base “TwoSampleMR” package within R17,33. Harmonized SNP-exposure and SNP-outcome associations were combined with the IVW method (Fig. 5).
For the bidirectional associations between intelligence and schooling years, SNPs tagging both traits at genome-wide significance and/or SNPs that were in LD between intelligence and schooling years were excluded. This is because overlapping SNPs can invalidate bidirectional MR findings21,34. In addition, for all instrumental variables, RadialMR regression35 was run to detect SNP outliers. Outlier SNPs were removed. All instrumental variables included in this analysis have Cochrane’s Q-statistic P-values indicating no evidence for heterogeneity between SNPs36 (heterogeneity statistics are provided in Supplementary Tables 4, 7, 10, 13, 16, 21, 24, 27, and 30).
Sensitivity analyses
To address possible violations to MR assumption (iii), MR-Egger regression, weighted median, and weighted mode MR methods were run as complements to the IVW method for the univariable models. When the magnitudes and directions of the various MR methods comport across estimators, this lack of heterogeneity is a screen against pleiotropy. The reason for this is that various MR sensitivity estimators make different assumptions about the underlying nature of pleiotropy. It is unlikely there would be homogeneity in the direction and magnitudes of their effect estimates if there were substantial violations to the pleiotropy assumption.
Comparing the IVW and the sensitivity estimators is a form of triangulation: integrating several approaches with different assumptions to weigh causal evidence37. Briefly, a drawback of the primary IVW estimator is that its estimate can be biased if one or more the SNPs in its multi-allelic genetic instrument are directionally pleiotropic38. The MR-Egger sensitivity estimator can provide unbiased estimates of causal effects, even if all SNPs in an instrument are invalid due to pleiotropy. But the SNPs in the genetic instrument must not violate the Instrument Strength Independent of Direct Effect (“InSIDE”) assumption, and measurement error in the genetic instrument must be negligible (“No Measurement Error” assumption). The weighted median estimator can provide unbiased causal effects, assuming at least 50% of the chosen SNPs are valid. The weighted mode estimator assumes the most common effect estimate among SNPs in an instrument comes from a valid instrument. Elaborate descriptions of the various MR methods and the different assumptions they make about pleiotropy are described elsewhere38,39,40. For the purposes of understanding how to interpret the IVW and sensitivity estimators in the present study, the IVW is the main estimator. The others are provided to compare their magnitudes and directions of effect with those of the IVW.
In addition to the comparative sensitivity estimators, a SIMEX correction was performed for all univariate tests to correct potentional regression to the null in the MR-Egger estimates41 (Supplementary Tables 5, 8, 11, 14, 17, 22, 25, 28, 31).
Number of tests
In total, 14 MR tests were run. Table 3 contains a list of the tests and the number of instrumental variables (detailed characteristics for the individual SNPs used in each model are provided in Supplementary Tables 3, 6, 9, 12, 15, 20, 23, 26, and 29). These 14 tests are not independent; a false-discovery rate (FDR)-correction was applied to the raw P-values to assess whether the penalization changed the inference (Supplementary Table 2). As it did not, the raw P-values are reported for the following reasons: the inference remained unchanged, the FDR-adjustment is overly conservative in this case, and P-values alone are not the best guide for causal inference42.
Statistical software
SIMEX corrections were perfomed in Stata SE/16.0. All other described analyses were performed in R version 3.5.2 with the “TwoSampleMR” package17.
Data availability
All data sources used for SNP-exposure and SNP-outcome associations are publicly available. The data for the Hill intelligence7 and Lee Education Years29 instruments were obtained directly from the supplementary files accompanying their primary papers. The remaining data used for these analyses, including UK Biobank GWA studies run by the Neale lab, are accessible within MR-Base: http://www.mrbase.org/18.
References
Kendler, K. S., Ohlsson, H., Sundquist, J. & Sundquist, K. IQ and schizophrenia in a Swedish national sample: their causal relationship and the interaction of IQ with genetic risk. Am J Pyschiatry 172, 259–265 (2015).
Gale, C. R., Batty, G. D., Tynelius, P., Deary, I. J. & Rasmussen, F. Intelligence in early adulthood and subsequent hospitalization for mental disorders. Epidemiology 21, 70–77 (2010).
Bansal, V. et al. Genome-wide association study results for educational attainment aid in identifying genetic heterogeneity of schizophrenia. Nat Commun 9, (2018).
Clark, D. & Royer, H. The effect of education on adult mortality and health: evidence from Britain. Am Econ Rev 103, 2087–2120 (2013).
Davies, N. M. et al. Multivariable two-sample Mendelian randomization estimates of the effects of intelligence and education on health. Elife 8, 1–22 (2019).
Deary, I. J., Strand, S., Smith, P. & Fernandes, C. Intelligence and educational achievement. Intelligence 35, 13–21 (2007).
Hill, W. D. et al. A combined analysis of genetically correlated traits identifies 187 loci and a role for neurogenesis and myelination in intelligence. Mol Psychiatry 24, 169–181 (2019).
Anderson, E. L. et al. Education, intelligence and Alzheimer’s disease: evidence from a multivariable two-sample Mendelian randomization study. bioRxiv 401042 https://doi.org/10.1101/401042 (2018).
Okbay, A. et al. Genome-wide association study identifies 74 loci associated with educational attainment. Nature 533, 539–542 (2016).
Burgess, S. & Thompson, S. G. Interpreting findings from Mendelian randomization using the MR-Egger method. Eur J Epidemiol 32, 377–389 (2017).
Spiller, W., Slichter, D., Bowden, J. & Davey Smith, G. Detecting and correcting for bias in Mendelian randomization analyses using Gene-by-Environment interactions. Int J Epidemiol https://doi.org/10.1093/ije/dyy204 (2018).
MacCabe, J. H. et al. Excellent school performance at age 16 and risk of adult bipolar disorder: National cohort study. Br J Psychiatry 196, 109–115 (2010).
Vreeker, A. et al. High educational performance is a distinctive feature of bipolar disorder; a study on cognition in bipolar disorder, schizophrenia patients, relatives and controls. Psychol Med 46, 807–818 (2016).
Davey Smith, G. & Ebrahim, S. ‘Mendelian randomization’: Can genetic epidemiology contribute to understanding environmental determinants of disease? Int J Epidemiol 32, 1–22 (2003).
Schooling, C. M., Freeman, G. & Cowling, B. J. Mendelian randomization and estimation of treatment efficacy for chronic diseases. Am J Epidemiol 177, 1128–1133 (2013).
Hemani, G., Bowden, J. & Smith, G. D. Evaluating the potential role of pleiotropy in Mendelian randomization studies. Hum Mol Genet 27, 195–208 (2018).
Hemani, G. et al. The MR-Base platform supports systematic causal inference across the human phenome. Elife 7, 1–29 (2018).
Burgess, S., Butterworth, A. & Thompson, S. G. Mendelian randomization analysis with multiple genetic variants using summarized data. Genet Epidemiol 37, 658–665 (2013).
Bowden, J., Smith, G. D. & Burgess, S. Mendelian randomization with invalid instruments: effect estimation and bias detection through Egger regression. Int J Epidemiol 44, 512–525 (2015).
Johnson, T. Efficient calculation for multi-SNP genetic risk scores. In American Society of Human Genetics Annual Meeting. 10.1038/ng.784 (2012).
Davey Smith, G. & Hemani, G. Mendelian randomization: genetic anchors for causal inference in epidemiological studies. Hum Mol Genet 23, R89–98 (2014).
Sanderson, E., Davey Smith, G., Windmeijer, F. & Bowden, J. An examination of multivariable Mendelian randomization in the single-sample and two-sample summary data settings. Int J Epidemiol 48, 713–727 (2019).
Didelez, V. & Sheehan, N. Mendelian randomization as an instrumental variable approach to causal inference. Stat Methods Med Res. 16, 309–330 (2007).
Collins, R. What makes UK Biobank special? Lancet 379, 1173–1174 (2012).
Sudlow, C. et al. UK Biobank: an open access resource for identifying the causes of a wide range of complex diseases of middle and old age. Plos Med 12, 1–10 (2015).
Neale Lab. Rapid GWAS of thousands of phenotypes for 337,000 samples in the UK Biobank. (2017).
Burgess, S. & Thompson, S. G. Avoiding bias from weak instruments in mendelian randomization studies. Int J Epidemiol 40, 755–764 (2011).
Pierce, B. L. & Burgess, S. Efficient design for mendelian randomization studies: subsample and 2-sample instrumental variable estimators. Am J Epidemiol 178, 1177–1184 (2013).
Lee, J. J. et al. Gene discovery and polygenic prediction from a genome-wide association study of educational attainment in 1.1 million individuals. Nat Genet 50, 1112–1121 (2018).
Burgess, S., Davies, N. M. & Thompson, S. G. Bias due to participant overlap in two-sample Mendelian randomization. Genet Epidemiol 40, 597–608 (2016).
Sklar, P. et al. Large-scale genome-wide association analysis of bipolar disorder identifies a new susceptibility locus near ODZ4. Nat Genet 43, 977–985 (2011).
Ripke, S. et al. Biological insights from 108 schizophrenia-associated genetic loci. Nature 511, 421–7 (2014).
R Core Team. R: a language and environment for statistical computing, Vienna, Austria (2013). URL http://www.R-project.org/.
Richmond, R. C. & Davey Smith, G. Commentary: orienting causal relationships between two phenotypes using bidirectional Mendelian randomization. Int J Epidemiol 48, 907–911 (2019).
Bowden, J. et al. Improving the visualization, interpretation and analysis of two-sample summary data Mendelian randomization via the Radial plot and Radial regression. Int J Epidemiol 1–15 https://doi.org/10.1093/ije/dyy101 (2018).
Del Greco M, F., Minelli, C., Sheehan, N. A. & Thompson, J. R. Detecting pleiotropy in Mendelian randomisation studies with summary data and a continuous outcome. Stat. Med. 34, 2926–2940 (2015).
Lawlor, D. A., Tilling, K. & Davey Smith, G. Triangulation in aetiological epidemiology. Int J Epidemiol 45, 1866–1886 (2016).
Spiller, W., Davies, N. M. & Palmer, T. M. Software application profile: mrrobust — a tool for performing two-sample summary Mendelian randomization analyses. Int J Epidemiol 48, 684–690 (2019).
Yarmolinsky, J. et al. Appraising the role of previously reported risk factors in epithelial ovarian cancer risk: a Mendelian randomization analysis. PLOS Med 16, e1002893 (2019).
Hwang, L., Lawlor, D. A., Freathy, R. M., Evans, D. M. & Warrington, N. M. Using a two-sample Mendelian randomization design to investigate a possible causal effect of maternal lipid concentrations on offspring birth weight. Int J Epidemiol 005, 1–11 (2019).
Bowden, J., Greco, D., Minelli, C., Davey Smith, G. & Thompson, J. A framework for the investigation of pleiotropy in two-sample summary data Mendelian randomization. Stat Med 36, 1783–1802 (2017).
McShane, B. B., Gal, D., Gelman, A., Robert, C. & Tackett, J. L. Abandon statistical significance. Am. Stat. 73, 235–245 (2019).
Sniekers, S. et al. Genome-wide association meta-analysis of 78,308 individuals identifies new loci and genes influencing human intelligence. Nat Genet 49, 1107–1112 (2017).
Acknowledgements
Thank you to the cohorts that made their GWA study summary data public.
Author information
Authors and Affiliations
Corresponding author
Ethics declarations
Competing interests
The authors declare no competing interests.
Additional information
Publisher’s note Springer Nature remains neutral with regard to jurisdictional claims in published maps and institutional affiliations.
Supplementary information
Rights and permissions
Open Access This article is licensed under a Creative Commons Attribution 4.0 International License, which permits use, sharing, adaptation, distribution and reproduction in any medium or format, as long as you give appropriate credit to the original author(s) and the source, provide a link to the Creative Commons license, and indicate if changes were made. The images or other third party material in this article are included in the article’s Creative Commons license, unless indicated otherwise in a credit line to the material. If material is not included in the article’s Creative Commons license and your intended use is not permitted by statutory regulation or exceeds the permitted use, you will need to obtain permission directly from the copyright holder. To view a copy of this license, visit http://creativecommons.org/licenses/by/4.0/.
About this article

Cite this article
Adams, C.D. A multivariable Mendelian randomization to appraise the pleiotropy between intelligence, education, and bipolar disorder in relation to schizophrenia. Sci Rep 10, 6018 (2020). https://doi.org/10.1038/s41598-020-63104-6
Received:
Accepted:
Published:
DOI: https://doi.org/10.1038/s41598-020-63104-6
This article is cited by
-
Cognitive performance protects against Alzheimer’s disease independently of educational attainment and intelligence
Molecular Psychiatry (2022)
-
The impact of educational attainment, intelligence and intellectual disability on schizophrenia: a Swedish population-based register and genetic study
Molecular Psychiatry (2022)
Comments
By submitting a comment you agree to abide by our Terms and Community Guidelines. If you find something abusive or that does not comply with our terms or guidelines please flag it as inappropriate.
