
Abstract
Transcript abundance of histone variants, modifiers of histone and DNA in bovine in vivo oocytes and embryos were measured as mean transcripts per million (TPM). Six of 14 annotated histone variants, 8 of 52 histone methyl-transferases, 5 of 29 histone de-methylases, 5 of 20 acetyl-transferases, 5 of 19 de-acetylases, 1 of 4 DNA methyl-transferases and 0 of 3 DNA de-methylases were abundant (TPM >50) in at least one stage studied. Overall, oocytes and embryos contained more varieties of mRNAs for histone modification than for DNA. Three expression patterns were identified for histone modifiers: (1) transcription before embryonic genome activation (EGA) and down-regulated thereafter such as PRMT1; (2) low in oocytes but transiently increased for EGA such as EZH2; (3) high in oocytes but decreased by EGA such as SETD3. These expression patterns were altered by in vitro culture. Additionally, the presence of mRNAs for the TET enzymes throughout pre-implantation development suggests persistent de-methylation. Together, although DNA methylation changes are well-recognized, the first and second orders of significance in epigenetic changes by in vivo embryos may be histone variant replacements and modifications of histones.
Introduction
The basic unit of chromatin, the nucleosome, consists of the histone octamer wrapped by 147 bp of DNA. In eukaryotes, the histone octamer is comprised of two of each core histone proteins (H2A, H2B, H3 and H4). Nucleosomes are further packaged and stabilized by linker DNA and linker histone proteins (H1/H5)1.
During cell division, the continuous demand for histone proteins to package newly replicated DNA is satisfied by newly synthesized histones and those recycled from the parental cells2. The production of histones is either replication-dependent or independent. Canonical histones are expressed only during the S phase of the cell cycle and their incorporation into chromatin is tightly coordinated with DNA replication2. Instead of the poly(A) tails providing stability, their transcripts contain a 3′ end stem-loop structure which contributes to their stability3,4. Replication-independent histones, however, are transcribed throughout the cell cycle and their incorporation into nucleosomes is independent of DNA synthesis5. These histones are also known as replacement histone variants and are translated from polyadenylated mRNAs. These mRNAs may originally contain introns before fully maturing, and in some cases, undergo alternative splicing which allows them to encode distinct isoforms6,7. In mammals, most histones have multiple variants. However, to date, no replacement variants have been identified for H48. H2B is yet another histone variant that is understudied, and no bovine histone H2B variant has been annotated so far.
In mice, sperm replace histones with protamine in order for the DNA to be densely compacted. After fertilization, the male pronucleus undergoes protamine-to-histone exchange through the incorporation of maternal histone variants, mainly H3.3, an H3 variant9. The resulting pre-implantation embryos undergo even further and more dynamic changes in chromatin composition as a result of replacement by other histone variants10,11. These observations were consistent with findings from mouse somatic cell nuclear transfer (SCNT) studies, which reported rapid replacement of H2A and H3 histones of the donor cells by oocyte-stored H2AFX and H3 variants, respectively12. Together, these mouse studies demonstrated that the incorporation of oocyte-stored histone variants into the genome of donor somatic cells or sperm is essential for modulating chromatin structures and gene expression of the newly formed embryos.
Embryonic genome activation (EGA) is the process during which the embryonic genome is actively transcribed13,14. Both the timing of EGA and proper activation of specific genes are essential to embryonic development. The timing of EGA is very different among mammalian species and is usually correlated to the speed of embryonic development14. For example, EGA occurs at the 2-cell stage in mice15 and between 4–8 cell stage in humans16. Although EGA in bovine in vitro embryos occurs between the 8–16 cell stage17, in vivo embryos actively transcribe their genome between the 4–8 cell stage18,19.
Gene expression changes are also profoundly regulated by post-translational modifications of histones, such as acetylation, methylation, phosphorylation, ubiquitylation, sumoylation and ADP-ribosylation20. Among these, acetylation and methylation of lysine residues by acetyl-transferases and methyl-transferases, respectively, are the most studied modifications. These modifications could also be reversed by de-acetylases and de-methylases21,22. DNA methylation is another mechanism of transcription regulation. It has recently been reported that maternal stored nuclear reprogramming factors, such as DNA de-methylation enzymes by oxidation, ten-eleven translocation 3 (TET3), along with histone variants and histone post-translational modification enzymes, contribute to embryonic genome activation and embryonic totipotency23.
The roles of histone variants and histone/DNA modifications during pre-implantation development has been a major field of research5,8,24. Previous studies employing semi-quantitative real time-PCR revealed altered expression patterns of histone and DNA modifying enzymes in bovine oocytes and embryos from assisted reproductive technologies, such as in vitro fertilization and SCNT25,26. However, a comprehensive profile of these important epigenetic regulators from bovine in vivo embryos has not been published. Here, we report data-mining results from an RNA-Seq study of bovine in vivo produced oocytes and pre-implantation embryos18. We document distinct waves of changes in mRNAs for histone variants as well as histone/DNA modifying enzymes. Although there have been widely recognized DNA methylation dynamics in early embryos, we found much higher levels as well as more varieties of mRNAs for histone variants and for the modification of histones than for DNA, suggesting a bigger/more important roles of histone modifications in pre-implantation embryonic development. Moreover, we also compared the differences of these transcripts between in vivo and in vitro produced embryos and identified alterations of genes expression by in vitro culture.
Results
Registry of mRNAs for Histone Variants, and Histone/DNA Modifying Enzymes
A summary of mRNAs for replication-independent histone variants, histone/DNA modifying enzymes that have been annotated in the bovine as well as those that were detected in bovine oocytes and pre-implantation embryos is shown in Table 1. The mRNAs for a total of 116 out of the 141 annotated genes were detected (mean TPM >1). Epigenetic regulations in early development via histone variants (10 variants) and histone modification (100 enzymes) were more diverse than via DNA modifications (6 enzymes; Table 1). Among the 116 detected transcripts, the mRNAs for 30 different epigenetic modifiers (or 25.9%, 30/116) were abundant (Mean TPM >50) in at least one of the stages examined. Although more histone methylation modifiers were detected (64 out of 116), only 20.3% (13/64) were abundantly expressed. On the other hand, higher detection percentage of histone acetylation modifiers (10/36 or 27.8%) were abundant. It is also worth-noting that one-third of mRNAs detection for histone variants were at extremely high levels (TPM >1,000), while none of the histone/DNA modifiers reached such levels. Together, these observations showed that in pre-implantation development, epigenetic changes may occur mainly through histone variant replacements, secondly, histone modifications, and lastly, DNA modifications.
Abundance of mRNAs for histone variants
Among those annotated, the transcripts for only one bovine linker histone variants, H1FOO, were detected. At a TPM value of 1,872.3 (Fig. 1A), this oocyte-specific linker H1 was among the most abundant mRNAs in oocytes. H1FOO transcripts dropped dramatically after fertilization and after the 8-cell stage were barely detectable, presumably due to RNA degradation and lack of new transcription. Together, these data showed that it took as few as 3 rounds of cell divisions, or 2 days, for complete degradation of a large amount of transcripts in early embryos. Coincidentally, this is also the timing for bovine EGA18,19 in embryos developed in vivo. It is possible that H1FOO depletion facilitates the opening of the embryonic chromatin. In contrast, there was no detection of mRNA for other linker histone variants, such as H1F0, the testis-specific H1FNT or the somatic-specific H1FX, in all samples/stages.

Transcript abundance of bovine histone variants during in vivo preimplantation development (Mean ± SEM). MII = mature oocytes; 2C to 32C = 2- to 32-cell embryos; CM = compact morula; BL = blastocyst. Different letters above error bars indicate significant pair-wise differences.
Six H2A variants have been annotated in the bovine, the mRNA for five of them were detected: H2AFJ was barely present (Table S1), H2AFX/Y was maintained at low yet relatively constant levels across stages (Fig. 1C,D; P = 0.243, 0.167, respectively). In contrast, H2AFV/Z was abundant in at least one stage (Fig. 1B,E) and was either actively transcribed as a result of EGA between the 4- and 8-cell stages in bovine in vivo embryos. It was noteworthy that the mRNAs for H2AFV and H2AFZ were the most abundant among all detected H2 variants. H2AFZ, with a TPM value as high as 769.3 at the 8-cell stage (Table S1, Fig. 1E), averaged around 100X the level of the other H2 variants with the exception of H2AFV, suggesting its importance in post-EGA development.
For histone H3, there is the detection of four annotated variants, with high expression in three of them. Among the three H3 variants with high TPM values (i.e., H3F3A, H3F3B and CENPA), H3F3A was stored at extremely high levels in oocytes (~12,000 TPM, Fig. 1G) but decreases more than 3.8 times after fertilization. During embryonic development its levels remained high at around 5,000 TPM. H3F3B had an overall downward change across stages even though the oocytes contained large quantity of this transcript (Fig. 1H). Relative steady expression of the other abundant H3 variant, CENPA, along with H3F3C, was seen during early cleavage stages (p = 0.385, 0.180 respectively). They did, however, undergone a burst of expression at the 32- and 16- cell stages, respectively (Fig. 1F,I).
Levels of transcripts for histone modifying enzymes
Based on the current bovine genome assembly and annotation, we generated a list of genes that post-translationally modify histones (Table S2–5). The mRNAs for the majority of these genes were detected (100/120) in our bovine RNA-Seq data (Table 1).
Among histone methyl-transferases, three main patterns of changes were observed:
-
(1).
Transcription before EGA and down-regulated thereafter. These included PRMT1, which mono- and di-methylates Arg-4 of histone H4, SUV420H1, which trimethylates Lys-20 of histone H4, and LOC534913, also known as mariner-like transposase which is predicted to be a histone lysine methyltransferase. Their mRNAs were high before EGA, likely from storage in the oocytes and active transcription occurred at the 2- and 4-cell stages. Their transcription was turned off subsequently after EGA (Fig. 2A–C). Interestingly, although similar changes were seen for PRMT1 and SUV420H1, they methylate different residues of histone H4 and exert different effects on gene expression. PRMT1 leads to transcription activation while SUV420H1 leads to transcription repression (http://www.uniprot.org).
Figure 2 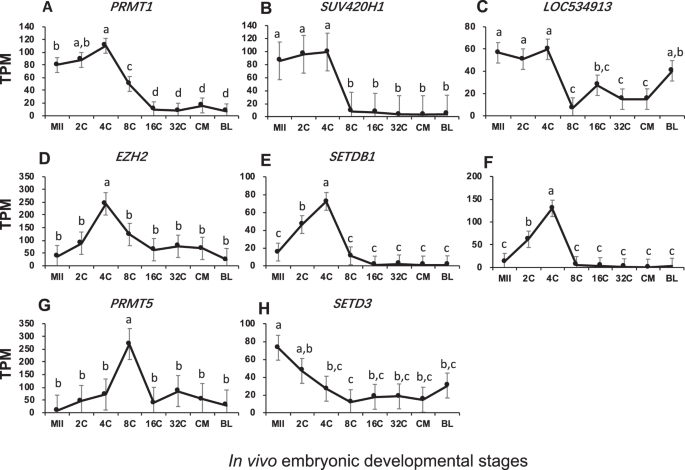
Transcript abundance of bovine histone methyltransferases during in vivo preimplantation development (Mean ± SEM). MII = mature oocytes; 2C to 32C = 2- to 32-cell embryos; CM = compact morula; BL = blastocyst. Different letters above error bars indicate significant pair-wise differences.
-
(2).
Low in oocytes but increased transiently for EGA. These included EZH2, which methylates Lys-9 and Lys-27 of histone H3, SETDB1/SUV39H2, which specifically trimethylates Lys-9 of histone H3, and PRMT5, which methylates Arg-8 of histone H3. They were transiently transcribed around EGA, reaching peak TPM values at the 4- or 8-cell stage (Fig. 2D–G). It has been reported that the histone methylation activity by these four enzymes represents a specific tag for transcription repression (http://www.uniprot.org).
-
(3).
High in oocytes but decreased from EGA. SETD3, which methylates Lys-4 and Lys-36 of histone H3 and acts as a transcriptional activator (http://www.uniprot.org), was inherited in oocytes and degraded dramatically after fertilization likely because of no active transcription (Fig. 2H).

Like histone methyltransferases, oocytes abundantly inherited histone demethylases including KDM1A/B (Fig. 3A,B). KDM1A can induce both transcription activation and repression by de-methylating Lys-4/9 of H3. Its mRNA degraded gradually after fertilization and this pattern of changes suggested that the early embryos may actively maintain de-methylation of H3 (Fig. 3A). On the other hand, KDM1B, which also de-methylates Lys-4 of histone H3, actively maintained its mRNA at the 2-cell stage but decreased dramatically before EGA (Fig. 3B). Active transcription of two other abundant histone demethylases, MINA and KDM5B, occurred before and after EGA, respectively (Fig. 3C,D). Together, these data suggested that except for KDM5B, de-methylation of histones mainly occurred on H3 before EGA.

Transcript abundance of bovine histone demethylases during in vivo preimplantation development (Mean ± SEM). MII = mature oocytes; 2C to 32C = 2- to 32-cell embryos; CM = compact morula; BL = blastocyst. Different letters above error bars indicate significant pair-wise differences.
In summary, the mRNA levels for histone methylation enzymes underwent dramatic changes mainly before and around EGA. Overall there as more mRNAs for histone methylation than for de-methylation.
For histone acetylation, abundant mRNAs for five of histone acetyltransferases and deacetylases were found (Figs 4 and 5). Maintenance of modest levels of mRNAs for histone acetyltransferases, CLOCK, KAT8, HAT1 and CREBBP, was seen across all stages, despite minor and insignificant changes (Fig. 4A–D). In contrast, transcripts of NCOA2, which binds with CREBBP to actively acetylate lysine residues on core histone tails, were inherited from oocytes at a moderate level with depletion occurring from EGA (Fig. 4E).

Transcript abundance of bovine histone acetyltransferase during in vivo preimplantation development (Mean ± SEM). MII = mature oocytes; 2C to 32C = 2- to 32-cell embryos; CM = compact morula; BL = blastocyst. Different letters above error bars indicate significant pair-wise differences.

Transcript abundance of bovine histone deacetylases during in vivo preimplantation development (Mean ± SEM). MII = mature oocytes; 2C to 32C = 2- to 32-cell embryos; CM = compact morula; BL = blastocyst. Different letters above error bar indicates pair-wise differences.
Three different expression patterns were also seen in histone deacetylases: (1) active transcription of HDAC2 occurred before EGA (Fig. 5A); (2) abundant inheritance of HDAC3 and SIRT3 transcripts from oocytes with active depletion through early development (Fig. 5B,C); and (3) relatively constant and moderate levels of transcripts for HDAC1/8 across stages (Fig. 5D,E). Unlike histone methylation, which can lead to either gene expression or repression, histone acetylation/deacetylation always open/close chromatin structure and activate/repress gene expression. The drop in the mRNAs for deacetylases likely prepared the embryos for more open chromatin at later stages. Also of note, mRNAs for histone acetylation/deacetylation were always present at modest levels across preimplantation development (Figs 4 and 5), while those for histone methylation/demethylation were mainly present before/around EGA (Figs 2 and 3).
Abundance of mRNAs for DNA modifying enzymes
Global embryonic DNA methylation has been reported to undergo dramatic changes first through active and then passive de-methylation, finishing with de novo active methylation27,28,29. The dynamics of mRNAs for DNA modifiers found here corresponded to the reported changes and also provided unique features for bovine in vivo embryos.
Transcripts for DNMT1 (Fig. 6A), a DNA methylation maintenance enzyme, were the most abundant among all DNA modifiers. The high storage of mRNA for DNMT1 in oocytes progressively depleted after fertilization. After EGA very low levels of DNMT1 mRNA remained, allowing embryos to passively de-methylate through cell divisions. In contrast, the mRNA for DNMT3A (Fig. 6B), which is responsible for DNA de novo methylation, was almost undetectable before the 16-cell stage but became the predominant DNA modifying mRNA at the blastocyst stage. These observations suggest that the first stage of differentiation in the blastocyst requires new methylation of DNA. DNMT3B transiently increased its mRNA levels during EGA which subsequently declined to basal levels (Fig. 6C), suggesting the role of new methylation for EGA. The protein DNMT3L is catalytically inactive but is required for establishment of proper genomic imprinting by possibly facilitating de novo DNA methylation by DNMT3A and DNMT3B30. Its mRNA, however, was not detected in bovine in vivo oocytes and embryos (Table S6).

Transcript abundance of bovine DNA modifiers during in vivo preimplantation development (Mean ± SEM). MII = mature oocytes; 2C to 32C = 2- to 32-cell embryos; CM = compact morula; BL = blastocyst. Different letters above error bars indicate significant pair-wise differences.
The TET family is so far the best characterized enzymes that actively initiate the removal of the methyl group from 5′ methylated cytidine (5 mC) to 5-hydroxymethylcytosine (5 hmC), 5-formylcytosine (5 fC) and 5-carboxylcytosine (5 caC) through oxidation. These modified cytidines are later replaced with unmodified cytosine via the thymine DNA glycosylase- (TDG) base excision repair pathway31,32. The mRNAs for two of the three TET genes, TET1 and TET3, were found to have a relatively significant presence in bovine post-EGA embryos and oocytes/pre-EGA embryos, respectively (Fig. 6D,F). Another TET member, TET2, was barely detected during pre-implantation development (Fig. 6E).
In total, six patterns of gene expression dynamics in histone variants, histone and DNA modifiers were seen in our study (Fig. 7). These were: (1) peaked in oocytes but decreased by EGA (red line), (2) transcription before EGA and down-regulated thereafter (orange line), (3) peaked at EGA (pink line), (4) activated post-EGA (green line), (5) peaked around the morula stage (blue line), and (6) peaked at the blastocyst stage (yellow line).

Patterns of changes in mRNAs of major histone variants and modifiers for histone and DNA at landmark stages of embryo development. The Y-axis does not represent the absolute levels of each transcript. MII = mature oocytes; EGA = embryonic genome activation; EM = early morula; BL = blastocyst. Histone variants:  ; Histone methyltransferases:
  ; Histone demethylases
  ; Histone acetyltransferase
  ; Histone deacetylases:
  ; DNA modifiers:
  .
.
Gene expression patterns of epigenetic modifiers in in vitro produced oocytes and embryos
Transcript abundance of bovine histone variants and histone/DNA modification proteins from in vitro produced oocytes and embryos is summarized in Table S7. The major difference between in vitro and in vivo produced bovine embryos was the timing of EGA, 8–16 cell stage In in vitro embryos17 and 4–8 cell stage in in vivo embryos18. Among the genes analyzed above, nine were different between the two groups. They were: PRMT5, KDM5B, KAT8, HDAC1, HDAC8, H2AFV, H2AFZ, HAT1, and TET1. Five of these, H2AFV, H2AFZ, PRMT5, KDM5B, and HAT1, had a delay in their peak expression from the 8-cell stage in in vivo embryos to the 16-cell stage in in vitro embryos (Fig. 8A–E). Moreover, the expression dynamics of the rest of the four genes, KAT8, HDAC1, HDAC8, and TET1, were different compared to those in the in vivo data (Fig. 8F–I).

Transcript abundance of bovine histone and DNA modifier during in vitro preimplantation development (Mean ± SEM). MII = mature oocytes; 4C to 16C = 4- to 16-cell embryos; BL = blastocyst. Different letters above error bars indicate significant pair-wise differences.
Validation of RNA-Seq data by qRT-PCR
All relative transcription levels were confirmed with the exception of one comparison, KANSL2 4-cell vs. blastocyst (Table 2). Only a difference of 2-fold change or Log2 (fold change) of greater than 1 was regarded as significantly changed. We found no significant changes in KANSL2 levels using RNA-seq [Log2 (fold change) = 0.3)], yet qPCR found a significant increase [Log2 (fold change) = 1.6)].
Discussion
Several lines of evidence support that histone H1 variant H1FOO is essential for in vitro meiotic maturation of mouse and bovine oocytes33,34. Over-expression of H1FOO in bovine oocytes prompted meiotic progression in vitro, while its down-regulation hindered oocyte maturation33. When injected into mouse germinal vesicle oocytes, antisense Morpholino oligonucleotides, which knocked down H1FOO, slowed the rate of in vitro maturation34. Replacement of somatic histone H1s by H1FOO was observed in embryos derived from both in vitro fertilization and SCNT35,36. Additionally, ectopically expressed H1FOO halted differentiation of embryonic stem cells into embryoid bodies37. These prior observations point to the importance of H1FOO in the maintenance of relatively quiescent chromatin structure before global gene activation. Our RNA-Seq data showed that the in vivo matured bovine oocytes stored high levels of mRNA for H1FOO, supporting the necessity for its high maintenance for maturation. Its subsequent and rapid disappearance in embryos suggest that H1FOO must be cleared from the early embryos before proper transition to EGA and differentiation could occur (Fig. 1A).
Incorporation of core histone variants are also essential during oocyte development and embryogenesis since the functions of these variants are more versatile than their linker counterparts for containing more post-translational modification sites38,39. For instance, using immunocytochemistry, Buhe et al. reported that H2A variants were deposited onto chromatin during mouse pre-implantation development11, and that H2AFX was the only abundant H2A variant after fertilization. While we also found major surges in mRNAs for H2A variants after fertilization, the specific variants were different than those reported in the mouse. In bovine pre-implantation embryos, H2AFZ and to a lesser extent H2AFV were pre-dominant after EGA (Figs 1B,E and 7). Yet, in the mouse, no incorporation of H2AFV or H2AFZ was observed until differentiation40. Thus, it appears that the dynamics of the H2A variants among mammalian species are not well-conserved. H2AFV and H2AFZ have been shown to prompt interactions among nucleosomes, which is critical in maintaining the high order structure of chromatin41, and essential for centromere assembly42. Although we observed an increase in mRNA for H2AFX at the 2-cell stage (Fig. 1C), which was likely a result of pre-EGA transcription, it was a minor H2A variant in the bovine as opposed in the mouse. H2AFX is reported to be largely phosphorylated during early embryogenesis in mice43, and its phosphorylation is required for the formation of the paternal pronucleus after fertilization in Xenopus44. Its role in bovine embryo development, however, may not be as critical as in the other species due to its lower mRNA levels. H2AFY, commonly known as macroH2A, has been shown to be actively replaced by other H2A variants from the maternal genome after fertilization45. It is also abundantly accumulated on the inactive X chromosome (XCI) in females and contributes to the long-term maintenance of the inactive state46,47. XCI in the bovine is completed during embryo elongation, a stage much later than in the mouse44. The levels of mRNAs for the gene H2AFY were present in early bovine embryos. It peaked in both the 8-cell and blastocyst stages. However, its overall expression levels were mostly lower than 15 TPM, suggesting that this transcription inhibitory H2A variant may be minimal during genome activation and blastulation (Figs 1D and 7).
In the mouse, the incorporation of H3F3A and H3F3B has been recognized as the marker for transcription activation and they preferentially integrate into the male pronuclei after fertilization48. This, at least in part, explains why paternal genome goes into transcription activation earlier9. These H3 variants maintain their occupation in the mouse embryos up to the blastocyst stage23. In the bovine embryos, however, both H3 variants H3F3A/B were extremely high in matured oocytes but then dramatically decreased, although their mRNA levels were still quite high compared to the other histone variants (Figs 1G,H and 7). These patterns of changes suggest that H3F3A/B were the predominant histone H3 variants in oocytes and subsequently their occupation was reduced and replaced by other H3 subtypes such as H3F3C and CENPA which temporarily peaked at the 16- and 32-cell stages (Figs 1F and 7). Such increases commensurate with the more centromere assembly and mitotic division activities at these stages49,50.
Canonical histone mRNAs have a unique stem loop-like 3′ end structure4, and were de-selected during poly(A) enrichment of RNA-seq library preparation. Thus, no replication-dependent histone transcripts should be detected here. However, we found that some canonical histone mRNAs were significantly abundant during bovine pre-implantation development (e.g. H2B, data not shown). The same observation was also reported in another RNA-Seq study in sheep, in which poly(A) selection was also employed51. By reviewing the mRNA sequences of these histones, we found that they all have high adenosine content after the 3′ stem loop structure, which would permit them to anneal with oligo-dT primers in library preparation and be detected.
In summary, our data suggest distinct waves of histone replacements by specific variants. It is likely that after fertilization and before EGA, the embryos first remove H1FOO and H3F3A/B, but add H2AFV/Z to the chromatin after EGA. To prepare for compaction, the embryos temporarily incorporate more H3F3C and CENPA into their nucleosomes.
The roles of histone post-translational modifications on chromatin remodeling and global gene expression have been well-documented. Yet, these roles are also very complex, especially for those by histone methylation. Mono-, di- or tri-methylation on different lysine residues of the histone tail leave chromatin structure in either open or closed state, resulting in transcription activation or repression52. Histone modifiers were the most diverse in bovine embryos and many had high transcript levels especially histone methyl transferases such as EZH2, SUV420H1, and PRMT5 (Figs 2–5). Although each histone modifiers had their own distinct pattern of changes, their dynamic changes correlated with major events of embryo development such as EGA (EZH2, SUV39H2, SUV420H1, LOC534913, MINA, HDAC3, and SIRT3; Fig. 7), and pre-compaction (PRMT5, and HDAC2; Fig. 7). In mice, three expression patterns of chromatin modifiers were also found and classified as “maternal”, “ubiquitous”, and “zygotic”49, corresponding in our study to “inherited from oocytes and decreased after fertilization”; “relatively constantly expressed”; and “actively transcribed as a result of EGA”, respectively. In bovine early embryos, however, we noticed another main pattern “transcribed before EGA and decrease thereafter” (e.g. Figs 2A–C and 7) as a result of minor EGA18. The presence of this unique pattern is likely because of the longer duration of embryogenesis in the bovine than in the mouse.
Specific histone modifiers are linked to embryonic chromatin remolding and gene expression. De novo synthesis of EZH2 protein after fertilization was found to be essential to mouse embryo development because inhibition of EZH2 synthesis at the pronuclear stage caused retarded embryo growth and reduced blastocyst rates53. In bovine, a burst of transcription for the EZH2 gene was observed at the 4-cell stage (Fig. 2D), which corresponded with the initiation of EGA in in vivo embryos18. Combined with fact that EZH2 trimethylates Lys-27 of histone H3 and leads to gene silencing, it would be of great interest to identify the specific genes that are turned off by EZH2, as well as to learn how the absence of these downstream genes initiates EGA and promotes early embryo development. Lys-9 of histone H3 is another potential methylation site. Trimethylation at this location serves as the loading dock for the heterochromatin organization protein HP1 and therefore is associated with transcription repression of the heterochromatin regions54. SETDB1 and SUV39H2 specifically trimethylates Lys-9 of histone H3. In bovine early embryos, we found a burst of expression for both of these histone methyltransferases around the 4-cell stage (Fig. 2E,F). These suggest that the formation of heterochromatin and inhibition of specific gene expression starts as early as EGA in the bovine, a stage when many genes are activated for expression. PRMT5 can methylate Arg-3 of H2A (in addition to Arg-8 of H3), which also leads to gene silencing55. This particular methylation may repress differentiation-associated genes, because PRMT5 was found to be important in early mouse embryos by maintaining pluripotency likely through the leukemia inhibitory factor (LIF)/Stat3 pathway55. In bovine embryos, a burst of expression in PRMT5 was found at the 8-cell stage (Fig. 2G), when the embryos start to lose totipotency to a pluripotent state56. Together these data suggest that PRMT5 may also be associated with maintaining pluripotency in the bovine.
Transcripts for the methylation maintenance enzyme, DNMT1, could only be observed before the 4-cell stage (Fig. 6A). This is consistent with the conclusion that the early embryos passively de-methylate due to a lack of this enzyme57. However, significant DNMT1 activity was found in in vitro produced embryos after the 8-cell stage, suggesting abnormal maintenance of DNA methylation58. Interestingly, the epigenetic regulator of DNMT1, UHRF1, had the same expression pattern as DNMT1 in our study (Table S6), suggesting the abnormal active regulation of this important DNA modifier by in vitro culture conditions.
In mice, the genome of the male pronucleus is actively de-methylated soon after fertilization27, but this genome-wide DNA de-methylation event has not be observed in sheep, and is less dramatic in cattle and pigs59,60,61. This difference may be explained by the observations that the male pronuclei of the bovine zygotes underwent de-methylation and immediately de novo re-methylation before the 2-cell stage28. Such rapid re-methylation likely requires high levels of DNA de novo methyl transferases. Our data, however, showed that the 2-cell bovine embryo did not contain high levels of mRNAs for either DNMT3A or DNMT3B (Fig. 6B,C). The only mRNA present for de novo methylation at this stage was DNMT3B (Fig. 6C). Albeit still low, it may be responsible for this rapid re-methylation process. DNA re-methylation at later stages up to the blastocysts as reported in IVF, parthenogenetic and SCNT embryos58, may be a result of DNMT3A as supported by our results of a dramatic increase in this transcript (Fig. 6B). In summary, bovine pre-implantation embryos’ de novo methylation may be primarily carried out by DNMT3B in early stages and then DNMT3A at the blastocyst stage.
Although transcripts for both TET2 and TET3 (Fig. 6E,F) were detected before the 8-cell stage and appeared to have been turned off by EGA, their levels in bovine early embryos were only moderate, supporting the observation that DNA de-methylation in the bovine is not be as dramatic as in the mouse62. The mRNA for TET1, however, had the opposite dynamic pattern. It was turned on by EGA and continued to increase until the 32-cell stage (Fig. 6D). Together, our data suggest that during the entire early bovine embryo development, DNA was de-methylated by a combined passive (lack of DNMT1) and active (presence of TET1) mechanisms. Because TET3 is present in the oocytes, it is likely responsible for the de-methylation of DNA in the male pronucleus. However, the combined presence of mRNAs for TET1-3 from oocytes to morula suggests that active de-methylation of DNA likely persists during the entire bovine pre-implantation embryo development. This, combined with the pattern of DNMT1, suggests that the bovine in vivo early embryos are de-methylated through both active and passive mechanisms from oocytes to blastocysts. Interestingly, the mRNA for the gene thymine DNA glycosylase (TGD), which participates in DNA demethylation by actively revers 5-hmC to cytosine through base excision repair63, was not detected in our database. This indicate that during early embryogenesis, active DNA demethylation can only be achieved by replication-dependent dilution of oxidized forms of 5mC.
In vitro cultured bovine embryos have a slower developmental speed (at least to EGA) compared to their in vivo counterparts as reflected by the delayed EGA to 8–16 cell stage18. Transcription of histone variant genes H2AFV and H2AFZ, histone methyltransferase PRMT5, histone demethylase KDM5B, and histone acetyltransferase HAT1 started at the 4-cell stage and peaked at the 8-cell stage in vivo. However, these changes peaked in in vitro embryos at the 16-cell stage, corresponding to their EGA. Transcripts for histone acetyltransferase KAT8 exhibited opposite dynamics. They peaked in 8-cell in in vivo but reached a nadir in their in vitro counterparts. However, neither patterns had significance differences across development. Additionally, histone deacetylases HDAC1, HDAC8, and DNA demethylase TET1 all had significant increases at the blastocysts stage in in vitro embryos only, potentially contributing to the epigenetic anomalies caused by in vitro culture26.
Using real time qPCR, we randomly selected 5 genes for validation. All changes from RNA-seq were confirmed by qPCR except for KANSL2 between 4-cell vs. blastocyst. Although high correlation between results of qPCR and RNA-Seq are expected64,65,66, this low level of inconsistency is not totally unexpected because each technology has its own strengths and weaknesses. The RNA-seq technology is highly automated for global gene expression profiling and may generate a low percentage of data that do not exactly reflect the expression status. Real time qPCR on the other hand, is more accurate but limited to quantification of one gene at a time67. In the case of discrepancy between results of RNA-seq and qPCR, we regard that the RNA-seq result may be inaccurate.
Materials and Methods
Data Mining
Previously, we established the transcriptional profiles of single bovine in vivo derived oocytes and pre-implantation embryos by RNA-Seq (Gene Expression Omnibus (GEO) accession number GSE59186)18. The quality and reproducibility of the preparation and sequencing methods were demonstrated by the high Pearson correlation efficiencies between the replicates18. We also downloaded RNA-Seq dataset (GEO accession number GSE52415)17 of in vitro produced oocytes and pre-implantation embryos to compare the differences between embryos developed under different environmental conditions.
Sequencing reads were normalized to TPM as final measurement of transcript abundance after trimming and mapping. TPM was preferred to FKPM because it normalizes transcriptome size across developmental stages68. The formula of TPM calculation for any given gene α (TPMα) is shown below: where Nα/Lα means the read counts for gene α divided by its transcript length and gives transcript length-adjusted read counts; while \(\sum _{i=1}^{n}\,({N}_{i}/{L}_{i})\) stands for the sum of length-adjusted read counts for all genes and is used to normalize transcriptome sizes of different samples.
To analyze the transcriptional profiles of epigenetic modifiers, lists of bovine annotated histone variants and histone/DNA modification proteins were generated according to the functional hierarchies in KEGG BRITE (http://www.genome.jp/kegg/brite.html#gene). Full lists of these genes are summarized in Table S8. Here, histone modifying enzymes refer to those that contain catalytic domains for post-translational modifications and/or are subunits of catalytic complexes. The transcriptional profiles for these genes were subsequently established by searching for these transcripts in our RNA-Seq dataset. Transcript abundance at each developmental stage was measured by TPM (Mean ± SEM). Genes with mean TPM values over 1, 50 and 1,000 were considered as detected, abundant and highly abundant, respectively.
Quantitative Real-Time PCR (qRT-PCR) validation of RNA-Seq data
Our results were also validated using qRT-PCR. Three genes were randomly selected from the list for histone related genes that had significant changes across stages. These included H3F3B (histone variant), SETDB1 (histone methyltransferase) and HDAC1 (histone deacetylase). Additionally, two genes were randomly selected from outside our list of genes that changed significantly, including KANSL2 and ASH2L. Their transcript abundance was measured in 4- to- 8-cell embryos and blastocysts. Expression level of each gene was normalized to GAPDH and inter-stage comparison was made using ∆∆Ct, which was later transformed to log2(fold changes). Only a difference of 2-fold change or Log2 (fold change) of greater than 1 was regarded as significantly changed.
Statistical analysis
All statistical analyses were conducted in Minitab (Minitab 18 Statistical Software, 2010; www.minitab.com), and significance was defined as p < 0.05. One-way ANOVA was used for comparing transcript abundance across stages. Multiple comparisons with Fisher’s Least Significant Difference (LSD) was used for pair-wise comparisons.
References
Bhasin, M., Reinherz, E. L. & Reche, P. A. Recognition and classification of histones using support vector machine. Journal of computational biology: a journal of computational molecular cell biology 13, 102–112 (2006).
Harris, M. E. et al. Regulation of histone mRNA in the unperturbed cell cycle: evidence suggesting control at two posttranscriptional steps. Molecular and cellular biology 11, 2416–24 (1991).
Pandey, N. B. & Marzluff, W. F. The stem-loop structure at the 3′ end of histone mRNA is necessary and sufficient for regulation of histone mRNA stability. Molecular and cellular biology 7, 4557–4559 (1987).
Dominski, Z. & Marzluff, W. F. Formation of the 3′ end of histone mRNA: Getting closer to the end. Gene 396, 373–390 (2007).
Loyola, A. & Almouzni, G. Marking histone H3 variants: how, when and why? Trends in biochemical sciences 32, 425–33 (2007).
Pandey, N. B., Chodchoy, N., Liu, T. J. & Marzluff, W. F. Introns in histone genes alter the distribution of 3′ ends. Nucleic acids research 18, 3161–3170 (1990).
Rasmussen, T. P. et al. Messenger RNAs encoding mouse histone macroH2A1 isoforms are expressed at similar levels in male and female cells and result from alternative splicing. Nucleic Acids Research 27, 3685–3689 (1999).
Santenard, A. & Torres-Padilla, M. E. Epigenetic reprogramming in mammalian reproduction: Contribution from histone variants. Epigenetics 4, 80–84 (2009).
Torres-Padilla, M. E., Bannister, A. J., Hurd, P. J., Kouzarides, T. & Zernicka-Goetz, M. Dynamic distribution of the replacement histone variant H3.3 in the mouse oocyte and preimplantation embryos. International Journal of Developmental Biology 50, 455–461 (2006).
Akiyama, T., Suzuki, O., Matsuda, J. & Aoki, F. Dynamic replacement of histone H3 variants reprograms epigenetic marks in early mouse embryos. Plos genetics 7, e1002279 (2011).
Nashun, B., Yukawa, M., Liu, H., Akiyama, T. & Aoki, F. Changes in the nuclear deposition of histone H2A variants during pre-implantation development in mice. Development (Cambridge, England) 137, 3785–94 (2010).
Nashun, B., Akiyama, T., Suzuki, M. G. & Aoki, F. Dramatic replacement of histone variants during genome remodeling in nuclear-transferred embryos. Epigenetics 6, 1489–1497 (2011).
Latham, K. E. & Schultz, R. M. Embryonic genome activation. Front. Biosci. 6, D748–759 (2001).
Jukam, D., Shariati, S. A. M. & Skotheim, J. M. Zygotic Genome Activation in Vertebrates. Dev. Cell 42, 316–332 (2017).
Schultz, R. M. Regulation of zygotic gene activation in the mouse. Bioessays 15, 531–538 (1993).
Braude, P., Bolton, V. & Moore, S. Human gene expression first occurs between the four- and eight-cell stages of preimplantation development. Nature 332, 459–461 (1988).
Graf, A. et al. Fine mapping of genome activation in bovine embryos by RNA sequencing. Proc. Natl. Acad. Sci. USA 111, 4139–4144 (2014).
Jiang, Z. et al. Transcriptional profiles of bovine in vivo pre-implantation development. BMC genomics 15, 756 (2014).
Kues, W. A. et al. Genome-wide expression profiling reveals distinct clusters of transcriptional regulation during bovine preimplantation development in vivo. Proceedings of the National Academy of Sciences of the United States of America 105, 19768–19773 (2008).
Kouzarides, T. Chromatin modifications and their function. Cell 128, 693–705 (2007).
Wood, A. & Shilatifard, A. Posttranslational modifications of histones by methylation. Advances in Protein Chemistry 67, 201–222 (2004).
Yuan, H. & Marmorstein, R. Histone acetyltransferases: Rising ancient counterparts to protein kinases. Biopolymers 99, 98–111 (2013).
Zhou, L. & Dean, J. Reprogramming the genome to totipotency in mouse embryos. Trends in Cell Biology 25, 82–91 (2015).
Biterge, B. & Schneider, R. Histone variants: key players of chromatin. Cell and tissue research 356, 457–66 (2014).
Xu, Y.-N., Cui, X.-S., Tae, J.-C., Jin, Y.-X. & Kim, N.-H. DNA synthesis and epigenetic modification during mouse oocyte fertilization by human or hamster sperm injection. Journal of assisted reproduction and genetics 28, 325–33 (2011).
Nowak-Imialek, M. et al. Messenger RNA expression patterns of histone-associated genes in bovine preimplantation embryos derived from different origins. Molecular reproduction and development 75, 731–43 (2008).
Santos, F., Hendrich, B., Reik, W. & Dean, W. Dynamic reprogramming of DNA methylation in the early mouse embryo. Developmental biology 241, 172–82 (2002).
Park, J. S., Jeong, Y. S., Shin, S. T., Lee, K.-K. & Kang, Y.-K. Dynamic DNA methylation reprogramming: active demethylation and immediate remethylation in the male pronucleus of bovine zygotes. Developmental dynamics: an official publication of the American Association of Anatomists 236, 2523–33 (2007).
Cedar, H. & Bergman, Y. Linking DNA methylation and histone modification: patterns and paradigms. Nature reviews. Genetics 10, 295–304 (2009).
Hirasawa, R. & Feil, R. Genomic imprinting and human disease. Essays in biochemistry 48, 187–200 (2010).
Wu, X. & Zhang, Y. TET-mediated active DNA demethylation: mechanism, function and beyond. Nature Reviews Genetics 18, 517–534 (2017).
Bhutani, N., Burns, D. M. & Blau, H. M. DNA demethylation dynamics. Cell 146, 866–872 (2011).
Yun, Y. et al. H1foo is essential for in vitro meiotic maturation of bovine oocytes. Zygote (Cambridge, England) 1–10, https://doi.org/10.1017/S0967199414000021 (2014).
Furuya, M. et al. H1foo is indispensable for meiotic maturation of the mouse oocyte. The Journal of reproduction and development 53, 895–902 (2007).
McGraw, S., Vigneault, C., Tremblay, K. & Sirard, M.-A. Characterization of linker histone H1FOO during bovine in vitro embryo development. Molecular reproduction and development 73, 692–9 (2006).
Teranishi, T. et al. Rapid replacement of somatic linker histones with the oocyte-specific linker histone H1foo in nuclear transfer. Developmental Biology 266, 76–86 (2004).
Hayakawa, K., Ohgane, J., Tanaka, S., Yagi, S. & Shiota, K. Oocyte-specific linker histone H1foo is an epigenomic modulator that decondenses chromatin and impairs pluripotency. Epigenetics: official journal of the DNA Methylation Society 7, 1029–36 (2012).
Wood, C. et al. Post-translational modifications of the linker histone variants and their association with cell mechanisms. FEBS Journal 276, 4109–4121 (2009).
Tessarz, P. & Kouzarides, T. Histone core modifications regulating nucleosome structure and dynamics. Nature reviews. Molecular cell biology 15, 703–708 (2014).
Rangasamy, D., Berven, L., Ridgway, P. & Tremethick, D. J. Pericentric heterochromatin becomes enriched with H2A.Z during early mammalian development. The EMBO journal 22, 1599–607 (2003).
Fan, J. Y., Gordon, F., Luger, K., Hansen, J. C. & Tremethick, D. J. The essential histone variant H2A.Z regulates the equilibrium between different chromatin conformational states. Nature structural biology 9, 172–6 (2002).
Greaves, I. K., Rangasamy, D., Ridgway, P. & Tremethick, D. J. H2A.Z contributes to the unique 3D structure of the centromere. Proceedings of the National Academy of Sciences of the United States of America 104, 525–530 (2007).
Ziegler-Birling, C., Helmrich, A., Tora, L. & Torres-Padilla, M. E. Distribution of p53 binding protein 1 (53BP1) and phosphorylated H2A.X during mouse preimplantation development in the absence of DNA damage. International Journal of Developmental Biology 53, 1003–1011 (2009).
Dimitrov, S., Dasso, M. C. & Wolffe, A. P. Remodeling sperm chromatin in Xenopus laevis egg extracts: the role of core histone phosphorylation and linker histone B4 in chromatin assembly. The Journal of cell biology 126, 591–601 (1994).
Chang, C.-C. et al. A maternal store of macroH2A is removed from pronuclei prior to onset of somatic macroH2A expression in preimplantation embryos. Developmental biology 278, 367–80 (2005).
Pasque, V., Gillich, A., Garrett, N. & Gurdon, J. B. Histone variant macroH2A confers resistance to nuclear reprogramming. The EMBO journal 30, 2373–2387 (2011).
Chadwick, B. P., Valley, C. M. & Willard, H. F. Histone variant macroH2A contains two distinct macrochromatin domains capable of directing macroH2A to the inactive X chromosome. Nucleic Acids Research 29, 2699–2705 (2001).
Mito, Y., Henikoff, J. G. & Henikoff, S. Genome-scale profiling of histone H3.3 replacement patterns. Nature genetics 37, 1090–1097 (2005).
Bloom, K. Centromere dynamics. Current opinion in genetics & development 17, 151–6 (2007).
Stellfox, M. E., Bailey, A. O. & Foltz, D. R. Putting CENP-A in its place. Cellular and Molecular Life Sciences 70, 387–406 (2013).
Peñagaricano, F., Wang, X., Rosa, G. J., Radunz, A. E. & Khatib, H. Maternal nutrition induces gene expression changes in fetal muscle and adipose tissues in sheep. BMC genomics 15, 1034 (2014).
Greer, E. L. & Shi, Y. Histone methylation: a dynamic mark in health, disease and inheritance. Nature reviews. Genetics 13, 343–57 (2012).
Huang, X.-J. et al. EZH2 is essential for development of mouse preimplantation embryos. Reproduction, Fertility and Development 26, 1166 (2014).
Pagé-Larivière, F. & Sirard, M.-A. Spatiotemporal Expression of DNA Demethylation Enzymes and Histone Demethylases in Bovine Embryos. Cellular Reprogramming 16, 40–53 (2014).
Tee, W. W. et al. Prmt5 is essential for early mouse development and acts in the cytoplasm to maintain ES cell pluripotency. Genes and Development 24, 2772–2777 (2010).
Hiriart, M. I., Bevacqua, R. J., Canel, N. G., Fernández-Martín, R. & Salamone, D. F. Production of chimeric embryos by aggregation of bovine egfp eight-cell stage blastomeres with two-cell fused and asynchronic embryos. Theriogenology 80, 357–364 (2013).
Messerschmidt, D. M., Knowles, B. B. & Solter, D. DNA methylation dynamics during epigenetic reprogramming in the germline and preimplantation embryos. Genes and Development 28, 812–828 (2014).
Wrenzycki, C. & Niemann, H. Epigenetic reprogramming in early embryonic development: effects of in-vitro production and somatic nuclear transfer. Reproductive biomedicine online 7, 649–56 (2003).
Beaujean, N. et al. The effect of interspecific oocytes on demethylation of sperm DNA. Proceedings of the National Academy of Sciences of the United States of America 101, 7636–7640 (2004).
Jeong, Y. S., Yeo, S., Park, J. S., Lee, K.-K. & Kang, Y.-K. Gradual development of a genome-wide H3-K9 trimethylation pattern in paternally derived pig pronucleus. Developmental dynamics: an official publication of the American Association of Anatomists 236, 1509–16 (2007).
Yang, X. et al. Nuclear reprogramming of cloned embryos and its implications for therapeutic cloning. Nature Genetics 39, 295–302 (2007).
Bakhtari, A. & Ross, P. J. DPPA3 prevents cytosine hydroxymethylation of the maternal pronucleus and is required for normal development in bovine embryos. Epigenetics 9, 1271–1279 (2014).
Kohli, R. M. & Zhang, Y. TET enzymes, TDG and the dynamics of DNA demethylation. Nature 502, 472–479 (2013).
Griffith, M. et al. Alternative expression analysis by RNA sequencing. Nature Methods 7, 843–847 (2010).
Shi, Y. & He, M. Differential gene expression identified by RNA-Seq and qPCR in two sizes of pearl oyster (Pinctada fucata). Gene 538, 313–322 (2014).
Wu, A. R. et al. Quantitative assessment of single-cell RNA-sequencing methods. Nature Methods 11, 41–46 (2014).
Scarlet, D., Ertl, R., Aurich, C. & Steinborn, R. The Orthology Clause in the Next Generation Sequencing Era: Novel Reference Genes Identified by RNA-seq in Humans Improve Normalization of Neonatal Equine Ovary RT-qPCR Data. Plos One 10, e0142122 (2015).
Coate, J. E. & Doyle, J. J. Variation in transcriptome size: are we getting the message? Chromosoma 124, 27–43 (2015).
Acknowledgements
This project was supported by grants from the USDA (1265-31000-091-02S and W2171/3171). The author would like to thank Ms. Elizabeth Johnson for English editing.
Author information
Authors and Affiliations
Contributions
J.D.: assembly of data collection and/or assembly of data, data analysis and interpretation, manuscript preparation and revision. L.Z.: conception and design, collection and/or assembly of data, data analysis and interpretation, manuscript writing. Z.J.: collection and/or assembly of data. X.C.T.: conception and design, data interpretation, financial and administrative support, and manuscript preparation. H.D., X.Z. and J.C.: sample collection.
Corresponding authors
Ethics declarations
Competing Interests
The authors declare no competing interests.
Additional information
Publisher’s note: Springer Nature remains neutral with regard to jurisdictional claims in published maps and institutional affiliations.
Supplementary information
Rights and permissions
Open Access This article is licensed under a Creative Commons Attribution 4.0 International License, which permits use, sharing, adaptation, distribution and reproduction in any medium or format, as long as you give appropriate credit to the original author(s) and the source, provide a link to the Creative Commons license, and indicate if changes were made. The images or other third party material in this article are included in the article’s Creative Commons license, unless indicated otherwise in a credit line to the material. If material is not included in the article’s Creative Commons license and your intended use is not permitted by statutory regulation or exceeds the permitted use, you will need to obtain permission directly from the copyright holder. To view a copy of this license, visit http://creativecommons.org/licenses/by/4.0/.
About this article

Cite this article
Duan, J., Zhu, L., Dong, H. et al. Analysis of mRNA abundance for histone variants, histone- and DNA-modifiers in bovine in vivo and in vitro oocytes and embryos. Sci Rep 9, 1217 (2019). https://doi.org/10.1038/s41598-018-38083-4
Received:
Accepted:
Published:
DOI: https://doi.org/10.1038/s41598-018-38083-4
This article is cited by
Comments
By submitting a comment you agree to abide by our Terms and Community Guidelines. If you find something abusive or that does not comply with our terms or guidelines please flag it as inappropriate.
