
Abstract
Diffusion MRI (dMRI) is a safe and noninvasive technique that provides insight into the microarchitecture of brain tissue. Relaxation-diffusion MRI (rdMRI) is an extension of traditional dMRI that captures diffusion imaging data at multiple TEs to detect tissue heterogeneity between relaxation and diffusivity. rdMRI has great potential in neurosurgical research including brain tumor grading and treatment response evaluation. However, the lack of available data has limited the exploration of rdMRI in clinical settings. To address this, we are sharing a high-quality rdMRI dataset from 18 neurosurgical patients with different types of lesions, as well as two healthy individuals as controls. The rdMRI data was acquired using 7 TEs, where at each TE multi-shell dMRI with high spatial and angular resolutions is obtained at each TE. Each rdMRI scan underwent thorough artifact and distortion corrections using a specially designed processing pipeline. The dataset’s quality was assessed using standard practices, including quality control and assurance. This resource is a valuable addition to neurosurgical studies, and all data are openly accessible.
Background & Summary
Diffusion magnetic resonance imaging (dMRI) is a noninvasive imaging technique that can probe the diffusion of water molecules in biological tissues to characterize the underlying microstructure1,2. There have been many methods proposed for extracting tissue microstructure and measuring from the dMRI signals using either signal representation or tissue modeling approaches2,3,4,5,6. Most of the existing methods use standard dMRI data that is acquired with a single echo time (TE) and thus provide information primarily on diffusivity. Recently, studies have shown that integrating dMRI with multiple TEs can better characterize tissue microstructure than dMRI with a single TE7,8,9,10,11.
Relaxation-diffusion MRI (rdMRI) is an advanced technique that combines measurements of tissue relaxation times (T1 and T2) and diffusion imaging to investigate the microstructural and physiological characteristics of tissues12,13,14,15. In rdMRI, transverse relaxation refers to the time that it takes for the transverse magnetization of a tissue to decay after an excitation pulse. Combining with diffusion imaging, transverse relaxation time is a crucial imaging parameter to study tumor characteristics, including tumor grading, edema assessment, necrotic areas, and treatment response assessment16,17,18,19. Table 1 gives a summary of potential neurosurgical applications that can benefit from using rdMRI.
The development of relaxation-diffusion imaging with multi-echo is still evolving, challenged by the lack of effective acquisition protocols and robust data processing and analysis methods. These efforts promise to improve its clinical applicability and enhance our understanding of glioma biology and treatment response. rdMRI7,8,9,10,11 acquired diffusion signals at different TEs following diffusion sensitizing gradients, which have some challenges. First, acquiring multiple echoes requires additional scan time, which can limit its application in specific clinical settings or when fast imaging is necessary. Second, rdMRI data with multi-echo requires more complex processing and analysis techniques than single-echo dMRI. Separating signal contributions from different compartments and estimating microstructure parameters involve advanced modeling and fitting algorithms. Third, rdMRI can be more sensitive to susceptibility-induced artifacts due to the longer echo time. This can lead to distortions and signal loss, particularly in regions prone to susceptibility effects, such as the frontal lobes or areas near air-tissue interfaces. Currently, no open rdMRI datasets are available for broad scientific and clinical investigations.
Given the above, we disseminate a dataset of rdMRI scans acquired at 3 T. We make available a high-quality rdMRI dataset from a cohort of 18 neurosurgical patients with different types of lesions, plus two healthy individuals as controls. We comprehensively describe the dataset’s design, acquisition, and preparation. The rdMRI data is acquired on a 3 T Philips MRI scanner with 7 TEs. At each TE, multi-shell diffusion-weighted images with high spatial and angular resolutions are acquired. Each rdMRI scan is well processed for artifact and distortion corrections using a newly designed rdMRI-specific processing pipeline. Image quality is assessed using quality metrics implemented in multiple popular tools. Using this new resource, we also provide codes, preliminary results, and perspectives for future projects. Constituting an essential new resource for neurosurgical studies, all data are openly available. We expect this dataset to serve as a valuable resource for refining acquisition techniques, optimizing acquisition parameters, and establishing standardized approaches for rdMRI in studying gliomas.
Methods
Participants
The MRI data was collected from 18 patients (including glioma, meningioma, diffuse large B-cell, multiple sclerosis, cortical cerebral infarction, and brain abscess) and two healthy individuals (11 females and 9 males; age range: 28.0–70.0 years; median age: 51.0 years; IQR: 21.5 years). All participants provided written informed consent before participation and signed informed consent regarding publishing their data. The Research Ethics Committee, Faculty of Medicine in Union Hospital, Tongji Medical College, Huazhong University of Science and Technology, China, approved the study protocols (approve number: 2021-IEC-0984).
Image acquisitions
All MRI scans were acquired using a Philips 3 T MRI (Ingenia CX, Netherlands) scanner with a gradient strength of 80 mT/m and switching rates of 200 mT/m/msec, equipped with 32-channel head coils.
The rdMRI data is scanned using a multi-shell, multi-echo dMRI sequence (Fig. 1) with a fixed repetition time (TR) = 4000 ms, {4, 8, 8, 16} noncollinear diffusion-encoding directions at each of four b = {400, 800, 1600, 3200}s/mm2 respectively, Δ = {35.9, 40.9, 45.9, 50.9, 55.9, 60.9, 65.9}ms, δ = {19.9, 24.9, 29.9, 34.9, 39.9, 44.9, 49.9}ms, echo times: TE = {75, 85, 95, 105, 115, 125, 135}ms, 1.5 mm isotropic voxel size. Together with four acquisitions without diffusion weighting (b = 0 s/mm2); the number of averages = 1; field of view = 160 mm × 160 mm; matrix = 130 × 130; flip angle = 90; 96 axial slices with gap = 0; multi-band factor = 4. These diffusion data were obtained using a spin-echo echo-planar imaging sequence.

Multi-shell, multi-echo dMRI acquisition, and the example rdMRI data from a high-grade glioma patient.
In addition, T1-weighted three-dimensional (3D) turbo field-echo (TFE) parameters include 250 sagittal 1 mm slices; 1 mm isotropic; 250 × 250 matrix; repetition time/echo time (TR/TE) = 8.568/4.154 ms; flip angle = 8. T2-FLAIR was also acquired with the parameters including 250 sagittal 1 mm slices; 1 mm isotropic; 250 × 250 matrix; repetition time/echo time (TR/TE) = 4800/306.987 ms; flip angle = 90.
Image processing
The acquired MRI scans were converted from DICOM to Neuroinformatics Informatics Technology Initiative (NIfTI) format using dcm2niix in MRIcroGL (v1.2) (https://www.nitrc.org/plugins/mwiki/index.php/mricrogl) and then organized following the Brain Imaging Data Structure (BIDS) format20. Facial information was removed from all the MRI scans using PyDeface (v2.0.2) (https://github.com/poldracklab/pydeface). MRI image was reoriented using ‘fslreorient2std’ in the Functional Magnetic Resonance Imaging of the Brain (FMRIB) Software Library tool (FSL v6.0.3)21 to match the approximate orientation of the standard template images, and the axis-aligned and centered using pnlNipype22 to ensure non-diagonal alignment in the affine transform.
The preprocessing pipeline for diffusion-weighted images (DWI) was performed separately for each TE session, as shown in Fig. 2. This involved denoising using MRtrix323, correcting for eddy current-induced distortion, motion, and bias field using FSL21.

Preprocessing pipeline consists of individual and population correction for MRI data.
To make sure the gradient table is in the correct order, we used the following two strategies, as reported by Cai et al.24 and Snoek et al.25. Firstly, we exported the actual gradient table from the DICOM using the latest version of dcm2niix, instead of using the predefined gradient table. This ensured that the corrected ordering corresponded with the DWI volume and that all gradients had been reoriented into subject space without any reordering of image volumes. Secondly, we used ‘dwigradcheck’ in MRtrix3 to correct any possible issues with the diffusion gradient table further.
Next, for each subject, to align the DWIs across multiple TE sessions (Fig. 2), a joint eddy current-induced distortion correction and motion correction were performed in concatenated DWIs over all of the TE sessions. To further correct for distortions caused by magnetic field inhomogeneity, an EPI distortion correction was conducted regarding the T1-weighted image using Advanced Normalization Tools (ANTs v2.5.0)26. To this end, we first generated a T2-weighted-like contrast image from a T1-weighted image using in-house software. For each participant, a nonlinear registration (restricted to the phase-encode direction) was computed from the b0 image to the synthetic T2-weighted image to make an EPI corrective warp. Then, the warp was applied to each DWI, followed by reorientation of the corresponding gradient directions. Each individual’s T1-weighted image was also transformed from structural space into diffusion space via rigid registration using FSL21. Finally, processed DWIs were split into the corresponding TE session.
The preprocessing pipeline for T1-weighted and FLAIR images consisting of Gibbs ringing artifact removal and bias field correction was performed using ANTs26. Brain masks were created using a Convolutional Neural Network (CNN) based segmentation tool in pnlNipype22.
Data Records
Our neuroimaging dataset is now available in two formats: raw and preprocessed MRI data, both of which are available for all release subjects. Demographic information can be found in the root folder, while the acquisition protocol in JSON format is available in the corresponding scan folder. All data can be accessed on OpenNeuro27. For each subject, unprocessed and processed images for structural and dMRI are provided, along with annotation maps and derivative results (Fig. 4). Demographic information (Table 2) was included for each participant in the data file (“participants.tsv”) as per the BIDS standard. The image quality reports are in the BIDS directory, where the information was name-matched with each scan’s name.
Technical Validation
To prompt the quality of our data, we assessed the quality of images using below common approaches:
-
To assess the quality of each dMRI file, we utilized a measure of data quality known as the neighboring DWI Correlation (NDC), which can be found in the DSI Studio software (v2023.07.08) (https://dsi-studio.labsolver.org). We employed a comprehensive quality control (QC) procedure to meticulously examine each file, ensuring that image dimensions, resolution, DWI count, and NDC remained consistent across the board. The NDC measure summarizes the pairwise spatial correlation between each pair of dMRI volumes that sample the closest points in q-space. It computes a voxel-wise correlation coefficient between every two DWIs of the closest b-vector (multiplied by b-value). Then, it calculates the average of those coefficients across all voxels. Lower NDC values indicate reduced data quality due to noise and misalignment between dMRI volumes. Automatically computed quality measures for the entire image series, including the neighboring DWI Correlation, number of bad slices, and head motion summary statistics, are provided in the ‘derivatives/dwiqc/<subject>/<session>/dwi/<subject>_<session>_dwi.qc.txt file’. In our data, none of the dMRI voxels were identified as outliers (i.e., with a value greater than three times the mean), as the lowest NDC values were significantly higher than the suggested threshold of 0.6 (as shown in Fig. 3a).
Fig. 3 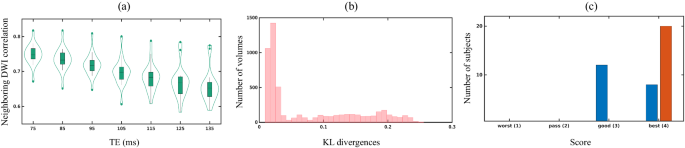
Plots for image quality metrics: (a) Neighboring DWI correlation (NDC), (b) KL divergences of rdMRI, and (c) quality score of structural images.
-
We further used 3D Slicer module SlicerDiffusionQC (https://github.com/pnlbwh/SlicerDiffusionQC) for quality checking of diffusion-weighted MRI. It identifies bad gradients by comparing the distance of each gradient to a median line. The median line is obtained from Kullback–Leibler (KL) divergences between consecutive slices. Here, lower KL divergence values represent good data quality and vice-versa. In our data, none of the DWIs were identified with bad gradients (Fig. 3b).
-
Each T1w/FLAIR image underwent thorough examination using the Structural MRI quality checking tool (https://github.com/pnlbwh/structuralQC) to ensure the quality and integrity of data. This QC algorithm first masks an input image with a foreground mask. Then, it slides a small cube throughout the volume, representing each cell with intensity histograms. After the histogram representation of the image, it is compared against a library of good and bad images and predicted as “pass” or “fail”. Figure 3c indicates none of the T1w/FLAIR images were identified as insufficient data.
-
The rdMRI can be used to detect microscopic tissue features noninvasively, and relaxation time is linked to tissue biochemical composition. To obtain multi-dimensional imaging measures, mathematical modeling is combined with rdMRI data, allowing the measurement and mapping of microscopic tissue features. In a recent study8,9, joint moments of relaxation and diffusion were used to derive imaging measures. It was found that the estimated relaxation rate from in-vivo clinical data was reliable, as shown in Fig. 4. This supports the practical use of rdMRI in clinical settings.
Fig. 4 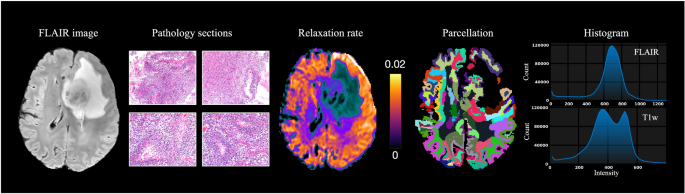
FLAIR imaging, pathology sections, and derivatives results include relaxation rate estimated by9, cortical parcellation generated by Freesurfer, and intensity distribution.


Usage Notes
Our dedicated website will be regularly updated with additional data and analyses (https://github.com/dryewu/RDSI). We have created a forum topic where you can ask questions and get answers. This dataset is a valuable resource for neuroscientists who want to investigate behavioral models or anatomical systems that are not otherwise available, as well as for neuroimagers who wish to test their algorithms in combination with other resources available to researchers (for example, ex-vivo MAP dataset (https://www.drcmr.dk/map-datasets)). It will enable sharper phylogenetic investigations.
Relaxation-diffusion MRI is a technique that enables the characterization of intricate tissue microstructures and provides more detailed information about tissue properties than traditional diffusion MRI methods. This makes it particularly useful for studying evolutionary mechanisms and phylogenetics, as discussed in the following aspects.
Refinement of Evolutionary Mechanisms Modeling: Relaxation-diffusion MRI is a technique that provides highly detailed images of tissue microstructure, which can offer valuable insights into subtle changes that occur in tissue structure over long periods. By using this technique to examine changes in different species and relate them to known evolutionary histories, researchers can refine models of evolutionary mechanisms and gain a better understanding of the processes that drive evolution. Some studies have shown that transverse relaxation rate signals increase within higher-order association bundles during childhood and adolescence, suggesting an increase in myelination28,29,30,31,32.
Identifying Future Therapeutic Targets: Relaxation-diffusion MRI can detect changes in tissue microstructure that may indicate disease states or potential risks for certain diseases. By identifying areas of abnormality or potential risk, relaxation-diffusion dMRI can help to pinpoint possible therapeutic targets. For example, in neurodegenerative diseases like Alzheimer’s or Parkinson’s, relaxation-diffusion MRI can highlight areas of altered tissue microstructure in the brain that could potentially be targeted for treatment. A study by Ian F Harrison et al.33 suggests that MR relaxometry studies targeted to the standard and enlarged perivascular space may help detect dysfunction of perivascular fluid movement associated with aging and pathological conditions. Lewis et al.34 have explored the microvascular biomarkers using relaxation rate and found that inflammation is a crucial contributor to the tumor microenvironment and could be viewed as a therapeutic target in both vestibular schwannoma groups.
Code availability
Qualified researchers can access data from the current study (see the Participants section above for details). Scripts, supporting documents, and other information necessary to implement all aspects of data organization, preparation, and analysis using open-source software packages. Except for special instructions in the paper, all tools always use default parameters. No custom code was instructed.
References
Basser, P., Mattiello, J. & LeBihan, D. MR diffusion tensor spectroscopy and imaging. Biophysical Journal 66, 259–267, https://doi.org/10.1016/S0006-3495(94)80775-1 (1994).
Le Bihan, D. Looking into the functional architecture of the brain with diffusion MRI. Nature Reviews Neuroscience 4, 469–480 (2003).
Jones, D. K. Diffusion MRI (Oxford University Press, 2010).
Sotiropoulos, S. N. & Zalesky, A. Building connectomes using diffusion MRI: why, how and but. NMR in Biomedicine 32, e3752, https://doi.org/10.1002/nbm.3752 (2019).
Hagmann, P. From diffusion MRI to brain connectomics. Tech. Rep., EPFL (2005).
Topgaard, D. Multidimensional diffusion MRI. Journal of Magnetic Resonance 275, 98–113, https://doi.org/10.1016/j.jmr.2016.12.007 (2017).
Eichner, C. et al. Increased sensitivity and signal-to-noise ratio in diffusion-weighted MRI using multi-echo acquisitions. NeuroImage 221, 117172, https://doi.org/10.1016/j.neuroimage.2020.117172 (2020).
Ning, L., Westin, C.-F. & Rathi, Y. Characterization of b-value dependent T2 relaxation rates for probing neurite microstructure. bioRxiv (2022).
Ning, L., Gagoski, B., Szczepankiewicz, F., Westin, C.-F. & Rathi, Y. Joint RElaxation-Diffusion Imaging Moments to Probe Neurite Microstructure. IEEE Transactions on Medical Imaging 39, 668–677, https://doi.org/10.1109/TMI.2019.2933982 (2020).
Gong, T. et al. MTE-NODDI: Multi-TE NODDI for disentangling non-T2-weighted signal fractions from compartment-specific T2 relaxation times. NeuroImage 217, 116906, https://doi.org/10.1016/j.neuroimage.2020.116906 (2020).
Veraart, J., Novikov, D. S. & Fieremans, E. TE dependent Diffusion Imaging (TEdDI) distinguishes between compartmental T2 relaxation times. NeuroImage 182, 360–369, https://doi.org/10.1016/j.neuroimage.2017.09.030 (2018).
Weisskoff, R., Zuo, C. S., Boxerman, J. L. & Rosen, B. R. Microscopic susceptibility variation and transverse relaxation: theory and experiment. Magnetic Resonance in Medicine 31, 601–610 (1994).
Kleinberg, R. L. & Horsfield, M. A. Transverse relaxation processes in porous sedimentary rock. Journal of Magnetic Resonance (1969) 88, 9–19 (1990).
Cowan, B. & Cowan, B. P. Nuclear magnetic resonance and relaxation, vol. 427 (Cambridge University Press Cambridge, 1997).
Thulborn, K. R., Waterton, J. C., Matthews, P. M. & Radda, G. K. Oxygenation dependence of the transverse relaxation time of water protons in whole blood at high field. Biochimica et Biophysica Acta (BBA)-General Subjects 714, 265–270 (1982).
Upadhyay, N. & Waldman, A. Conventional MRI evaluation of gliomas. The British Journal of Radiology 84, S107–S111 (2011).
Tavakoli, M. B., Khorasani, A. & Jalilian, M. Improvement grading brain glioma using T2 relaxation times and susceptibility-weighted images in MRI. Informatics in Medicine Unlocked 37, 101201, https://doi.org/10.1016/j.imu.2023.101201 (2023).
Li, Y. et al. Comparison of T1 and T2 metabolite relaxation times in glioma and normal brain at 3 T. Journal of Magnetic Resonance Imaging 28, 342–350, https://doi.org/10.1002/jmri.21453 (2008).
Hu, L. S., Hawkins-Daarud, A., Wang, L., Li, J. & Swanson, K. R. Imaging of intratumoral heterogeneity in high-grade glioma. Cancer letters 477, 97–106 (2020).
Gorgolewski, K. J. et al. The brain imaging data structure, a format for organizing and describing outputs of neuroimaging experiments. Scientific Data 3, 160044, https://doi.org/10.1038/sdata.2016.44 (2016).
Jenkinson, M., Beckmann, C. F., Behrens, T. E. & Woolrich, M. W. & Smith, S. M. Fsl. Neuroimage 62, 782–790 (2012).
Billah, T., Bouix, S. & Rathi, Y. NIFTI MRI processing pipeline. Accessed September 10, 2020, https://github.com/pnlbwh/pnlNipype (2019).
Tournier, J.-D. et al. MRtrix3: A fast, flexible and open software framework for medical image processing and visualisation. NeuroImage 202, 116137, https://doi.org/10.1016/j.neuroimage.2019.116137 (2019).
Cai, L. Y. et al. PreQual: An automated pipeline for integrated preprocessing and quality assurance of diffusion weighted MRI images. Magnetic Resonance in Medicine 86, 456–470, https://doi.org/10.1002/mrm.28678 (2021).
Snoek, L. et al. The Amsterdam Open MRI Collection, a set of multimodal MRI datasets for individual difference analyses. Scientific Data 8, 85 (2021).
Avants, B. B., Tustison, N. & Song, G. Advanced normalization tools (ANTS). Insight J 2, 1–35 (2009).
Wu, Y., Liu, X., Huang, Y., Zhou, T. & Zhang, F. An open relaxation-diffusion MRI dataset in neurosurgical studies, OpenNeuro, https://doi.org/10.18112/openneuro.ds004910.v1.0.0 (2024).
Bartzokis, G. et al. Multimodal magnetic resonance imaging assessment of white matter aging trajectories over the lifespan of healthy individuals. Biological Psychiatry 72, 1026–1034 (2012).
Slater, D. A. et al. Evolution of white matter tract microstructure across the life span. Human Brain Mapping 40, 2252–2268, https://doi.org/10.1002/hbm.24522 (2019).
Vanes, L. D. et al. White matter tract myelin maturation and its association with general psychopathology in adolescence and early adulthood. Human Brain Mapping 41, 827–839, https://doi.org/10.1002/hbm.24842 (2020).
Yeatman, J. D., Wandell, B. A. & Mezer, A. A. Lifespan maturation and degeneration of human brain white matter. Nature Communications 5, 4932 (2014).
Moura, L. M. et al. Age-effects in white matter using associated diffusion tensor imaging and magnetization transfer ratio during late childhood and early adolescence. Magnetic Resonance Imaging 34, 529–534 (2016).
Harrison, I. F. et al. Non-invasive imaging of CSF-mediated brain clearance pathways via assessment of perivascular fluid movement with diffusion tensor MRI. eLife 7, e34028 (2018).
Lewis, D. et al. The microenvironment in sporadic and neurofibromatosis type II–related vestibular schwannoma: the same tumor or different? A comparative imaging and neuropathology study. Journal of Neurosurgery 134, 1419–1429 (2020).
Server, A. et al. Analysis of diffusion tensor imaging metrics for gliomas grading at 3 T. European Journal of Radiology 83, e156–e165, https://doi.org/10.1016/j.ejrad.2013.12.023 (2014).
Yamasaki, F. et al. Apparent Diffusion Coefficient of Human Brain Tumors at MR Imaging. Radiology 235, 985–991, https://doi.org/10.1148/radiol.2353031338 (2005).
Zhang, H. et al. Differentiation of low-and high-grade pediatric gliomas with amide proton transfer imaging: added value beyond quantitative relaxation times. European. Radiology 31, 9110–9119 (2021).
Zhang, H. et al. Histological and molecular classifications of pediatric glioma with time-dependent diffusion MRI-based microstructural mapping. Neuro-Oncology noad003, https://doi.org/10.1093/neuonc/noad003 (2023).
Hirschler, L. et al. Advanced MR techniques for preoperative glioma characterization: Part 1. Journal of Magnetic Resonance Imaging 57, 1655–1675 (2023).
Maekawa, T. et al. Differentiation of high-grade and low-grade intra-axial brain tumors by time-dependent diffusion MRI. Magnetic Resonance Imaging 72, 34–41, https://doi.org/10.1016/j.mri.2020.06.018 (2020).
Obenaus, A. & Badaut, J. Role of the non-invasive imaging techniques in monitoring and understanding the evolution of brain edema. Journal of Neuroscience Research 100, 1191–1200, https://doi.org/10.1002/jnr.24837 (2022).
Sevick, R. J. et al. Cytotoxic brain edema: assessment with diffusion-weighted MR imaging. Radiology 185, 687–690, https://doi.org/10.1148/radiology.185.3.1438745 (1992).
Bauer, M. Quantitative Analysis of Brain Edema Using Post Mortem Imaging. PhD Thesis, University of Basel (2022).
Maier, S. E. et al. Normal brain and brain tumor: multicomponent apparent diffusion coefficient line scan imaging. Radiology 219, 842–849 (2001).
Chang, S.-C. et al. Diffusion-weighted MRI features of brain abscess and cystic or necrotic brain tumors. Clinical Imaging 26, 227–236, https://doi.org/10.1016/S0899-7071(02)00436-9 (2002).
Park, S. H. et al. Diffusion-weighted MRI in cystic or necrotic intracranial lesions. Neuroradiology 42, 716–721, https://doi.org/10.1007/s002340000394 (2000).
Schepkin, V. D. Sodium MRI of glioma in animal models at ultrahigh magnetic fields. NMR in Biomedicine 29, 175–186 (2016).
Jelescu, I. O. & Fieremans, E. Sensitivity and specificity of diffusion MRI to neuroinflammatory processes. In Advances in Magnetic Resonance Technology and Applications, vol. 9, 31–50 (Elsevier, 2023).
Hamstra, D. A., Rehemtulla, A. & Ross, B. D. Diffusion Magnetic Resonance Imaging: A Biomarker for Treatment Response in Oncology. Journal of Clinical Oncology 25, 4104–4109, https://doi.org/10.1200/JCO.2007.11.9610 (2007).
Provenzale, J. M., Mukundan, S. & Barboriak, D. P. Diffusion-weighted and Perfusion MR Imaging for Brain Tumor Characterization and Assessment of Treatment Response. Radiology 239, 632–649, https://doi.org/10.1148/radiol.2393042031 (2006).
Thoeny, H. C. & Ross, B. D. Predicting and monitoring cancer treatment response with diffusion-weighted MRI. Journal of Magnetic Resonance Imaging 32, 2–16, https://doi.org/10.1002/jmri.22167 (2010).
Chenevert, T. L. & Ross, B. D. Diffusion Imaging for Therapy Response Assessment of Brain Tumor. Neuroimaging Clinics of North America 19, 559–571, https://doi.org/10.1016/j.nic.2009.08.009 (2009).
Wang, Y. et al. Quantitative MRI: Defining repeatability, reproducibility and accuracy for prostate cancer imaging biomarker development. Magnetic Resonance Imaging 77, 169–179 (2021).
Booth, T. C. et al. High-grade glioma treatment response monitoring biomarkers: a position statement on the evidence supporting the use of advanced MRI techniques in the clinic, and the latest bench-to-bedside developments. Part 2: spectroscopy, chemical exchange saturation, multiparametric imaging, and radiomics. Frontiers in Oncology 11, 811425 (2022).
Hattingen, E. et al. Quantitative T2 mapping of recurrent glioblastoma under bevacizumab improves monitoring for non-enhancing tumor progression and predicts overall survival. Neuro-Oncology 15, 1395–1404 (2013).
Acknowledgements
This work was supported by the National Key R&D Program of China (Nos. 2023YFE0118600 and 2023YFF1204800). This work was supported by the National Natural Science Foundation of China (Nos. 62201265, 62371107, 62101365, 62172228) and the Natural Science Foundation of Hubei Province of China (No. 2021CFB442). We also thank Dr. Peng Sun and Jiazheng Wang from Philips Healthcare for help in MR image series acquisition.
Author information
Authors and Affiliations
Contributions
Conception and design: Y.W. and X.L.; Analysis and interpretation: Y.W., X.L. and F.Z.; Writing the article: Y.W., Y.H., T.Z. and F.Z. All authors reviewed the manuscript.
Corresponding author
Ethics declarations
Competing interests
The authors declare no competing interests.
Additional information
Publisher’s note Springer Nature remains neutral with regard to jurisdictional claims in published maps and institutional affiliations.
Rights and permissions
Open Access This article is licensed under a Creative Commons Attribution 4.0 International License, which permits use, sharing, adaptation, distribution and reproduction in any medium or format, as long as you give appropriate credit to the original author(s) and the source, provide a link to the Creative Commons licence, and indicate if changes were made. The images or other third party material in this article are included in the article’s Creative Commons licence, unless indicated otherwise in a credit line to the material. If material is not included in the article’s Creative Commons licence and your intended use is not permitted by statutory regulation or exceeds the permitted use, you will need to obtain permission directly from the copyright holder. To view a copy of this licence, visit http://creativecommons.org/licenses/by/4.0/.
About this article

Cite this article
Wu, Y., Liu, X., Huang, Y. et al. An open relaxation-diffusion MRI dataset in neurosurgical studies. Sci Data 11, 177 (2024). https://doi.org/10.1038/s41597-024-03013-9
Received:
Accepted:
Published:
DOI: https://doi.org/10.1038/s41597-024-03013-9
