
Abstract
Suncus etruscus is one of the world’s smallest mammals, with an average body mass of about 2 grams. The Etruscan shrew’s small body is accompanied by a very high energy demand and numerous metabolic adaptations. Here we report a chromosome-level genome assembly using PacBio long read sequencing, 10X Genomics linked short reads, optical mapping, and Hi-C linked reads. The assembly is partially phased, with the 2.472 Gbp primary pseudohaplotype and 1.515 Gbp alternate. We manually curated the primary assembly and identified 22 chromosomes, including X and Y sex chromosomes. The NCBI genome annotation pipeline identified 39,091 genes, 19,819 of them protein-coding. We also identified segmental duplications, inferred GO term annotations, and computed orthologs of human and mouse genes. This reference-quality genome will be an important resource for research on mammalian development, metabolism, and body size control.
Background & Summary
The Etruscan shrew (Suncus etruscus), also known as the white-toothed pygmy shrew, is recognized as one of the smallest mammals living today. With a body weight ranging from 1.2 to 2.7 grams and dimensions spanning 36 to 53 mm in length1, this organism exhibits a remarkably large body surface area to volume ratio. As a result, the shrew has an exceptionally high basal metabolic rate, which requires a daily food consumption approximating 1.5 to 2.0 times its body mass1. Due to these unique physiological characteristics, the Etruscan shrew has become a valuable species to the scientific community, significantly contributing to various fields of research, such as behavioral science and neuroscience1,2,3,4. A high-quality genome assembly is an essential reference to enable accurate high throughput data analysis. It will provide valuable insights into the mechanisms of body size control and metabolic rate, as well as facilitate comparative biological investigations.
Our new Suncus etruscus genome is the first chromosome-level genome assembly of the order Eulipotyphla. S. etruscus is a member of the family Soricidae (the shrews), which have classically been divided into subfamilies Crocidurinae (the white-toothed shrews) and Soricinae (the red-toothed shrews). An alternative partitioning scheme distinguishes three subfamilies of the Soricidae, namely Crocidurinae (the white-toothed shrews), Soricinae (the red-toothed shrews) and Myosoricinae (African shrews)5. S. etruscus is a member of the Crocidurinae, which total about 220 species, representing a substantial portion of mammalian diversity. At the time of writing, there were several other sequenced shrew genomes: Crocidura indochinensis6, Cryptotis parvus7,8, Sorex araneus9,10, Sorex fumeus11,12, and Sorex palustris13. As discussed in the Technical Validation section, these genome assemblies were based on Illumina short read data, sometimes in combination with long-range technologies such as Nanopore long reads or Hi-C, which enabled scaffolding but fell short of chromosome-level assembly. C. parvus is also a very small species – which makes it an interesting comparison with S. etruscus. C. parvus is a member of the subfamily Soricinae (the red-toothed shrews). The Soricinae are generally thought to have a higher metabolism than Crocidurinae. It is clear, however, that Suncus etruscus – as a collateral of its small size – has a particularly high metabolic rate and also shows neural specializations for metabolic control14.
We sequenced and assembled the Etruscan shrew genome, of a male, using protocols developed by the Vertebrate Genomes Project (VGP) to generate a reference-quality genome assembly15. Briefly, we used a combination of PacBio Continuous Long Read (CLR) sequencing, 10X Genomics linked reads, Bionano Genomics optical maps, and Arima Genomics Hi-C linked reads. PacBio reads were used to build the contigs and generate a pseudo-haplotype assembly, with a 2.472 Gbp primary and 1.515 Gbp alternate. 10x linked reads, optical maps, and Hi-C were used for scaffolding, and 10x linked reads were used to simultaneously polish the primary and the alternate assemblies. The primary assembly was manually curated, correcting 212 missing or missed joins, removing 28 sequences representing false haplotypic duplication, and assigning 99.9% of the sequence to 22 chromosomes, including X and Y. This karyotype was consistent with prior cytological studies16,17,18. The resulting reference assembly was highly contiguous, with scaffold N50 of 132 Mbp and contig N50 of 5 Mbp. Upon deposition to NCBI, it was annotated by the NCBI Eukaryotic Genome Annotation and Ensembl Rapid Release pipelines. The NCBI annotation pipeline identified 39,091 genes, 19,819 of them protein-coding. Ensembl Genebuild identified 37,534 genes, 19,562 protein-coding genes, 17,147 non-coding genes, and 825 pseudogenes.
We next computationally inferred Gene Ontology (GO) terms for the protein-coding genes predicted by NCBI using software developed in the Kihara Lab, including Protein Function Prediction (PFP)19, Phylogenetic tree-based Protein Function Prediction (Phylo-PFP)20, and Extended Similarity Group (ESG)21. Consensus GO terms were assigned to 26,579 protein products. We also computed protein-coding gene annotations and human/mouse orthologs using the Tool to infer Orthologs from Genome Alignments (TOGA)22. We used TOGA annotations of a set of ancestral mammalian genes to compare the quality of our assembly to other Eulipotyphla genomes, as discussed in the Technical Validation section below. Finally, we annotated segmental duplications as previously described23,24. Briefly, we identified resolved duplications by a whole genome self-alignment and collapsed ones by mapping CLR reads to the assembly and determining read depth using a hidden Markov model. We then used NCBI RefSeq annotations to identify genes that mapped to duplicated segments of the genome. Etruscan shrew has significantly fewer duplicated genes compared to several previously annotated species of rodents and artiodactyls23,24. GO terms, TOGA, and segmental duplications add significant value to the standard annotations provided by NCBI and Ensembl.
Methods
Sample collection and ethics statement
One adult male Etruscan shrew (Suncus etruscus) was provided by Dr. Michael Brecht, Bernstein Center for Computational Neuroscience, Humboldt University, Berlin, Germany. The shrew was captive-born and housed in Dr. Brecht’s colony25. All procedures complied with German regulations on animal welfare and were approved by an ethics committee26. Etruscan shrew tissue was collected according to a permit T0078/16 given to the Brecht group.
The Etruscan shrew was euthanized using an overdose of isoflurane and dissected under a microscope. Skin, heart, lung, and muscle tissue were collected for primary fibroblast culture, which would provide an unlimited source of cellular material for genomic and developmental studies. The shrew tissues were transferred into separate tubes containing ice-cold Alpha-MEM (Corning) with 1x Antibiotic-Antimitotic (Life Technologies). Tissues were minced individually with a scalpel and digested for 30 minutes at 37 °C in 0.5 ml of a 0.125 mg/ml solution of Liberase TM (Roche). 5 ml of pre-warmed fibroblast medium composed of a 50:50 mix of Alpha-MEM (Corning), 10% fetal bovine serum (Millipore) with 1x Antibiotic-Antimitotic (Life Technologies) and FBM complete (LONZA) was added to each digested tissue sample and transferred to gelatin-coated T25 tissue culture flasks (Corning). Spent medium was replaced carefully every other day without disturbing the adhering tissue pieces. After 7 days of incubation and maintenance at 37 °C, 5% CO2, 4% O2, a lung fibroblast culture began to develop. The remaining tissues failed to yield cell cultures and were discarded. Once the lung fibroblast culture reached confluency, it was passaged, banked, expanded, and sent to the Rockefeller University for genomic DNA isolation.
DNA isolation was performed at the Rockefeller University Vertebrate Genome Lab. Two million cells stored at −80 °C were used to extract high molecular weight DNA with the Bionano SP Blood and Cell Culture DNA Isolation Kit (Bionano PN 80042) following manufacturer’s protocols. This method utilizes gentle lysis and Nanobind magnetic disks to prevent DNA breakage and preserve large fragment lengths (>100–300 kb) needed for long-read sequencing.
Genome sequencing and assembly
PacBio and 10X sequencing, optical mapping, and Hi-C generation were performed by the Rockefeller University Vertebrate Genome Laboratory using standard VGP protocols as previously described in Secomandi et al.27. The genome was assembled as previously described in Secomandi et al.27, with minor modifications. Prior to the assembly, Genomescope2.028 was used on the raw 10X reads, yielding, through statistical analyses of k-mer profiles, an estimated genome size of 2.65 Gbp, heterozygosity of 0.22%, and repeat content of 0.75 Gbp. Genomescope2.0 was run with K = 31 on the histogram generated with Meryl version 1.0.029 using the 10X linked reads with barcodes (i.e., the first 23 bp of the forward read) trimmed off. Full details are available on VGP GenomeArk (https://genomeark.s3.amazonaws.com/index.html?prefix=species/Suncus_etruscus/mSunEtr1/assembly_vgp_standard_1.7/evaluation/genomescope/union_meryl_gs/). The assembly was performed on the DNAnexus cloud-based informatics platform for genomic data analyses (https://www.dnanexus.com) using the VGP standard genome assembly pipeline version 1.7 (https://github.com/VGP/vgp-assembly)15. PacBio subreads were used in the first FALCON version 2.0.230 contigging step. Pre-assembled contigs underwent a phasing step with FALCON-unzip version 8.0.131 (smrtanalysis v3.0.0) and a first round of Arrow30 (smrtanalysis version 5.1.0.26412) polishing. FALCON version 2.0.2 and FALCON-unzip version 8.0.1 were run with default parameters, with the exception of parameters related to the identification of read overlaps, which were adjusted as described in Secomandi et al.27. FALCON-unzip generated a set of primary contigs representing the primary pseudo-haplotype, and a set of alternate haplotigs, representing the secondary haplotypes. Purge_dups version 1.0.032 was run to identify and remove false duplications. This was confirmed by the removal of most 3- and 4-copy k-mers, as evidenced by k-mer spectra computed and visualized using KAT version 2.4.233 (Fig. 1).
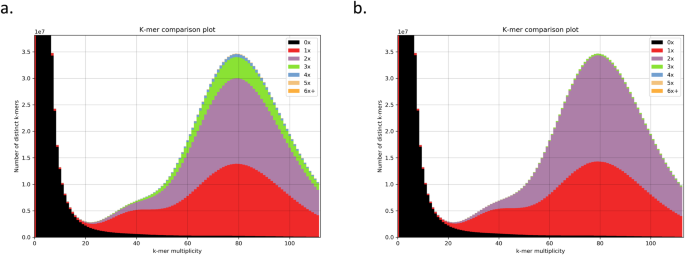
Removal of false duplications confirmed by k-mer spectra. K-mer spectra before (a) and after (b) false duplication removal.
After removing false duplications, a three-steps scaffolding strategy was performed on the purged primary contigs using Illumina short-reads (10x Genomics), Bionano optical maps and Hi-C reads. Two scaffolding rounds with scaff10X version 2.0.3 (https://github.com/wtsi-hpag/Scaff10X) were performed with options -matrix 2000 -reads 12 -link 10 and then -matrix 2000 -reads 8 -link 10. The resulting intermediate was then scaffolded with Bionano DLS optical maps34 using Bionano Solve version 3.4.0 in non-haplotype assembly mode with a DLE-1 one enzyme non-nicking approach. Finally, Hi-C scaffolding was performed as described in Secomandi et al.27. Briefly, Hi-C reads from Arima were aligned with the Arima Genomics mapping pipeline (https://github.com/ArimaGenomics/mapping_pipeline) and scaffolded with Salsa version 2.235 with -m yes -i 5 -p yes parameters and -e GATC,GANTC,CTNAG,TTAA as restriction enzymes. In order to improve per-base accuracy (QV)15, the assembly was polished as previously described in Secomandi et al.27. To prevent haplotype switches and overpolishing of nuclear mitochondrial DNA segments (NUMTs)15,36, the scaffolded primary assembly was merged with alternate combined haplotigs. The combined intermediate was polished with gcpp version 2.0.2 (pacific Biosciences; smrtanalysis version 5.1.0.26412) with the command ‘pbalign --minAccuracy = 0.75 --minLength = 50 --minAnchorSize = 12 --maxDivergence = 30 --concordant --algorithm = blasr --algorithmOptions = --useQuality --maxHits = 1 --hitPolicy = random --seed = 1’ for read alignment, and with ‘variantCaller --skipUnrecognizedContigs haploid -x 5 -q 20 -X120 -v --algorithm = arrow’ for consensus polishing, using PacBio CLR. Variant calls were filtered with merfin version 1.0 to reduce false positives. Two additional rounds of polishing with linked-reads were performed to generate the final polished assembly. In this step, raw-reads were aligned with Longranger align version 2.2.2 and variants were called with Freebayes version 1.3.137 with default parameters. Finally, bcftools version 1.9 (https://github.com/VGP/vgp-assembly/blob/master/dx_applets/bcftools_consensus/asset/Makefile) consensus38,39 with options -i 'QUAL > 1 && (GT = "AA" || GT = "Aa")' -Hla was used to generate the consensus.
We generated a complete reference mitochondrial sequence using mitoVGP version 2.236 with standard parameters. The mitogenome was annotated using MITOS240. We merged the mitochondrial assembly with the primary and alternate pseudohaplotypes of the nuclear genome prior to polishing, the mitochondrial genome serving as a sink to avoid overpolishing of the NUMTs. The Etruscan shrew mitogenome was typical of a mammal. It had a total length of 16,982 base pairs and a GC content of 34.74%. We did not detect any issues or anomalies, such as gene duplications.
Manual curation of the genome assembly
Manual curation of the generated assembly was performed using a previously described protocol by Howe et al.41. In order to remove contaminants, sequences were screened for trailing ‘N’ bases and clipped and VecScreen revision 87677 (https://www.ncbi.nlm.nih.gov/tools/vecscreen/) was run to remove known adaptors and barcodes. Mitochondrial sequences were removed following a blast check against the assembled mitochondrial genome. Finally the assembly was screened against the RefSeq genomes database for other potential species contamination.
Following contaminant screening, the scaffold assembly was visualized in gEVAL42 and the Hi-C contact matrix displayed in HiGlass version 1.11.743 and PretextView version 0.2.3 (https://github.com/wtsi-hpag/PretextView) in order to investigate the assembly and produce a chromosome scale reference. The curation corrected 212 missing or missed joins and removed 28 sequences representing haplotypic duplication. This resulted in a genome with 99.9% of sequence assigned to 22 chromosome-level scaffolds, including X and Y chromosomes.
Gene ontology (GO) annotation of protein-coding genes
Protein-coding genes were annotated by NCBI (https://www.ncbi.nlm.nih.gov/datasets/gene/GCF_024139225.1/?gene_type=protein-coding). To assign GO terms to protein-coding genes, we used three sequence-based protein function prediction methods: PFP19, Phylo-PFP20, and ESG21. The PFP algorithm uses a scoring method based on E-values to combine GO terms associated with PSI-BLAST44 sequence hits, and it then propagates scores to parental terms on the GO directed acyclic graph (DAG) according to the number of known sequences annotated with parent and child terms. Additionally, based on accuracy evaluations over a set of benchmark sequences, it assigns a confidence score to GO term predictions. Phylo-PFP is a modification of PFP that significantly improves the prediction performance by incorporating phylogenetic information in defining sequence similarity. The ESG method performs iterative sequence database searches and annotates a query sequence with GO terms. Each annotation is given a probability based on how similar it is to other sequences in the protein similarity graph.
To capture the significant GO terms annotations, we only considered the predictions with high confidence. The confidence score cutoff for PFP, Phylo-PFP, and ESG is 10,000, 0.7, and 0.4, respectively, and all GO terms with scores above the cutoff are reported in this analysis. To make our predictions more reliable, we also considered the consensus between different prediction methods and reported the GO term predicted as high confidence by any two of the three above-mentioned methods.
Annotation of protein-coding genes using TOGA
We used TOGA version 1.0 (https://github.com/hillerlab/TOGA)22 to assess gene completeness, provide coding gene annotations, and infer orthologs to human and mouse. Briefly, we first computed pairwise genome alignment chains between human (hg38 assembly, GRCh38.p12) and mouse (mm10, GRCm38) as the reference species and the Etruscan shrew as the query species, using lastz version 1.04.15 (parameters K = 2400, L = 3000, Y = 9400, H = 2000, default scoring matrix), axtChain version 1.0 (default parameters except linearGap = loose), RepeatFiller version 1.0, and chainCleaner version 1.0 (default parameters except minBrokenChainScore = 75,000 and -doPairs)45,46,47. We used TOGA version 1.0 with the human GENCODE V38 and mouse GENCODE M25 annotation as input (https://github.com/hillerlab/TOGA/tree/master/TOGAInput). TOGA then infers orthologous gene loci using machine learning and alignments of intronic and intergenic loci, and annotates and classifies orthologous genes. To compare assembly completeness and base accuracy, we considered 18,430 genes that already existed in the placental mammal ancestor48 (https://github.com/hillerlab/TOGA/blob/master/TOGAInput/human_hg38/Ancestral_placental.txt) and used a Python script, https://github.com/hillerlab/TOGA/blob/master/supply/TOGA_assemblyStats.py, with the human-referenced TOGA classification to count how many genes have an intact reading frame, inactivating mutations, or missing sequence due to assembly gaps or assembly fragmentation.
Segmental duplications
We identified segmental duplications and the duplicated genes using a combination of self-alignments and read depth (https://github.com/ChaissonLab/SegDupAnnotation2). Our workflow and the overview of duplicated genes are shown in Fig. 2a,b. Briefly, self-alignments enable identification of assembly segments that are highly similar to each other, constituting resolved duplications, while excessive read depth is indicative of collapsed duplications, where two or more copies of a genomic segment had not been resolved by the assembly process. In order to detect collapsed duplications, we mapped CLR reads to the assembly using minimap2 version 2.22 and determined read depth using a hidden Markov model49,50. We then used Etruscan shrew RefSeq annotations as gene models to identify duplicated genes also using minimap2 and Needleman Wunsch as implemented by edlib version 1.3.951,52. We were able to identify 15 such genes, six of which had collapsed duplications in the assembly and 10 resolved, with one gene having both (Table 1). Read depths of the four out of six genes with collapsed duplications were inconsistent across the length of the gene, suggesting the presence of truncated copies (Fig. 2c). We annotated such duplications as “partial”. Of the 189,717.5 collapsed kbps detected, 44.2 were in fully collapsed genes and 98,305.9 in partially collapsed genes. There were another 233.3 kbps in resolved duplications. Additionally, we found an 8 kbp segmental duplication to have an insertion in an intronic region of ADM2. This duplication was found at 74 loci across 21 chromosomes and is composed of 48% ancient mobile elements (0.66–0.83 similarity to consensus), primarily endogenous retroviruses ERV2-2-I_BT and HERVK, as well as Gypsy elements according to CENSOR53. This segmental duplication did not have any BLAST hits in the NCBI nr/nt database.

Segmental duplications. (a) Segmental Duplication Annotation Pipeline flowchart. (b) Mean gene copy depth over assembly depth plotted for all duplicated genes. The top plot highlights genes with collapses. The vertical gray line indicates the mean assembly coverage. (c) Coverage maps of partially collapsed genes. Mean coverage over gene and the assembly are shown in green and red respectively.
Data Records
Genome sequencing and assembly
Raw sequencing and mapping data are available from the VGP GenomeArk repository (https://genomeark.github.io/genomeark-all/Suncus_etruscus.html) and NCBI SRA study SRP45678754.
The primary genome assembly was deposited in NCBI GenBank under accession No. GCA_024139225.155. It is also available in Ensembl Rapid Release (https://rapid.ensembl.org/Suncus_etruscus_GCA_024139225.1/Info/Index) and the UCSC Genome Browser (https://genome.ucsc.edu/h/GCF_024139225.1).
The alternate pseudohaplotype was deposited in NCBI GenBank under accession No. GCA_024140225.156. It is also available in the UCSC Genome Browser (https://genome.ucsc.edu/h/GCA_024140225.1).
The mitochondrial genome sequence is available in NCBI GenBank, accession CM044019.157.
TOGA
TOGA annotations are available from the Senckenberg Genome Browser (https://genome.senckenberg.de/cgi-bin/hgTracks?db=HLsunEtr1) and for download from OSF58.
GO term predictions
GO term predictions are available on OSF59. GO Assignments are provided in an Excel file, GO_Prediction_Report_combined.xlsx. It contains the following worksheets:
-
(1)
Consensus: the consensus of the predictions from the three methods.
-
(2)
ESG: Raw prediction by ESG. Individual scores from ESG are also provided.
-
(3)
PhyloPFP: Raw prediction by PhyloPFP. Individual scores from PhyloPFP are also provided.
-
(4)
PFP: Raw prediction by PFP. Individual scores from PFP are also provided.
Each worksheet includes information about Gene ID, GO ID, Depth, Class, and GO Description. Here Gene ID is ID of genes, GO ID is the GO term ID, Depth is the depth of the GO ID in the GO DAG, Class is the GO functional category (f- molecular function, p- Biological process, c- Cellular Component), and GO Description describes the GO ID. The result files from PFP, Phylo-PFP, and ESG also include an additional field called Score, which represents the confidence score that the method assigned to that GO term. The Gene Ontology (data-version: releases/2021-11-16) was used for this analysis.
Segmental duplications
Segmental duplication analysis output is available on OSF60.
Technical Validation
Assembly quality assessment
Our assembly quality metrics computed with gfastats version 1.3.661 and Merqury version 1.329 are summarized in Table 2. The assembly is partially phased, with 2.5 Gbp primary and 1.5 Gbp alternate pseudohaplotypes. The primary pseudohaplotype is highly contiguous, with scaffold N50 of 132 Mbp and contig N50 of 5 Mbp. The QV of 38 indicates a fairly high base-level accuracy, although somewhat below the VGP target of 4015.
The curated primary assembly has been resolved into 20 autosomes and the X and Y sex chromosomes. A genome contact map generated using the PretextMap software (https://github.com/wtsi-hpag/PretextMap) shows that all chromosomes have clean intra-chromosome signals, with minimal inter-chromosome interactions (Fig. 3).

Genome-wide contact map of the curated primary assembly.
K-mer spectra for the primary and alternate pseudohaplotypes were computed using the Merqury software version 1.0.029. The spectra are clean, with many diploid regions shared between the two assemblies; however, there are still some homozygous areas missing from the alternate, which is to be expected. The plots do not indicate the presence of false duplicate k-mers in the primary assembly (Fig. 4). The primary spectra-cn (Fig. 4c) shows that the primary assembly retains much of the heterozygous regions, but does not have any false duplicates. Accordingly, the alternate spectra-cn (Fig. 4d) has a bump of read-only k-mers at haploid coverage, but these are the heterozygous regions that are present in the primary assembly, so they are not actually missing across the two pseudohaplotype assemblies. The primary assembly is the more complete of the two, containing both the homozygous regions as well as heterozygous variants (Fig. 4b).

K-mer spectra generated using the Merqury software. (a) K-mer spectrum colored by k-mer copy number across the primary and alternate assembly. (b) K-mer spectrum colored by which assembly (if any) the k-mer is found in (assembly_01 is the primary, assembly_02 the alternate). (c) Primary assembly k-mer spectrum colored by copy number. (d) Alternate assembly k-mer spectrum colored by copy number.
In addition to high contiguity and sufficient accuracy, the primary assembly is highly complete, having a BUSCO62,63 % Complete score of 94.9 with Laurasiatheria database version 10.
Comparison with other published genome assemblies within the same mammalian order
To compare the quality of our genome assembly to other published assemblies of Eulipotyphla genomes, we used an R script64 to retrieve and plot their quality metrics from the NCBI Assembly database. All of the other assemblies were based on short read technologies, with the exception of Talpa occidentalis (Iberian mole)65, which also used PacBio CLR, but not the VGP protocols for higher quality phasing, scaffolding, and curation. At the time of writing, our assembly was the most contiguous, having the highest contig N50 and scaffold N50 compared to the other assemblies. Contig N50 values of long-read-based assemblies tend to be orders of magnitude higher than those of short-read-based ones, as evidenced by Fig. 5a. For this study, this translated into having fewer fragmented genes as assessed by BUSCO62,63 (Fig. 5b). At the time of writing, BUSCO scores were only available for four Eulipotyphla genomes, of which ours had the highest % Complete and lowest % Fragmented score. The species and genome assembly versions included in this analysis are available on OSF66.

Quality metrics of Eulipotyphla genome assemblies reported by NCBI. The Etruscan shrew assembly is shown in red. (a) Contiguity. (b) Completeness, as measured by BUSCO scores.
We also assessed the status of 18,430 ancestral genes in Eulipotyphla genomes that had pre-computed TOGA22 results at the time of writing. Our assembly performed about average in terms of the number of intact ancestral open reading frames (ORFs) (Table 3). We had relatively few genes that had missing sequence, reflecting the high contiguity and completeness of our assembly. However, a relatively high number of ancestral genes had inactivating mutations: 2,405, compared to between 940 and 1,483 in other high-quality Eulipotyphla genomes. It is likely that many of these apparent mutations are really sequencing errors caused by the lower base-level accuracy of the version of PacBio technology used in this project compared to short read technologies, which could not be fully compensated for by polishing. Despite this issue, our assembly is of sufficiently high quality to serve as a useful reference for transcriptomics and most other purposes. The high contiguity, completeness, and thorough annotation make it a valuable resource for future studies of metabolism and development of one of the world’s smallest mammals.
Code availability
All code used in this project is publicly available. All relevant software and references are listed in Methods and Technical vation.
References
Anjum, F., Turni, H., Mulder, P. G. H., van der Burg, J. & Brecht, M. Tactile guidance of prey capture in Etruscan shrews. Proc. Natl. Acad. Sci. 103, 16544–16549 (2006).
Munz, M., Brecht, M. & Wolfe, J. Active Touch During Shrew Prey Capture. Front. Behav. Neurosci. 4, (2010).
Roth-Alpermann, C., Anjum, F., Naumann, R. & Brecht, M. Cortical Organization in the Etruscan Shrew (Suncus etruscus). J. Neurophysiol. 104, 2389–2406 (2010).
Brecht, M. & Anjum, F. Tactile experience shapes prey-capture behavior in Etruscan shrews. Front. Behav. Neurosci. 6, (2012).
Hutterer, R. Order Soricomorpha. in Mammal Species of the World: A Taxonomic and Geographic Reference (eds. Wilson, D. E. & Reeder, D. M.) 220 (JHU Press, 2005).
Broad Institute. Crocidura indochinensis genome assembly CroInd_v1_BIUU, GenBank. NCBI https://identifiers.org/ncbi/insdc.gca:GCA_004027635.1 (2019).
National Institutes of Health. Cryptotis parvus genome assembly Cryptotis parva assembly 1.0, GenBank. NCBI https://identifiers.org/ncbi/insdc.gca:GCA_021461705.1 (2022).
Chung, D. J. et al. Metabolic design in a mammalian model of extreme metabolism, the North American least shrew (Cryptotis parva). J. Physiol. 600, 547–567 (2022).
Broad Institute. Sorex araneus genome assembly SorAra2.0, GenBank. NCBI https://identifiers.org/ncbi/insdc.gca:GCA_000181275.2 (2012).
Lindblad-Toh, K. et al. A high-resolution map of human evolutionary constraint using 29 mammals. Nature 478, 476–482 (2011).
Cossette, M.-L. et al. Epigenetics and island-mainland divergence in an insectivorous small mammal. Mol. Ecol. 32, 152–166 (2023).
Trent University. Sorex fumeus genome assembly SorCin_1.0, GenBank. NCBI https://identifiers.org/ncbi/insdc.gca:GCA_026122425.1 (2022).
IRIDIAN GENOMES. Sorex palustris genome assembly ASM2856567v1, GenBank. NCBI https://identifiers.org/ncbi/insdc.gca:GCA_028565675.1 (2023).
Sun, S. & Brecht, M. Relative enlargement of the medial preoptic nucleus in the Etruscan shrew, the smallest torpid mammal. Sci. Rep. 12, 18602 (2022).
Rhie, A. et al. Towards complete and error-free genome assemblies of all vertebrate species. Nature 592, 737–746 (2021).
Meylan, A. Note sur les chromosomes de la musaraigne etrusque Suncus etruscus (Savi) (Mammalia-Insectivora). Bull. Société Vaudoise Sci. Nat. 70, 85–89 (1968).
Aswathanarayana, N. V., Krishnarao, S. & Satya-prakash, K. L. Karyology of the pigmy shrew, Suncus etruscus perrotteti (Savi) (Soricidae: Insectivora). Curr. Sci. 56, 911–913 (1987).
Aswathanarayana, N. V. Karyotype Evolution in the Shrews, Crocidura and Suncus (Soricidae, Insectivora). Cytologia (Tokyo) 68, 83–87 (2003).
Hawkins, T., Chitale, M., Luban, S. & Kihara, D. PFP: Automated prediction of gene ontology functional annotations with confidence scores using protein sequence data. Proteins 74, 566–582 (2009).
Jain, A. & Kihara, D. Phylo-PFP: improved automated protein function prediction using phylogenetic distance of distantly related sequences. Bioinformatics 35, 753–759 (2019).
Chitale, M., Hawkins, T., Park, C. & Kihara, D. ESG: extended similarity group method for automated protein function prediction. Bioinformatics 25, 1739–1745 (2009).
Kirilenko, B. M. et al. Integrating gene annotation with orthology inference at scale. Science 380, eabn3107 (2023).
Bukhman, Y. V. et al. A high-quality blue whale genome, segmental duplications, and historical demography. https://doi.org/10.21203/rs.3.rs-1910240/v1 (2022).
Toh, H. et al. A haplotype-resolved genome assembly of the Nile rat facilitates exploration of the genetic basis of diabetes. BMC Biol. 20, 245 (2022).
Geyer, B. et al. Establishing and Maintaining an Etruscan Shrew Colony. J. Am. Assoc. Lab. Anim. Sci. 61, 52–60 (2022).
Naumann, R. K., Anjum, F., Roth-Alpermann, C. & Brecht, M. Cytoarchitecture, areas, and neuron numbers of the Etruscan Shrew. cortex. J. Comp. Neurol. 520, 2512–2530 (2012).
Secomandi, S. et al. A chromosome-level reference genome and pangenome for barn swallow population genomics. Cell Rep. 42, 111992 (2023).
Ranallo-Benavidez, T. R., Jaron, K. S. & Schatz, M. C. GenomeScope 2.0 and Smudgeplot for reference-free profiling of polyploid genomes. Nat. Commun. 11, 1432 (2020).
Rhie, A., Walenz, B. P., Koren, S. & Phillippy, A. M. Merqury: reference-free quality, completeness, and phasing assessment for genome assemblies. Genome Biol. 21, 245 (2020).
Klammer, A. A. et al. Nonhybrid, finished microbial genome assemblies from long-read SMRT sequencing data. Nat. Methods 10, 563 (2013).
Chin, C.-S. et al. Phased diploid genome assembly with single-molecule real-time sequencing. Nat. Methods 13, 1050 (2016).
Guan, D. et al. Identifying and removing haplotypic duplication in primary genome assemblies. Bioinformatics https://doi.org/10.1093/bioinformatics/btaa025 (2020).
Mapleson, D., Garcia Accinelli, G., Kettleborough, G., Wright, J. & Clavijo, B. J. KAT: a K-mer analysis toolkit to quality control NGS datasets and genome assemblies. Bioinforma. Oxf. Engl. 33, 574–576 (2017).
Formenti, G. et al. SMRT long reads and Direct Label and Stain optical maps allow the generation of a high-quality genome assembly for the European barn swallow (Hirundo rustica rustica). GigaScience 8, giy142 (2019).
Ghurye, J. et al. Integrating Hi-C links with assembly graphs for chromosome-scale assembly. PLOS Comput. Biol. 15, e1007273 (2019).
Formenti, G. et al. Complete vertebrate mitogenomes reveal widespread repeats and gene duplications. Genome Biol. 22, 120 (2021).
Garrison, E. & Marth, G. Haplotype-based variant detection from short-read sequencing. Preprint at https://doi.org/10.48550/arXiv.1207.3907 (2012).
Li, H. A statistical framework for SNP calling, mutation discovery, association mapping and population genetical parameter estimation from sequencing data. Bioinformatics 27, 2987–2993 (2011).
Danecek, P. et al. Twelve years of SAMtools and BCFtools. GigaScience 10, giab008 (2021).
Bernt, M. et al. MITOS: Improved de novo metazoan mitochondrial genome annotation. Mol. Phylogenet. Evol. 69, 313–319 (2013).
Howe, K. et al. Significantly improving the quality of genome assemblies through curation. GigaScience 10, giaa153 (2021).
Chow, W. et al. gEVAL — a web-based browser for evaluating genome assemblies. Bioinformatics 32, 2508–2510 (2016).
Kerpedjiev, P. et al. HiGlass: web-based visual exploration and analysis of genome interaction maps. Genome Biol. 19, 125 (2018).
Altschul, S. F. et al. Gapped BLAST and PSI-BLAST: a new generation of protein database search programs. Nucleic Acids Res. 25, 3389–3402 (1997).
Kent, W. J., Baertsch, R., Hinrichs, A., Miller, W. & Haussler, D. Evolution’s cauldron: Duplication, deletion, and rearrangement in the mouse and human genomes. Proc. Natl. Acad. Sci. 100, 11484–11489 (2003).
Osipova, E., Hecker, N. & Hiller, M. RepeatFiller newly identifies megabases of aligning repetitive sequences and improves annotations of conserved non-exonic elements. GigaScience 8, giz132 (2019).
Suarez, H. G., Langer, B. E., Ladde, P. & Hiller, M. chainCleaner improves genome alignment specificity and sensitivity. Bioinformatics 33, 1596–1603 (2017).
Blumer, M. et al. Gene losses in the common vampire bat illuminate molecular adaptations to blood feeding. Sci. Adv. 8, eabm6494 (2022).
Li, H. Minimap2: pairwise alignment for nucleotide sequences. Bioinformatics 34, 3094–3100 (2018).
Li, H. New strategies to improve minimap2 alignment accuracy. Bioinformatics 37, 4572–4574 (2021).
Needleman, S. B. & Wunsch, C. D. A general method applicable to the search for similarities in the amino acid sequence of two proteins. J. Mol. Biol. 48, 443–453 (1970).
Šošić, M. & Šikić, M. Edlib: a C/C ++ library for fast, exact sequence alignment using edit distance. Bioinformatics 33, 1394–1395 (2017).
Kohany, O., Gentles, A. J., Hankus, L. & Jurka, J. Annotation, submission and screening of repetitive elements in Repbase: RepbaseSubmitter and Censor. BMC Bioinformatics 7, 474 (2006).
NCBI Sequence Read Archive. https://identifiers.org/ncbi/insdc.sra:SRP456787 (2023).
Vertebrate Genomes Project. Suncus etruscus genome assembly mSunEtr1.pri.cur. Genbank. https://identifiers.org/ncbi/insdc.gca:GCA_024139225 (2022).
Vertebrate Genomes Project & NCBI. mSunEtr1.alt.cur - Genome - Assembly - NCBI, GCA_024140225.1. NCBI Assembly Database https://identifiers.org/ncbi/insdc.gca:GCA_024140225.1 (2022).
Suncus etruscus isolate mSunEtr1 mitochondrion, complete sequence, whole genome shotgun sequence. GenBank. https://identifiers.org/ncbi/insdc:CM044019 (2022).
Hiller, M. et al. TOGA, Etruscan shrew genome paper supplementary materials. OSF, https://doi.org/10.17605/OSF.IO/X4EWT (2024).
Giri, S. J. et al. GO Term Predictions, Etruscan shrew genome paper supplementary materials. OSF https://doi.org/10.17605/OSF.IO/VS7Y8 (2022).
Rabbani, K. et al. Segmental duplications, Etruscan shrew genome paper supplementary materials. OSF https://doi.org/10.17605/OSF.IO/QZSJ6 (2022).
Formenti, G. et al. Gfastats: conversion, evaluation and manipulation of genome sequences using assembly graphs. Bioinformatics 38, 4214–4216 (2022).
Simão, F. A., Waterhouse, R. M., Ioannidis, P., Kriventseva, E. V. & Zdobnov, E. M. BUSCO: assessing genome assembly and annotation completeness with single-copy orthologs. Bioinformatics 31, 3210–3212 (2015).
Manni, M., Berkeley, M. R., Seppey, M., Simão, F. A. & Zdobnov, E. M. BUSCO Update: Novel and Streamlined Workflows along with Broader and Deeper Phylogenetic Coverage for Scoring of Eukaryotic, Prokaryotic, and Viral Genomes. Mol. Biol. Evol. 38, 4647–4654 (2021).
Bukhman, Y. V. et al. taxon_assembly_stats.R, Eulipotyphla genomes quality stats. OSF https://doi.org/10.17605/OSF.IO/3PK9G (2023).
Max Planck Institute for Molecular Genetics. Talpa occidentalis genome assembly MPIMG_talOcc4v2, GenBank. NCBI https://identifiers.org/ncbi/insdc.gca:GCA_014898055.2 (2020).
Bukhman, Y. V. et al. NCBI_qc_stats.csv, Eulipotyphla genomes quality stats. OSF https://doi.org/10.17605/OSF.IO/3PK9G (2023).
Acknowledgements
This project was supported by the Morgridge Institute for Research departmental funds. MH is supported by the LOEWE-Centre for Translational Biodiversity Genomics (TBG) funded by the Hessen State Ministry of Higher Education, Research and the Arts (HMWK). MJPC and KR are supported by NSF CAREER 2046753. DK acknowledges support from NSF (DBI2003635, DBI2146026, IIS2211598, DMS2151678, CMMI1825941, and MCB1925643) and NIH (R01GM133840). EDJ and the Vertebrate Genome Lab acknowledge support from Rockefeller University and HHMI. The authors thank Saikat Ray for assistance in collecting Etruscan shrew samples. Alicia Williams helped with structure, style, and grammar of the manuscript.
Author information
Authors and Affiliations
Contributions
J.A.T., R.S., L.F.C., S.M., E.D.J. and Y.V.B. conceived, designed, and coordinated the project. M.B., S.M., J.A.B., L.F.C. and D.M. collected and prepared the sample. J.B., J.M. and O.F. prepared DNA, sequenced, and mapped the genome. E.D., A.F. and G.F. assembled the genome. A.T., J.M.D.W. and K.H. curated the assembly. M.H. computed T.O.G.A. annotations. S.J.G. and D.K. computed G.O. terms. K.R. and M.J.P.C. computed segmental duplications. L.A. computed assembly Q.C. metrics. Y.V.B. and M.H. compared this assembly to others of the same mammalian order. Y.V.B., L.F.C., M.B., G.F., J.M.D.W., K.R., M.J.P.C. and M.H. co-wrote the manuscript. All authors read, revised, and approved the final version of the manuscript.
Corresponding author
Ethics declarations
Competing interests
The authors declare no competing interests.
Additional information
Publisher’s note Springer Nature remains neutral with regard to jurisdictional claims in published maps and institutional affiliations.
Rights and permissions
Open Access This article is licensed under a Creative Commons Attribution 4.0 International License, which permits use, sharing, adaptation, distribution and reproduction in any medium or format, as long as you give appropriate credit to the original author(s) and the source, provide a link to the Creative Commons licence, and indicate if changes were made. The images or other third party material in this article are included in the article’s Creative Commons licence, unless indicated otherwise in a credit line to the material. If material is not included in the article’s Creative Commons licence and your intended use is not permitted by statutory regulation or exceeds the permitted use, you will need to obtain permission directly from the copyright holder. To view a copy of this licence, visit http://creativecommons.org/licenses/by/4.0/.
About this article

Cite this article
Bukhman, Y.V., Meyer, S., Chu, LF. et al. Chromosome level genome assembly of the Etruscan shrew Suncus etruscus. Sci Data 11, 176 (2024). https://doi.org/10.1038/s41597-024-03011-x
Received:
Accepted:
Published:
DOI: https://doi.org/10.1038/s41597-024-03011-x
